Introduction
Besides employment rates, the extent and evolution of (long-term) unemployment rates are often used as benchmark indicators for assessing the comparative performance of national employment systems. However, in addition to the individual state of ‘unemployment’, there are other (competing) non-employment states (for example, unpaid housework and child care, retirement, incapacity, [further] education) that should be accounted for when the performance of national employment systems is compared (see Clasen et al., Reference Clasen, Davidson, Ganßmann and Mauer2006). Therefore, in this article, the authors have chosen a broader perspective beyond unemployment by including all categories of working-age populations who are not in work. The focal question is how different national employment systems deal with those parts of the population that are difficult to integrate into employment. By complementing OECDFootnote 1 data drawn from administrative sources with individual survey data, the authors could control for national differences in demographics, health conditions or skills structure. Using individual data also allows focusing on hard-to-place target groups, such as older or low-skilled people, as well as those occupied primarily with ‘household and care’, which do not figure in the benefit recipients list of administrative data except for short-term benefits such as ‘maternity and care’. In this way, nationally specific family models and gender relations are laid open.
It should be noted that, for this study, Germany has been taken as the reference country. This is because, during the last decade, Germany was portrayed as the ‘Sick Man of Europe’ whose salvation was considered doubtful (Barysch, Reference Barysch2003; Samuelson, Reference Samuelson2002). High levels of unemployment were taken as a solid proof of the German Standort, offering no incentives for employers to create jobs (Siebert, Reference Siebert1997). Countries with apparently lower unemployment – like the US – or those with ongoing reforms apparently coming along with shrinking unemployment – like the UK, the Netherlands and Denmark – were the prominent benchmarks for German reformers (Thode, Reference Thode2002). Therefore, this study investigates the differences in non-employment between Germany and other countries, namely the Netherlands, Demark, the United Kingdom (UK) and the United States (US). France is also included in this study, because – like Germany – France also allegedly shows poor labour market performance as compared to the other four countries under investigation (Garton Ash, Reference Garton Ash2005).
The article is organised as follows. We first discuss the complementarities of various categories of social benefits available to people of working age in developed welfare states. It also demonstrates the highly divergent proportioning of benefit categories among the six countries under consideration. We then introduce the data and variables used in this study and describe the strategy of analysis followed. We go on to describe how the data are analysed following a descriptive approach first and then a multivariate approach. A later section provides some institutional background explaining the findings. Finally, we conclude by focusing on the policy and research issues involved.
Non-employment and receipt of benefits not related to unemployment
There is already a broad international research on the interplay between different categories of non-employment and the social benefits associated with them. In the US, the role of disability insurance benefits in absorbing labour market shocks, particularly of older and low-skilled males, has long been demonstrated (Parsons, Reference Parsons1980; Gruber and Kubik, Reference Gruber and Kubik1997; Black et al., Reference Black, Daniel and Sanders2002; Burkhauser et al., Reference Burkhauser, Butler and Weathers2001; Bound and Waidmann, Reference Bound and Waidmann2002; Autor and Duggan, Reference Autor and Duggan2003, Reference Autor and Duggan2006; Hotchkiss, Reference Hotchkiss2004; Stewart, Reference Stewart2006). Similar evidence has been produced for Canada (Gruber, Reference Gruber2000; Campolieti, Reference Campolieti2004), the UK (Green, Reference Green1999; Beatty and Fothergill, Reference Beatty and Fothergill2005) and the Netherlands (Becker, Reference Becker2000; Van Vuren and Van Vuuren, Reference Van Vuren and Van Vuuren2007).
Most of this literature is focused on the fiscal and social consequences of disability benefits in their respective national contexts. Internationally, comparative analyses of labour market performance, by contrast, tend to take unemployment as a given. It is usually not discussed to what extent the national level of unemployment may be influenced not only by employment opportunities, but also by the relative ease of availability of benefits other than unemployment-related wage replacements. In its 2003 Employment Outlook, the OECD has, for the first time, provided internationally comparative data on rates of receipt of different categories of benefits for the period 1980 to 1999 (Grubb and Miyamoto, Reference Grubb and Miyamoto2003). However, the OECD's main concern has been about overall ‘benefit dependency’.
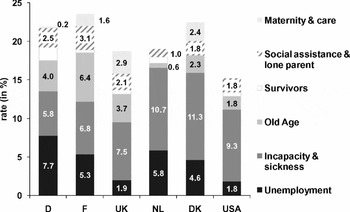
Data from the OECD database allow an update of these comparisons for 2004 (Figure 1).Footnote 2 First, it seems remarkable how little the overall benefit dependency rates of working-age populations differ between countries, which – according to conventional wisdom – are miles apart in their labour market performances. However, the composition of these ‘benefit dependent’ populations differs vastly in terms of benefit category. France leads in granting old age pensions before the age of 65; Denmark is the champion in granting benefits to those who suffer from incapacity or sickness; and Germany, as would be expected, scores top in granting benefits related to unemployment.
Percentages of working-age populations (15–64) receiving social benefits, by type of benefit, 2004.
Source: OECD database on Recipients of Social Benefits, unpublished estimates supplied to the authors by Mr Peter Whiteford (OECD).

These results are largely in line with the few existing international comparative analyses of non-employment. With regard to incapacity benefits, Bound and Burkhauser (Reference Bound, Burkhauser, Ashenfelter and Card1999) demonstrated a similar ranking among the USA, the Netherlands, Sweden and Germany. Analysing representative survey data of people aged between 50 and 65, Börsch-Supan (Reference Börsch-Supan2007) argues that the large disparity between national incapacity rates cannot be attributed to differences in health status or demographic factors, and that it appears to be primarily due to institutional differences.
From these comparisons, it may be inferred that an international benchmarking of labour market performance should not be based on employment and unemployment rates alone, as is the standard procedure. Alternative states of non-employment qualifying for a benefit must be taken into account when comparing unemployment; national family policies and breadwinner arrangements must be considered when comparing employment. Viewed from this perspective, a social benefit status such as unemployment or incapacity for work is not a ‘given fact’, but the result of a complex interaction between employment opportunities and incentives, personal characteristics relevant to employability, and institutional gatekeeping at the entrances to alternative categories of benefits. Aggregate data from administrative sources, like the data presented in Figure 1, can only point to the importance of institutional differences. It seems unlikely that the Danes are almost twice as sick as the Germans, but perhaps they are. For assessing to what extent institutional differences matter, one needs individual data, including at least some personal characteristics.
The following analysis of individual survey data endeavours to shed some light on the significance of institutional factors. While Börsch-Supan (Reference Börsch-Supan2007), in the pursuit of similar questions, used the survey of older people aged 50 and over, the present study has used surveys of entire populations. This allows us to examine to what extent cross-country differences are caused by different status ascriptions only in old age or across all ages. Besides age, gender and level of educational attainment will have to be the main dimensions of differentiation.
Data and strategy of analysis
Data
The following analyses are based on the European Social Survey (ESS). The ESS is a family of 24 nationally representative current population surveys using a common questionnaire. This is financed jointly by the European Commission, the European Science Foundation and the respective national research councils. Great care has been taken to frame questions that will be understood more or less the same way in the different languages and cultural contexts concerned. There are currently three waves available: 2001, 2004 and 2007. While restricting the European comparison to Germany, France, the Netherlands, Denmark and the UK, the 2005 US survey ‘Citizenship, Involvement, Democracy’ (CID), which used identical questions in some subject matters related to this study, is included (see www.europeansocialsurvey.com for details on ESS and www.uscidsurvey.org for details on CID).
Because the CID data come from 2005, it has been decided to use the 2004 ESS data for analyses. In this study, respondents up to the age of 67 have been included, because the data provide information only on the year of birth and thus it has been possible to calculate the approximate but not the exact age. This approach ensures the true coverage of the working-age population. The study excludes respondents below the age of 20, because their reported status depends to a large extent on how the attainment of vocational qualifications and skills is organised in different countries with different compositions of learning in schools, colleges, apprenticeships or simply ‘on the job’ (Bosch and Charest, Reference Bosch and Charest2008).
Variables
Categories of activity and inactivity
The dependent variable for analysis of this study is non-employment of different categories. It was constructed from answers to the following question included in both the ESS and the CID: ‘Which of these descriptions applies to what you have been doing for the last 7 days? Select all that apply.’
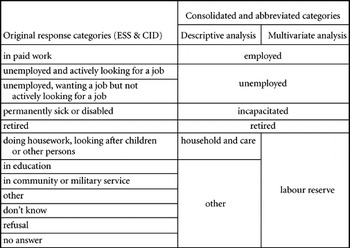
Nine different answer categories are documented in the first column of Table 1. Respondents who had chosen more than one category were asked to select the one that would ‘best’ describe their situation in the previous seven days. Hence, the analysis presented here is based on this principal status of the last seven days except when ‘in paid work’ had been combined with ‘doing housework, looking after children or other persons’. Such respondents were labelled ‘employed’, in accordance with international labour force statistics. As indicated in Table 1, some categories were consolidated because they were too small. Therefore, five different categories of non-employment (‘unemployed’, ‘incapacitated’, ‘retired’, ‘household and care’ and ‘others’) have been used for descriptive analyses. For the purpose of multivariate analysis, the number of categories was reduced even further by merging ‘household and care’ and ‘others’ with the category ‘labour reserve’, as indicated in the right-hand column of Table 1.
Response and consolidated categories

It should be noted that these ascriptions of subjective status in the survey do not necessarily correspond to the definition of individuals’ ‘objective’ administrative status. For example, older German respondents receiving unemployment benefits may have described themselves as ‘retired’, because unemployment was (and, to some degree, still is) an accepted pathway into retirement in Germany. However, this ‘misreporting’ is a social reality by itself. Besides, letting people describe their own status in rather broad, cross-nationally applicable terms and making them choose one status ascription as the principal one solves, in a rather elegant way, many tedious problems of international comparability of social benefits as well as problems of status overlap and resulting double-counts. To attain a benefit status, people have to apply and define their situation in a way that shapes their self-perception. It may therefore be assumed that response patterns regarding a person's employment or non-employment status are culturally less specific than what has been demonstrated in terms of subjective well-being (Jürges, Reference Jürges2007), the degree of a person's impairment (Kapteyn et al., Reference Kapteyn, Smith and Soest2007), or subjective job insecurity (Erlinghagen, Reference Erlinghagen2008).
Control variables
It is reasonable to assume that being employed as well as being in one or the other sub-category of non-employment is influenced by socioeconomic and demographic factors. If national populations differ greatly in these respects, then these differences, rather than the institutional differences, might explain different national benefit receipt rates as well as the distribution among non-employment categories. Within the limits of the variables available in the ESS, the authors have been controlling for gender, age, educational levels (higher and lower),Footnote 3 and subjective health status ([very] good, satisfactory, [very] poor). The choice of control variables was somewhat restricted by differences between the ESS and the CID, which are only partially congruent.
Against the backdrop of contemporary discourses on labour market performance and labour market policies, it has been found desirable to include the US in the analysis, thus making some compromises regarding the richness of variables acceptable. However, the authors also estimated multinomial regressions, including additional control variables, which are available only in the ESS, thus excluding the US. In these models, two more health indicators were included: the respondents’ assessment of restriction in daily activities by a chronic health condition,Footnote 4 and the frequency of calling a doctor during the past 12 months (0 to 3, 4 to 10, and more than 10 visits). Further, the size of the household and the partnership status (living with partner or alone) were included in the models. While the overall fit of the models was slightly improved by this extension, the basic findings regarding the differences between countries remained unchanged. The authors, therefore, document these extended models only in the regression tables of the Appendix, while restricting the graphic representations to the models poorer in individual variables but richer in the countries covered.
Analysis strategy
First, descriptive results are presented on the extent and structure of non-employment in the six countries under investigation. In addition to overall figures, results are shown for older people (50 years and older) as well as for less well-educated individuals. The figures are complemented by gender-specific results. Gender-specific analysis is crucial for this investigation, because besides general differences in employment participation between men and women, some gender-specific differences in non-employment status also are likely to occur. It can be assumed that the institutions within different welfare state regimes (Esping-Andersen, Reference Esping-Andersen1990) are gender-sensitive (Lewis, Reference Lewis1992; Sainsbury, Reference Sainsbury1996; Dingeldey, Reference Dingeldey2002) and should have, therefore, a certain impact on the structure of non-employment in the six countries under investigation.
After descriptive analysis, multinomial logistic regressions (Hosmer and Lemshow, Reference Hosmer and Lemeshow2000: 260ff) are estimated. Only those individuals who were not employed at the time of interview are included in the estimations. ‘Unemployment’ is the reference of non-employment status, and (a) ‘incapacitated’, (b) ‘retired’ and (c) ‘labour reserve’ of competing non-employment status. The results are presented as relative risk ratios (RRR). As Germany is the reference country for the analyses, RRR of the other five countries – namely France, Denmark, the Netherlands, the UK and the USA – are of special interest. The results provide evidence of the extent to which individual propensities to be unemployed rather than to be in one of the three alternative non-employment statuses differ between countries, controlling for demographic and social-structural variables.
Results
Descriptive approach
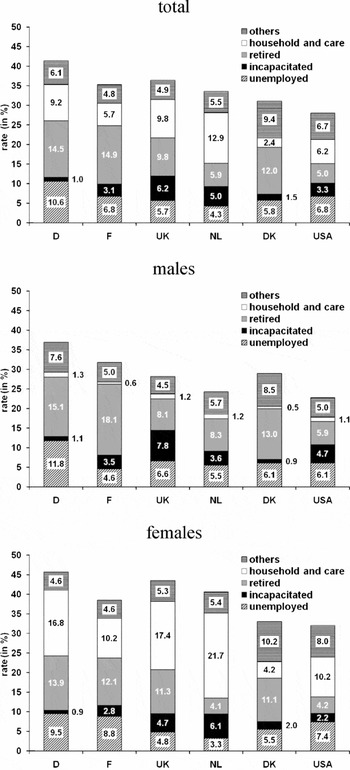
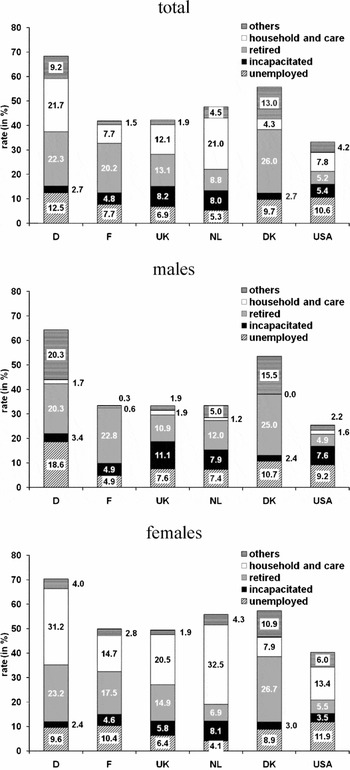
Figure 2 depicts the comparative composition of non-employment states between the six countries concerned. In contrast to Figure 1, ‘household and care’ is included as a non-employment category, which is only partially reflected in ‘maternity and care’ benefits of the administrative data in Figure 1. The breakdown by gender shows that household and care is still largely a female category in all the six countries. The vast difference between 2.4 per cent (Denmark) and 12.9 per cent (Netherlands) of working-age respondents describing their status as being in ‘household and care’ (Figure 2) underlines how the Western developed countries are still far apart in terms of their family models.
Percentages of populations aged 20 to 67 by categories of non-employment, 2004/2005 (total and by gender).
Source: ESS and CID (weighted), authors’ calculations.

Looking at Figure 2, it is not surprising that the overall order of magnitude of non-employment is somewhat higher than that of benefit receipt in Figure 1, because people may report as ‘unemployed’, ‘unable to work’, or ‘retired without receiving unemployment benefits’, ‘incapacity benefits’ or ‘pension’, respectively. Besides, the surveys included states such as ‘household and care’ and ‘in education’ (part of ‘other’), which are not normally associated with a benefit. Nevertheless, subjective self-ascription of status appears to match remarkably well with the administrative status ascription. The nation-specific dominance of certain categories goes thus: Germans, if not working, tend to be ‘unemployed’ or ‘retired’, but rarely ‘incapacitated’; non-working British and Dutch tend to be ‘incapacitated’. However, many fewer Danes report that status than the administrative data would lead us to assume (a tentative explanation for this finding will be discussed below). Likewise, for the US, subjective reporting appears to produce a shift from ‘incapacitation’ to ‘unemployment’ in comparison to the administrative count (see Figure 1). With regard to the status ‘other’, it should be kept in mind that this includes education and that populations aged from 20 years onward are under consideration.
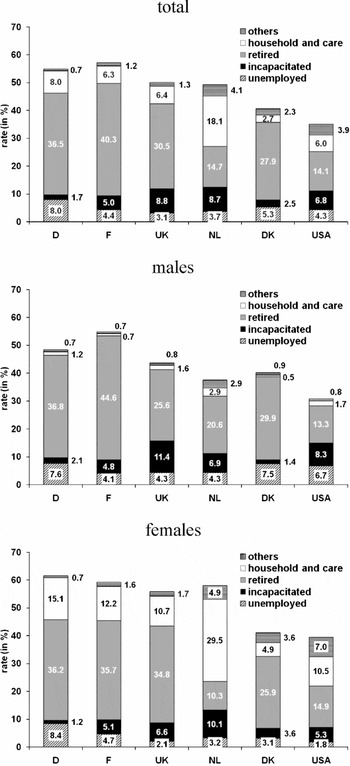
Restricting the analysis to respondents aged 50-plus (but not older than 67), it comes as no surprise that the overall percentages of non-employment become much higher and that retirement becomes the most important category in most countries (Figure 3). Dutch older women are a notable exception, because they tend to describe themselves as housewives rather than retirees. The ranking order of countries is reciprocal to that of European employment rates. National specificities remain: unemployment is highest among older Germans, while incapacitation is rare in Germany, even in older people. The UK and the Netherlands remain in the frontline with regard to ‘incapacitation’, but the US catches up when it comes to older respondents. A tentative conclusion would be that ‘incapacitation’ serves as an alternative to insufficient pensions in the US, whereas in Germany restricted access to incapacity benefits renders unemployment the alternative to early retirement, as will be further explained later.
Percentages of populations aged 50 to 67 by categories of non-employment, 2004/2005 (total and by gender).
Source: ESS and CID (weighted), authors’ calculations.

Restricting the analysis to respondents of lower educational level provides yet another perspective (Figure 4). It should be noted that again the whole range of ages from 20 to 67 is taken into account. Viewed from this perspective, cross-national differences become remarkable. Germany and Denmark are the countries where respondents of lower educational level suffer the highest risk of exclusion from employment.Footnote 5 High proportions of the category ‘other’ in these two countries can, to some degree, be attributed to labour market training programmes. Germany and Denmark are also the countries with the highest proportion of retirees in the low-skilled population. Not surprisingly, in most countries under consideration, ‘household and care’, as a status description, is more common among low-skilled women than in the female population as a whole.
Percentages of populations aged 20 to 67 with lower educational level by categories of non-employment, 2004/2005 (total and by gender).
Source: ESS and CID (weighted), authors’ calculations.

Multivariate approach
Aggregates of administrative as well as survey data show that while the differences between countries in terms of inactivity as a whole are high, the differences in the relative importance of specific categories of non-employment are even higher. From this perspective, unemployment emerges not only as the counterpart of employment, but also as the complement of other socially accepted and institutionally defined states of non-employment. To some extent this could be due to differences between nations in demographic or socioeconomic composition. The health status of British people might be more fragile, warranting an incapacity status more frequently than in the other countries, while population ageing might be more advanced in France, warranting a higher proportion of pensioners there even when considering only persons no older than 67.
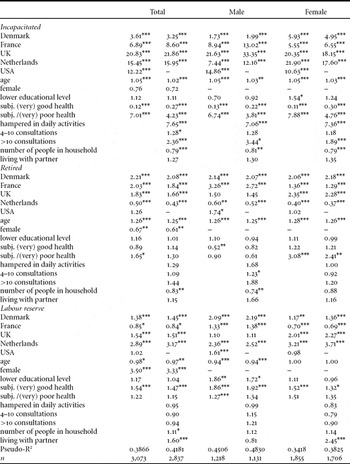
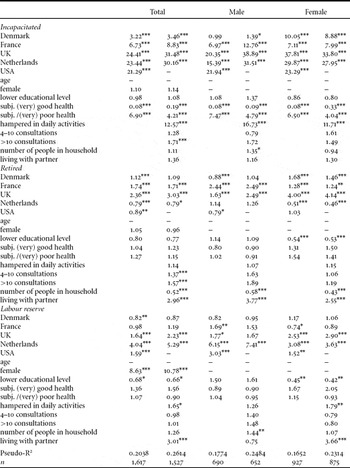
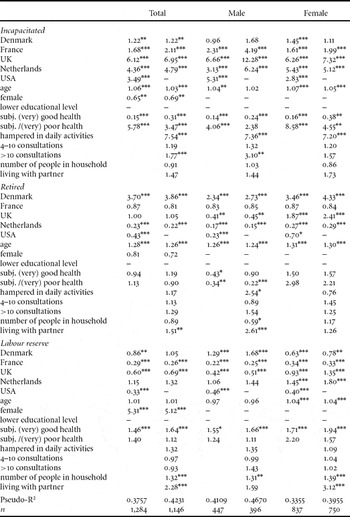
To control for such differences, multinomial logistic regressions have been estimated. Relative Risk Ratios (RRR) were calculated instead of coefficients. An RRR of ‘1’ means identical risk; values >1 mean increased risk ratio and <1 reduced risk ratio. For the sake of graphical clarity, RRR values between 0 and 1 have been represented as negative reciprocal values (1/RRR*[–1]), thus producing bars extending to the left for reduced risk ratios (detailed estimates are provided in Tables A1 to A3 in the Appendix). The estimations presented here include all control variables described in the ‘Variables’ section above. It should be noted that Figures 5 to 7 graphically show only the RRRs for different countries, but the results for other control variables are omitted. The complete estimation results can be found in the Appendix.
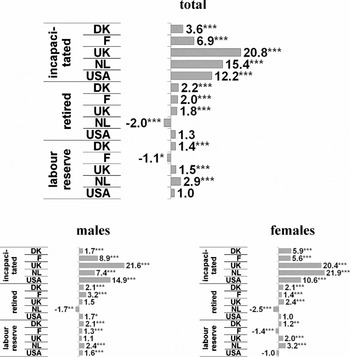
Relative risks of reporting categories of non-employment other than unemployment in international comparison to Germany.
significance: *p <= 0.1 **p <= 0.05 ***p <= 0.01.
reference category: Germany and unemployed
control variables: age, gender, educational level, subjective health.
Source: ESS & CID (authors’ calculations), estimated with robust standard errors.

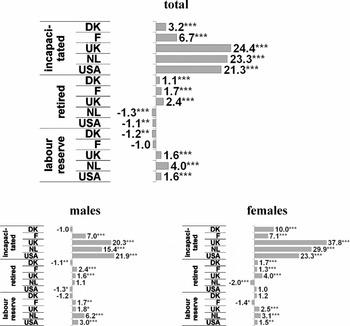
Relative risks of reporting categories of non-employment other than unemployment in international comparison to Germany (ages 50 to 67 years only).
significance: *p <= 0.1 **p <= 0.05 ***p <= 0.01.
reference category: Germany and unemployed.
control variables: age, gender, educational level, subjective health.
Source: ESS & CID (authors’ calculations), estimated with robust standard errors.

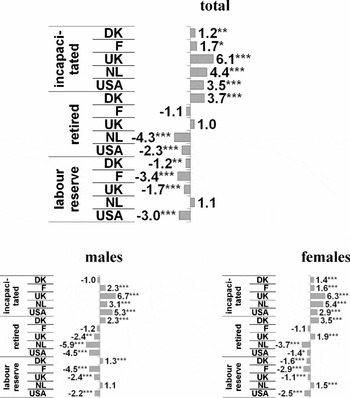
Relative risks of reporting categories of non-employment other than unemployment in international comparison to Germany (lower educational level only).
significance: *p <= 0.1 **p <= 0.05 ***p <= 0.01.
reference category: Germany and unemployed.
control variables: age, gender, subjective health.
Source: ESS & CID (authors’ calculations), estimated with robust standard errors.

In Figures 5 to 7, the reference categories are ‘German’ and ‘unemployed’, which therefore do not appear explicitly in the figures. For example, the first bar in the upper part of Figure 5 means that a non-employed Danish person of the same age, gender, skills level and health condition as those of a German non-employed person has 3.6 times higher chance of describing his or her status as ‘incapacitated’ rather than ‘unemployed’. For the UK, the corresponding value is 20.8. Most RRR values for the five countries are positive in comparison to those of Germany, and the few negative ones are small and sometimes not statistically significant. However, ‘incapacitation’ is the category of non-employment that is far more prominent than any other in this comparison.
Conversely, this means that even without considering national employment levels, the risk of unemployment is higher in Germany than in the other five countries under consideration, and this is related to the comparatively low likelihood of being in an ‘incapacity’ status in Germany. With regard to ‘incapacitation’, gender makes no significant difference, whereas it is highly significant for labour reserve status, as would be expected. It should be remembered here that individuals of subjectively identical health status are being compared. Including additional health indicators of a more factual nature, such as the number of consultations, does not reduce but instead increases the incapacity RRR for all the countries except Denmark (see Table A1 in the Appendix). US respondents for whom this information is not available are excluded here.
While corroborating and explaining some of the cross-country differences in the OECD data (Figure 1), the data also give rise to questions about obvious inconsistencies between aggregate administrative counts on the one hand and self-reporting in the European Social Survey on the other. This is particularly true for the survey category ‘permanently sick or disabled’ (abbreviated in the graphs and tables as ‘incapacitated’) which differs from the OECD data in that it does probably not, in the respondents’ perception, include employers’ sickness pay, and maybe not even social security sickness allowances. The understanding of the concept of ‘permanent’ sickness in particular appears to depend very much on the nation concerned.Footnote 6
Focusing on just the age group 50 to 67, the relative risk ratios for incapacitation, instead of unemployment, become higher for the UK, the Netherlands and the US (Figure 6). For older women in particular, they are higher in all countries under study than for women across the whole range of ages. In the UK, the RRR of older women reporting ‘incapacitation’ rather than ‘unemployment’, in comparison to German older women, is nearly 40.
Restricting the model to respondents with low educational level yields a somewhat different picture (Figure 7): RRR values for ‘incapacitation’, rather than ‘unemployment’, become lower, while those for ‘retirement’ and ‘labour reserve’ become negative. Conversely, low-skilled German respondents, in comparison to those from other nations, are more likely to report ‘retirement’ (with the exception of British women) or ‘labour reserve’ status (with the exception of Dutch respondents of both sexes) rather than ‘unemployment’.
Institutional explanations
The findings of this study are largely compatible with the available institutional comparisons (European Commission, 2002; OECD, 2004; Konle-Seidl and Lang, Reference Konle-Seidel and Lang2006). The relative ease of receiving an income replacement related to ‘incapacity for work’ appears to depend on four fundamental gatekeeping mechanisms:
• requirements of previous social insurance contributions or work record;
• the relevance of psycho-social criteria in addition to physical medical diagnosis;
• the reliance on diagnoses by treating physicians versus examination by institutional medical assessors; and
• the assessment of remaining capabilities, like ‘ability to work’, or assessment of the existing jobs that would match the remaining capabilities, or finally assessment of the chances of getting any of these jobs.
In systems of social protection strongly based on the ‘insurance’ principle, like those of Germany and France, requirements for contributions during the period immediately preceding the onset of incapacity tend to exclude persons who have been out of the labour market or in self-employment, even if they have paid contributions in an earlier stage of their working lives. In Germany, more than in France, because of different family and childcare policies, this mechanism excludes mothers who have interrupted their careers because of caring responsibilities. Insurance-based incapacity provisions also tend to restrict the assessment of impairments to the ‘hard facts’ of physical diagnoses and to rely on gatekeeping by professionals whose primary loyalty is to the insurance institution rather than to the patient. The ability to work is assessed rather mechanically without regard to employability in the sense of ‘marketability’ or to earning capacity. Among the five countries for which sufficient information is available – namely Denmark, the Netherlands, the UK, France and Germany – an institutional comparison along the four criteria brings Germany to the fore as the most exclusive country with regard to granting incapacity-related benefits. This is in conformity with the statistical findings.
In contrast, the countries that afford higher shares of ‘incapacitated’ working-age populations tend to have lower or no contributory requirements, or to rely on home doctors’ diagnoses and be more liberal in accepting mental conditions as justifications for eligibility. Further, in Denmark, failure in getting rehabilitation or re-employment through active labour market policy measures, allows one, even without a medical diagnosis, to enter a benefit that would otherwise require medical justification. The naming of this benefit as ‘early retirement’ (føretidspension), without any explicit health connotation since 1984, may in part explain why subjective status reporting by Danes in the European Social Survey is not consistent with the consolidated administrative data provided by the OECD. Another partial explanation is that the recipients of this benefit are strongly encouraged to work and that their benefit will not be reduced if they are gainfully employed (cf. Bengtsson, Reference Bengtsson2000). Thus, whereas Denmark is leading in the category of ‘incapacity and sickness’ in the administrative count (cf Figure 1), the same is not the case in the survey responses where the category ‘retired’ is much more prominent (cf Figure 2) and where the overall percentage of respondents defined by any of the ‘non-employment’ categories is much lower than the percentage defined by a benefit category in the OECD data.
Conclusions
There is no doubt that the German employment rate is lower than that of other countries under study, including the US. High levels of unemployment in Germany are normally directly attributed to low employment potential and low incentives for employment. High levels of long-term unemployment, as well as high unemployment risks in ‘problem’ groups, such as older or low-skilled workers, stand out as proof of the poor integrative nature of the German labour market. It is a matter of common knowledge that the rigidity of the German labour market can only be overcome by extensive deregulation and welfare retrenchment. Countries like Denmark, the Netherlands, the UK or the US are cited as positive examples to show how low levels of regulation or benefits can keep unemployment down, or how institutional reforms can reduce unemployment.
However, the foregoing analyses demonstrate how questionable is the equation of ‘low employment = high unemployment’, because the categories of non-employment that are different from unemployment are left out of consideration. In Denmark and France, and even more so in the Netherlands, the UK and the US, non-employed individuals of comparable socioeconomic characteristics are more likely to describe themselves as ‘incapacitated’, and those from Germany as ‘unemployed’. Inaccurate and subjective as this self-ascription of status may appear to be, it adds to the knowledge derived from aggregate administrative data, because it allows us to control for individual characteristics. It may then be questioned as to which regime one can attribute the success of some countries in combating unemployment: a restrictive benefit regime in the field of unemployment or a permissive benefit regime in the field of incapacity for work.
The findings of this study emphasise that international comparisons of labour market performance in general or of the impact of labour market and social policy reforms in particular should not be confined to employment and unemployment rates. In a way, what is not taken into account in international comparisons is that unemployment is an institutional construct. It is constructed in different ways in different countries. These differences go far beyond the variations in administrative definitions of unemployment status which are more or less levelled out in comparative databases. However, ostensibly standardised ILO/Eurostat unemployment rates are based on survey data, and survey responses regarding labour market status are strongly influenced by institutional status ascriptions. Consequently, something like a ‘true’ unemployment figure, suitable for cross-country comparisons of labour market performance, simply does not exist. Making allowance for alternative forms of non-employment and considering the cultural and institutional factors governing access to them will add to the knowledge about different modes of functioning in national labour markets. Without such knowledge, it may not be possible to have a realistic assessment of a country's social and economic situation. And unrealistic assessment of the socioeconomic situation may force a nation into hasty and radical reform mode, as was the case with the so-called ‘Hartz’ reforms in Germany (cf. Knuth, Reference Knuth2006, Reference Knuth2007).
Appendix
Relative risk ratios of multinomial regressions (total population)

Notes: Ref. category for dependent variable: unemployed/significance: ***p < 0.01 **p < 0.05 *p < = 0.1. Source: ESS (round 2) & CID, authors’ calculations (estimates with robust standard errors).
Ref. category for controls: Germany, male, higher educational level subj. health: fair, not hampered in daily activities, 0–3 consultations, living alone.
Relative risk ratios of multinomial regressions (population aged 50 and older)

Notes: Ref. category for dependent variable: unemployed/significance: ***p < 0.01 **p < 0.05 *p < = 0.1. Source: ESS (round 2) & CID, authors’ calculations (estimates with robust standard errors).
Ref. category for controls: Germany, male, higher educational level subj. health: fair, not hampered in daily activities, 0–3 consultations, living alone.
Relative risk ratios of multinomial regressions (population with lower educational level)

Notes: Ref. category for dependent variable: unemployed/significance: ***p < 0.01 **p < 0.05 *p < = 0.1. Source: ESS (round 2) & CID, authors’ calculations (estimates with robust standard errors).
Ref. category for controls: Germany, male, higher educational level subj. health: fair, not hampered in daily activities, 0–3 consultations, living alone.
Acknowledgement
The authors would like to thank Lina Zink for her contributions to calculations and graphical representations.