Introduction
Mass extinctions are important mechanisms for resetting evolutionary trends and creating new ecological opportunities (Simpson Reference Simpson1953; Jablonski Reference Jablonski1986, Reference Jablonski2000, Reference Jablonski2005; Raup Reference Raup1987, 1994; Benton Reference Benton1987, Reference Benton1996; Westrop Reference Westrop1989; Sepkoski Reference Sepkoski1996; Foote Reference Foote1997, Reference Foote2000; Erwin Reference Erwin2000; Brusatte et al. Reference Brusatte, Benton, Ruta and Lloyd2008; Congreve et al. Reference Congreve, Falk and Lamsdell2018, and references therein). This is a general pattern that is well studied, and has been described taxonomically (e.g., Jablonski and Raup Reference Jablonski and Raup1995; Foote Reference Foote2000), morphologically (e.g., Foote Reference Foote1994, Reference Foote1997, Reference Foote1999; Ciampaglio et al. Reference Ciampaglio, Kemp and McShea2001; Ciampaglio Reference Ciampaglio2004; Lockwood Reference Lockwood2004; Erwin Reference Erwin2007), ecologically (e.g., Jablonski Reference Jablonski1986; Benton Reference Benton1987, Reference Benton1996; Brusatte et al. Reference Brusatte, Benton, Ruta and Lloyd2008), and phylogenetically (e.g., Carlson Reference Carlson1991; Congreve and Lieberman Reference Congreve and Lieberman2010, Reference Congreve and Lieberman2011; Congreve Reference Congreve2013; Wright and Stigall Reference Wright and Stigall2013; Lamsdell Reference Lamsdell2016; Lamsdell and Selden Reference Lamsdell and Selden2017, Wright and Toom Reference Wright and Toom2017). However, the focus has often been on the loss of diversity during the extinction, with origination of diversity during the recovery receiving much less attention.
Erwin (Reference Erwin2001) argued that because there is often a disconnect between the magnitude of taxonomic loss and the loss of unique evolutionary history (and potentially the subsequent restructuring of ecological communities afterward), the dynamics of origination during recovery intervals might have a more significant effect on long-term evolutionary trends than the dynamics of extinction. Central to this argument is a simulation of extinction patterns at the clade level that demonstrated that a loss of 95% of species diversity within a clade can still preserve up to 80% of the structure of a phylogenetic tree (Nee and May Reference Nee and May1997). This discrepancy in our understanding of extinction intensity has been further supported by multiple analyses of the disconnect between ecological severity and taxonomic loss (McGhee et al. Reference McGhee, Sheehan, Bottjer and Droser2004, Reference McGhee, Sheehan, Bottjer and Droser2012, Reference McGhee, Clapham, Sheehan, Bottjer and Droser2013; Christie et al. Reference Christie, Holland and Bush2013)
One mechanism through which high extinction intensity can result in little evolutionary and ecological change is when extinction and recovery are random. This means that the features driving organisms to extinction are not taxon-specific, that is, any single species is equally likely to become extinct, regardless of morphological or ecological characteristics. Raup (1991) termed this the “field of bullets” scenario. Random extinction tends to preserve more evolutionary history (phylogenetic diversity sensu Faith [Reference Faith1992]) than selective extinction, increasing the probability of at least one member of a clade surviving (Nee and May Reference Nee and May1997). For an extinction event to cause minimal ecological and evolutionary changes on the biosphere, a similar scenario of random origination must also operate during the recovery interval. Under this scenario, features driving postextinction radiation would, likewise, not be selective, and all surviving clades would be equally likely to evolve new species.
Here, we use the Late Ordovician mass extinction as a case study to explore the effect of postextinction origination on long-term evolution of clade morphology. We combine phylogenetic trees (hypotheses of evolutionary relationship) with morphometric analyses (studies of phenetic similarity) to assess the degree to which the extinction event and recovery interval follows the random expectation (Raup 1991). Previous studies have demonstrated that morphological disparity and taxonomic diversity are often not linked (Foote Reference Foote1991, Reference Foote1993, Reference Foote1994); therefore, any assessment of the selectivity of an extinction or radiation that does not look at both diversity and disparity is potentially only looking at half of the pattern. By including the recovery interval in our assessment of this extinction event, we can determine if origination occurred preferentially in certain clades or was randomly distributed throughout the tree. If taxa that evolve after an extinction are phylogenetically, morphologically, or ecologically distinct from those that evolved before, we can interpret the extinction event as having a meaningful impact on the evolution of that group. Conversely, if postextinction taxa are broadly similar to pre-extinction taxa, the extinction event can be interpreted as having little evolutionary impact (sensu McGhee et al. Reference McGhee, Sheehan, Bottjer and Droser2004, Reference McGhee, Sheehan, Bottjer and Droser2012, Reference McGhee, Clapham, Sheehan, Bottjer and Droser2013).
Background
■
Late Ordovician Mass Extinction and Recovery
The Late Ordovician mass extinction is the first of the big five Phanerozoic mass extinction events (Raup and Sepkoski Reference Raup and Sepkoski1982) and the second largest, with about 60% of genera eliminated (Sepkoski Reference Sepkoski1996). Nearly all marine groups experienced taxonomic turnover (e.g., Copeland Reference Copeland1981; Ausich Reference Ausich1987; Eckert Reference Eckert1988; Harper and Rong Reference Harper and Rong1995; Barnes and Zhang Reference Barnes and Zhang1999; Ausich and Deline Reference Ausich and Deline2012).
There are two clusters of last occurrences of species, one at the Katian–Hirnantian boundary and the other at the end of the Hirnantian, suggesting a double-pulsed extinction event. Under this interpretation, the first pulse resulted from the expansion of glaciers across northern Africa and a drop in sea level (Berry and Boucot Reference Berry and Boucot1973; Sheehan Reference Sheehan1973; Finnegan et al. Reference Finnegan, Bergmann, Eiler, Jones, Fike, Eisenman, Hughes, Tripati and Fischer2011, Reference Finnegan, Heim, Peters and Fischer2012; but see also Ghienne et al. [Reference Ghienne, Desrochers, Vandenbroucke, Achab, Asselin, Dabard, Farley, Loi, Paris, Wickson and Veizer2014] for another interpretation of causal mechanisms). The second pulse was caused by anoxic marine water flooding the continent during deglaciation (Sheehan Reference Sheehan2001; Brenchley et al. Reference Brenchley, Carden, Hints, Kaljo, Marshall, Martma, Meidla and Nõlvak2003; Zhou et al. Reference Zhou, Algeo, Shen, Hu, Gong, Xie, Huang and Gao2015). A recent sequence stratigraphic model provides an alternative explanation, suggesting that the two pulses are controlled by stratigraphic architecture, and instead interprets the event as a protracted interval of high extinction (Holland and Patzkowsky Reference Holland and Patzkowsky2015). Despite the difference between these two interpretations, both unequivocally demonstrate that extinction was high during the Late Ordovician.
Many studies have identified substantial differences in selectivity at the two clusters of last occurrences. During the first, at the Katian–Hirnantian boundary (Sheehan Reference Sheehan2001), the drop in sea level drained the epicontinental seas. This loss of habitat drove incumbent epicontinental sea taxa to extinction (Berry and Boucot Reference Berry and Boucot1973; Sheehan Reference Sheehan1973; Finnegan et al. Reference Finnegan, Bergmann, Eiler, Jones, Fike, Eisenman, Hughes, Tripati and Fischer2011, Reference Finnegan, Heim, Peters and Fischer2012). Cosmopolitan continental-margin taxa that were adapted to the cooler waters of the Hirnantian replaced the shallow-, warm-water taxa (Sheehan Reference Sheehan2001). During the second cluster, at the end of the Hirnantian, the rise in sea level due to deglaciation led to widespread anoxia (Sheehan Reference Sheehan2001), which preferentially eliminated the faunas that had proliferated during the Hirnantian (Brenchley et al. Reference Brenchley, Carden, Hints, Kaljo, Marshall, Martma, Meidla and Nõlvak2003; Zhou et al. Reference Zhou, Algeo, Shen, Hu, Gong, Xie, Huang and Gao2015). Furthermore, taxa with narrow latitudinal ranges during the Katian were particularly prone to extinction during the Hirnantian, suggesting a potential biogeographic selectivity across the extinction (Finnegan et al. Reference Finnegan, Rasmussen and Harper2016).
The early Silurian recovery has been described as rapid, with diversity returning to pre-extinction levels by the mid-Silurian across all taxonomic groups (Sheehan Reference Sheehan2001). Patterns of recovery from the Late Ordovician mass extinction varied between paleocontinents, largely because of differences in immigration rates (Krug and Patzkowsky Reference Krug and Patzkowsky2004, Reference Krug and Patzkowsky2007). Recovery rates differed between higher taxonomic levels (Sheehan Reference Sheehan2001), with some orders increasing in diversity and others declining (Harper and Rong Reference Harper and Rong1995). The early Silurian also marked a shift in phylogenetic clumping of extinction and origination patterns from random to slightly dispersed among brachiopod families in the Ordovician to clumped (Krug and Patzkowsky Reference Krug and Patzkowsky2015). This result suggests that the removal and addition of taxa occurred randomly across families in the Late Ordovician and preferentially within certain families in the early Silurian. This is in contrast to the end-Cretaceous mass extinction, in which bivalve extinction was phylogenetically clustered (Roy et al. Reference Roy, Hunt and Jablonski2009) and the recovery was random. These two studies used a taxonomic proxy for phylogeny, highlighting the need for examining phylogenetic trees to corroborate these patterns.
Despite well-documented selectivity and taxonomic turnover, some have used qualitative assessments of taxonomic and ecological functional group membership of dominant taxa to argue that the Late Ordovician mass extinction had little effect on ecological structure (Droser et al. Reference Droser, Bottjer, Sheehan and McGhee2000; McGhee et al. Reference McGhee, Sheehan, Bottjer and Droser2004, Reference McGhee, Sheehan, Bottjer and Droser2012). These authors conclude that change in the dominant components of ecological communities was minor. That is, taxa that were abundant in the Ordovician (brachiopods, rugose and tabulate corals, stromatoporoid sponges, graptolites, conodonts, nautiloids, bryozoan, crinoids) returned to dominance shortly after the start of the Silurian. These results are inconsistent with the selectivity observed by many other studies that focus on single taxonomic groups (e.g., brachiopods [Harper and Rong Reference Harper and Rong1995], crinoids [Ausich and Deline Reference Ausich and Deline2012], trilobites [Chatterton and Speyer Reference Chatterton and Speyer1989]). This suggests that within group, or even within clade, examinations of ecological change need to be conducted, as it is possible that selectivity is most important at this finer scale of study.
The Late Ordovician mass extinction is a clear example of a disconnect between the taxonomic and ecological impact of the extinction (sensu Erwin Reference Erwin2001). In this study, we investigated how a dramatic loss of taxonomic diversity resulted in little to no loss of ecological functional groups. We use a single order of brachiopods as a model to identify how morphological selectivity at lower taxonomic levels affects long-term clade evolution. While morphology has been often assumed to be a proxy for ecology given morphological adaptation (sensu Simpson Reference Simpson1944), morphological similarity can also be attributed to evolutionary relationship and therefore should also be correlated with phylogeny. In this way, it can bridge the gap between taxonomy and ecology and provide a better understanding of selectivity during the recovery (Lamsdell et al. Reference Lamsdell, Congreve, Hopkins, Krug and Patzkowsky2017).
Strophomenida
The Strophomenida is an order of articulate brachiopods that originated in the Early Ordovician and became extinct in the Carboniferous (Cocks and Rong Reference Cocks and Rong2000). Strophomenide brachiopods were a diverse and abundant component of the Paleozoic benthos. Individuals were morphologically complex, and groups differed largely in terms of strategies for holding their valves together (Cocks and Rong Reference Cocks and Rong1989; Rong and Cocks Reference Rong and Cocks1994). The order as a whole was geographically widespread and survived two of the big five mass extinctions (Cocks and Rong Reference Cocks and Rong2000). Their long geologic duration and wide geographic distribution make them ideal for studying the long-term effects of a mass extinction. Because they were ecologically dominant, any change in this group is likely to be a meaningful reflection of change in the biosphere as a whole.
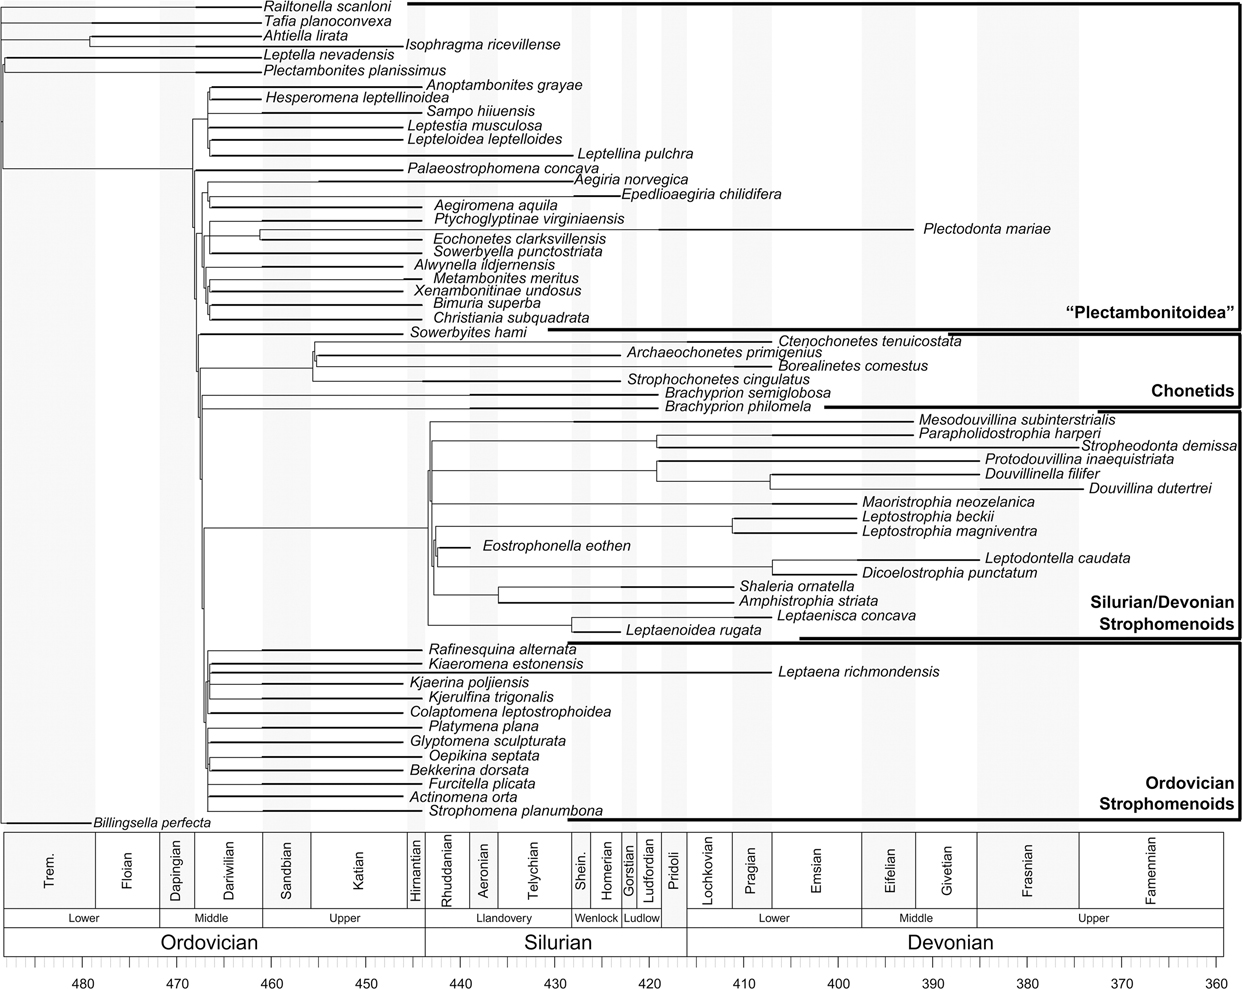
Congreve et al. (Reference Congreve, Krug and Patzkowsky2015) revised the phylogenetic relationships of the Strophomenida (Fig. 1). This phylogeny is based on 69 discrete morphological characteristics of the shells and 61 exemplar species, representing all but 1 family within the order. The family not included in this phylogeny is the Foliomenidae, because its phylogenetic placement could not be determined. The order can be divided into four main groups: a basal plectambonitoid grade, the chonetid clade, and two clades of strophomenoids, one that originates in the Ordovician and one that originates in the Silurian. This study uses this phylogenetic framework to examine the effect of extinction and origination on morphological evolution within the clade.
Time-scaled phylogeny of Strophomenida. The brachiopod order Strophomenida originated in the Tremadocian (earliest Ordovician), underwent an initial radiation in the Darriwilian (Middle Ordovician), and underwent a secondary radiation in the Rhuddanian (earliest Silurian). This pattern of evolution produced four groups within this order: (1) a basal plectambonitoid grade, which originated in the Tremadocian; (2) the chonetids, which have a ghost range that extends back to the Darriwilian; (3) the Ordovician strophomenoids, which originated in the Darriwilian; and (4) the Silurian/Devonian strophomenoids, which originated in the Rhuddanian during the recovery from the Late Ordovician mass extinction. This phylogeny is a time-scaled version of the one defined by Congreve et al. (Reference Congreve, Krug and Patzkowsky2015), which contains exemplar genera within families. The tree contains 61 taxa and 45 ancestral nodes. Geological ranges for each genus are from the revised brachiopod Treatise on Invertebrate Paleontology (Cocks and Rong Reference Cocks and Rong2000).

Models for Morphological Change in the Extinction and Recovery
There has been extensive research into how morphological disparity has changed through time (e.g., Foote Reference Foote1994, Reference Foote1999; Ciampaglio et al. Reference Ciampaglio, Kemp and McShea2001; Ciampaglio Reference Ciampaglio2004; Lockwood Reference Lockwood2004; Erwin Reference Erwin2007). Theoretical expectations for quantifying disparity (Ciampaglio et al. Reference Ciampaglio, Kemp and McShea2001; Korn et al. Reference Korn, Hopkins and Walton2013) highlight two broad patterns, based largely on changes in the location of the centroid and extent of variation in ordination space. Korn et al. (Reference Korn, Hopkins and Walton2013) developed a model for the impact of extinction on morphospace. Depending on the selective nature of an extinction, the centroid of morphospace will either shift directionally or remain the same.
In this study, we examine morphological change across the Late Ordovician mass extinction and the early Silurian recovery interval to assess the relative importance of selectivity during both extinction and origination. We apply both the Korn et al. (Reference Korn, Hopkins and Walton2013) model of extinction and our proposed model of origination (the two hypotheses described below) to examine morphological selectivity during the extinction and recovery. Additionally, we focus on a single order to explore the extent to which individual clades are able to morphologically innovate following a mass extinction.
First, we use the Korn et al. (Reference Korn, Hopkins and Walton2013) model to determine whether extinction was selective. If taxa that go extinct are preferentially removed from regions of morphospace, the centroid would shift directionally, indicating a selective extinction. In contrast, if taxa that go extinct are removed from throughout morphospace, the centroid would not change, indicating random extinction.
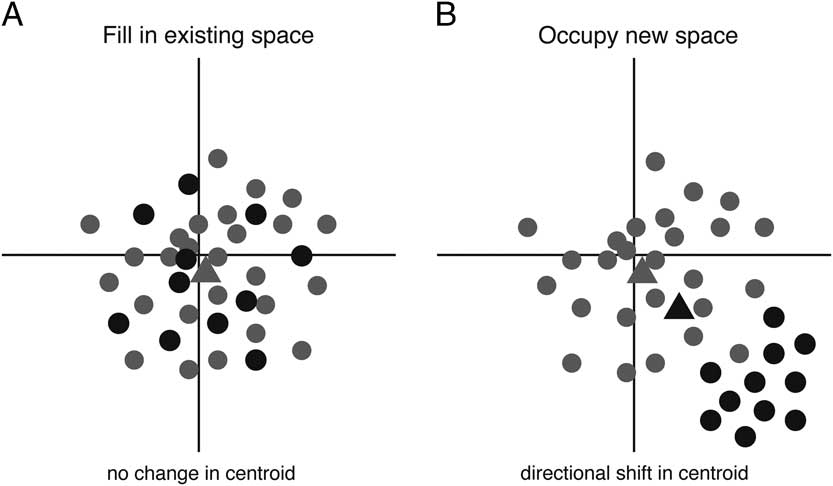
Second, we used the Korn et al. (Reference Korn, Hopkins and Walton2013) model as the basis for generating hypotheses of morphospace change during the recovery (Fig. 2). Taxa that originate during a recovery can fill morphospace in one of two ways: (1) new taxa can fill in existing space left by survivors, preserving the original centroid; or (2) new taxa can fill previously unoccupied space, resulting in a directional shift in the centroid. Under the first hypothesis, overall morphology and, presumably, ecology of the order will remain constant across the extinction boundary. In contrast, the second hypothesis would indicate the evolution of new morphologies and, possibly, new ecologies.
Hypothesized patterns for morphospace occupation during the recovery. When new taxa originate during a recovery, they can occupy morphospace in one of two broad ways. A, New taxa (black) can fill space within the existing boundary of surviving species (gray). This preserves the centroid (gray triangle) of morphospace and results in no directional shift in overall clade morphology. B, New taxa (black) can occupy a previously unexploited region of morphospace. This shifts the centroid of morphospace and results in a directional shift in overall clade morphology (gray triangle=surviving centroid; black triangle=new centroid). (Inspired by Korn et al. Reference Korn, Hopkins and Walton2013).

Methods
■
Ancestral State Reconstruction
The study uses the Strophomenida phylogeny from Congreve et al. (Reference Congreve, Krug and Patzkowsky2015). We created a time-scaled version of this phylogeny (Fig.1) using the “basic” model of age calibration, in which each species in the phylogeny is assumed to be an exemplar for its assigned genus (Congreve et al. Reference Congreve, Krug and Patzkowsky2015). Studies focusing on numerical models (Bapst Reference Bapst2014) and fossil data (Bapst and Hopkins Reference Bapst and Hopkins2017) have suggested that the “basic” model tends to outperform minimum branch-scaling methods for origination times (e.g., Brusatte et al. Reference Brusatte, Benton, Ruta and Lloyd2008). It is worth noting that fossilized birth–death models such as cal3 tend to outperform the basic model (Bapst Reference Bapst2014), but this sort of detailed modeling of stratigraphy was outside the scope of this study.
To time-scale the phylogeny, first and last occurrences of each taxon were determined from the geologic range of the taxon’s genus in the Treatise of Invertebrate Paleontology (Cocks and Rong Reference Cocks and Rong2000). Ghost ranges were determined by extending the first occurrence of a taxon back to the youngest possible time of origination based on its evolutionary relationships (Norell and Novacek Reference Norell and Novacek1992; Norell Reference Norell1993; Cavin and Forey Reference Cavin and Forey2007).
In addition to the 61 taxa in the tree, we reconstructed the character states for 45 ancestral nodes (Brusatte et al. Reference Brusatte, Montanari, Yi and Norell2011). The character states for these ancestral nodes were determined by calculating the most parsimonious character reconstruction in Mesquite (Maddison and Maddison Reference Maddison and Maddison2015). This method determines the most parsimonious character state for each ancestral node, and in instances where it is equally parsimonious for a character to evolve earlier (ACCTRAN) or later (DELTRAN) on the tree, the method treats these nodes as being ambiguous (i.e., the node could be considered to have either morphological state) (Maddison and Maddison Reference Maddison and Maddison2015). Because the generalized Euclidean distance method of principal coordinates analysis (PCO) cannot handle multiple or ambiguous states, all ambiguous ancestral character state reconstructions were treated as absent (NA) for the morphometric analysis. Stratigraphic ranges for these ancestral nodes were inferred from the ancestral branch lengths generated from the “basic” time calibration (Bapst Reference Bapst2014). We used these 106 taxa (61 taxa and 45 ancestors) to assess morphological change in the strophomenides from the time of the order’s origination in the Ordovician through the Devonian.
Character data from the original phylogeny (Congreve et al. Reference Congreve, Krug and Patzkowsky2015) are available on Morphobank (O’Leary and Kaufman Reference O’Leary and Kaufman2012). Ancestral node reconstructions are given in the Supplementary Material. We also ran all analyses without including hypothetical ancestors and generated a morphospace that was broadly similar to the analysis that included ancestors. The results of these analyses without ancestors were similar to the analyses presented in the “Results” section of this study, but they lack the statistical power to make strong conclusions about the radiation because of the low number of early Silurian taxa sampled (see “Results” for further discussion). These files are also included in the Supplementary Material.
Morphospace
Character state data from the phylogeny were ordinated using PCO (Gower Reference Gower1966) following the method of Hughes et al. (Reference Hughes, Gerber and Wills2013), which uses generalized Euclidean distance (a modification of a Euclidean distance; see Wills Reference Wills2001; Lloyd Reference Lloyd2016) as a dissimilarity metric and corrects for negative eigenvalues using a Calliez correction (Lamsdell and Selden Reference Lamsdell and Selden2017; Cailliez Reference Cailliez1983). The Hughes et al. (Reference Hughes, Gerber and Wills2013) method is a series of functions in R (R Core Team 2014) that uses PCO to ordinate a dissimilarity matrix of character state data. Axes are drawn such that the distances between points are equal to their original dissimilarity (Gower Reference Gower1966, Reference Gower2005; McCune and Grace Reference McCune and Grace2002; Anderson and Willis Reference Anderson and Willis2003). A major difference between PCO and other ordination methods is that the relationship between the axes and original variables is unknown but can be approximated. We identified differences in morphologies between species that separate along the major axes to explore explanations for variation.
After ordinating the data, the Hughes et al. (Reference Hughes, Gerber and Wills2013) method uses a matrix of stratigraphic ranges to calculate how morphospace occupation changes throughout the total stratigraphic duration of the data set. Morphospace plots were made by plotting PCO axis 1 and 2 scores (all PCO scores are given in the Supplementary Material). To further explore these patterns, we then coded morphospace by phylogenetic group membership. To determine morphological change of Strophomenida through time, separate morphospace plots were made for each of 20 stage-level time intervals from the early Ordovician through the Devonian (see Supplementary Material).
The method of Hughes et al. (Reference Hughes, Gerber and Wills2013) also calculates a sum of ranges (SOR) and sum of variance (SOV) between all PCO axes. Both of these statistics measure morphological variation (disparity). SOR describes the total range of morphospace occupation, while the SOV measures the variation within morphospace, or how far apart points are spaced. Calculating these metrics for each stage-level plot allows us to quantify how the amount of morphological variation in Strophomenida changed through time.
Previous studies show that PCO applied to cladistic data produces similar patterns as landmark data (Hethering et al. Reference Hethering, Sherratt, Ruta, Wilkinson, Deline and Donoghue2015), showing largely similar patterns in morphospace occupation and sum of ranges and sum of variances. Furthermore, studies that compare these PCO studies of discrete characters of entire organisms to detailed landmark analyses of single parts of organisms also obtain similar results (Hopkins Reference Hopkins2017). These methods have been applied effectively to phylogenetic data similar to the data used in this study (Lamsdell Reference Lamsdell2016; Lamsdell and Selden Reference Lamsdell and Selden2017).
Potential Sampling and Biogeographic Biases
For this analysis we used the established strophomenide phylogeny from Congreve et al. (Reference Congreve, Krug and Patzkowsky2015) to investigate the broad-scale morphological shifts within the context of an established phylogenetic framework. This previous analysis focused on sampling a few exemplar species from families across the order. This resulted in a coarse sampling of the total generic diversity of the entire order, though one that attempted to sample common and widespread taxa from each family. However, some time periods and biogeographic areas were potentially undersampled in this analysis. Specifically, the earliest known strophomenoid taxa assigned to major families likely evolved in the Floian in equatorial Gondwanan regions around modern China, Australia, and Iran (e.g., Ghobadi Pour et al. Reference Ghobadi Pour, Kebriaee-Zadeh and Popov2011; Zhan et al. Reference Zhan, Huang, Liang and Jin2013; Popov and Cocks Reference Popov and Cocks2017). More importantly, these taxa appear to have unique suites of morphological characteristics that are not observed in later strophomenoids. The broad taxonomic sampling of this analysis may therefore not be a complete representation of the morphological variability of strophomenides throughout the Early to Middle Ordovician. Reconstruction of ancestral characteristics can alleviate this sampling issue to a point, but these methods still rely upon the already sampled taxa and therefore cannot incorporate morphological characteristics not present in the sampled species.
However, these Early to Middle Ordovician genera with complex suites of morphological characters ultimately do not persist to the mass extinction event and, therefore, should not affect the patterns of morphological difference observed during and after the Late Ordovician mass extinction. To ensure that our ancestral state reconstructions did not negatively influence our observed patterns, we reran the analyses excluding ancestors (see Supplementary Material). This suggested patterns of selectivity related to the extinction and radiation similar to the patterns observed in our complete data set. As such, we are confident that our results for the Late Ordovician mass extinction are not biased by the exclusion of these earlier taxa. However, we refrain from commenting in detail on the changes in morphometric patterns that occurred in the early phases of the Ordovician radiation, because our data may not fully represent this time interval.
Bootstrap Analysis of Extinction and Recovery
PCO values were bootstrapped (Efron Reference Efron1979; Kowalewski and Novack-Gottshall Reference Kowalewski and Novack-Gottshall2010) to determine whether Late Ordovician mass extinction and early Silurian origination were distributed randomly through strophomenide morphospace. Bootstrapping is a method of resampling with replacement and can be used to assess whether the observed pattern is consistent with what would be expected if the pattern were due to random chance.
To model random extinction in morphospace, we examined PCO scores for taxa that were extant in both the Katian and Hirnantian (44 taxa total). These data were combined for the two stages to capture the full temporal extent of the Late Ordovician mass extinction. The number of PCO axis 1 and axis 2 scores equal to the number of taxa that actually went extinct (32 taxa) were drawn randomly with replacement from the combined Katian/Hirnantian morphospace. This created a data set of PCO scores for extinct taxa under a simulated random extinction. The centroid of this random sample was calculated. This process was repeated 1000 times to generate a data set of simulated centroids, for which a grand centroid and 95% confidence interval were calculated. This repeated random sampling generated an expected range of morphospace variation for random extinction.
To model random origination in morphospace, the same process was applied to the PCO values of taxa in the Rhuddanian (26 taxa total), the first stage of the recovery. Because the process of bootstrapping involves evaluating how the observed distribution compares with simulated randomness, as opposed to actually modeling the process of origination, it was applied to all of the Rhuddanian data, not just those that survived the extinction. Species PCO scores were drawn randomly with replacement from the entire distribution of taxa within Rhuddanian morphospace. The size of each random draw equaled the total number of taxa that originated during the Rhuddanian (14 total). This created a data set of PCO scores for new taxa under simulated random origination. The centroid of these scores was calculated, and this process was also repeated 1000 times. This generated a data set of simulated centroids for which a grand centroid and 95% confidence interval were calculated. This repeated random sampling generated an expected range of morphospace variation for new taxa under random origination.
Expected morphospace ranges for both random extinction and origination were compared with the actual PCO scores to assess whether extinction and origination during the Late Ordovician and early Silurian were consistent with a random expectation.
Results
■
Morphospace Occupation through Time
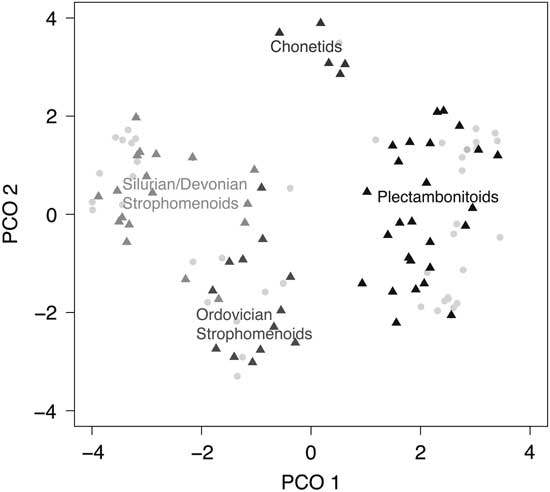
The four phylogenetic groups (Fig. 1) clearly separate in morphospace (Fig. 3). The basal plectambonitoid grade occupies the right half of morphospace, and the strophomenoids occupy the left. The chonetids fall in between these two groups along PCO axis 1, but have the highest values on PCO axis 2. Within the left half of morphospace, the Ordovician and Silurian/Devonian strophomenoids form distinct groups. The Silurian/Devonian strophomenoids have slightly lower PCO 1 scores and slightly higher PCO 2 scores than their Ordovician counterparts.
Strophomenida morphospace coded by phylogenetic group membership. The four groups defined by the origination pattern in the time-scaled phylogeny separate in morphospace, indicating that these groups are morphologically distinct. Points are each of the 106 taxa. The 61 actual species are triangles, colored by group membership. The 45 ancestral nodes are the light gray circles. PCO 1 explains about 11% of the variance in the data and PCO 2 explains about 6% of the variance.

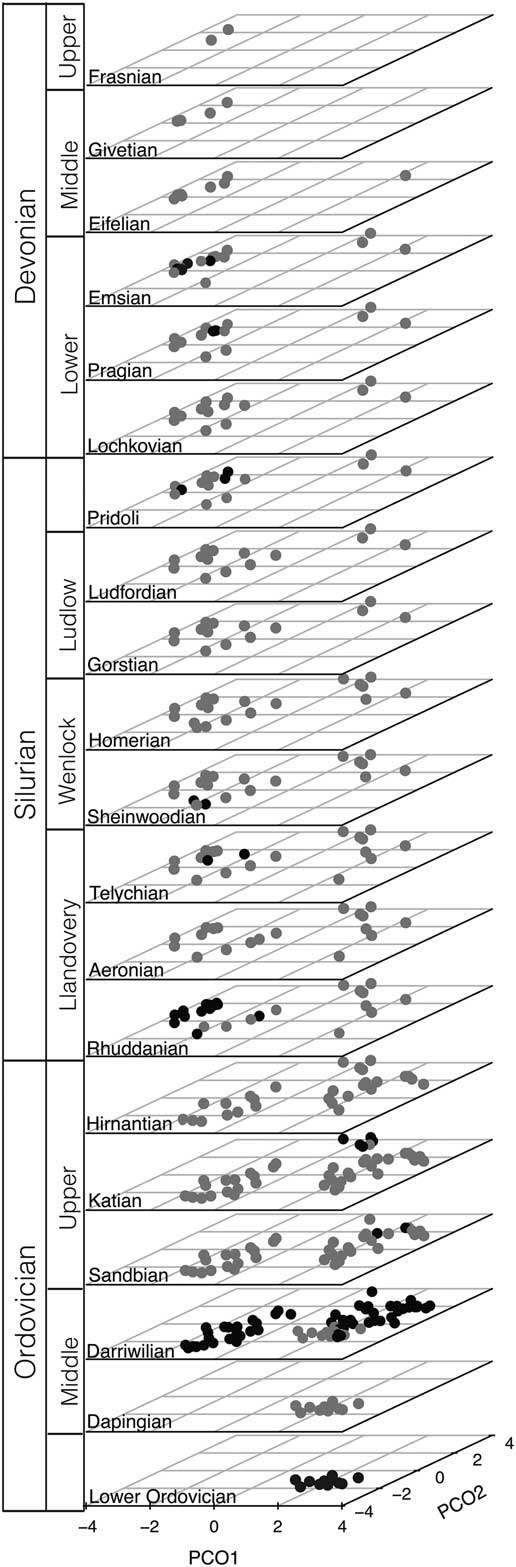
When total morphospace is divided into time slices, it is clear that morphospace occupation changes throughout clade duration (Fig. 4; see Supplementary Material for more detail). The order originates in the lower right quadrant of morphospace, then expands to occupy the whole right half and bottom left half of morphospace during the Ordovician radiation (Darriwilian). Occupied morphospace remains consistent until the Late Ordovician mass extinction (Katian–Hirnantian). A significant number of taxa (32 total) go extinct at the end of the Ordovician. After the extinction (Rhuddanian), new taxa originate in a previously unoccupied region of morphospace (the upper left side). Throughout the Silurian and into the Devonian, taxa slowly go extinct within the old region of morphospace, new taxa primarily originate in the new region of morphospace, and the old morphospace is never reoccupied to the extent it was in the Ordovician.
Morphospace through time. The earliest members of Strophomenida occupy a small region of morphospace. Morphospace occupation expands during the radiation in the Darriwilian and remains constant until the Late Ordovician. The group is affected by the Late Ordovician mass extinction, during which no new taxa originate. After the mass extinction, new taxa that originate during the Silurian recovery occupy a smaller, previously unexploited region of morphospace. Throughout the Silurian and into the Devonian, taxa from the Ordovician region of morphospace slowly go extinct, while new taxa originate in the new constrained region of morphospace. Plots are for each stage from the Floian (Early Ordovician) to the Frasnian (Late Devonian). In each plot, points in black are taxa that originated during that stage, while points in gray are taxa that survived from the previous stage. Plots are spaced evenly, not scaled according to the length of time in each stage.

Comparing morphospace through time (Fig. 4) to the morphospace coded by phylogenetic group (Fig. 3) shows how each group changes through time. The basal plectambonitoid grade originated in the lower right quadrant of morphospace and expands to fill the right half of morphospace during the Ordovician radiation. Many members of this group went extinct at the Late Ordovician mass extinction, but a few survived into the Devonian. The ancestor to the chonetids originated during the Ordovician radiation and plots in the top middle of morphospace. This group expanded late in the Ordovician, survived the extinction and persisted until the Devonian. The Ordovician strophomenoids originated during the Ordovician radiation and quickly expanded to occupy the lower left quadrant of morphospace. This group was hit hard by the extinction, but a few taxa evolved in the Silurian and persisted through the Devonian. The ancestor to the Silurian/Devonian strophomenoids evolved during the Ordovician radiation, but the group as a whole did not diversify until the early Silurian. This group continued to expand its occupation of morphospace throughout the Silurian and into the Devonian. These groupings are also recovered in our analyses that exclude the inferred ancestral nodes (Supplementary Material).
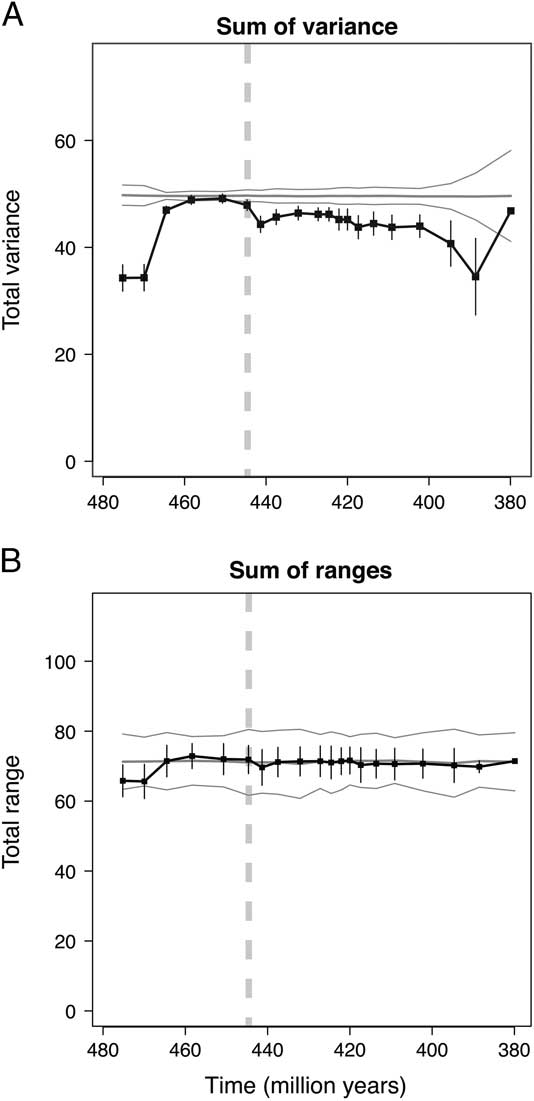
The stability of morphospace throughout the Ordovician is also demonstrated by a constant sum of variance and sum of ranges (Fig. 5). This means that the total amount of morphospace occupied and the average variation between individual points in the morphospace are approximately the same over time. At the Late Ordovician mass extinction, the sum of variance drops, but the sum of ranges remains the same. This means that the extinction decreases variation in morphospace but does not change the total amount of morphospace occupied. During the recovery, sum of variance rebounds slightly but does not return to its pre-extinction level (Fig. 5A). It remains at this lower level into the Devonian. In contrast, the sum of ranges remains relatively constant throughout the history of the strophomenides (Fig. 5B). The disconnect between these two metrics means that extinction strongly affected the distribution of points in morphospace, but it did not change the overall shape of morphospace. These metrics in combination demonstrate that the Late Ordovician mass extinction and recovery had a significant and permanent effect on morphological disparity within strophomenides.
Sum of variance and sum of range. The sum of variance (A) increases with the radiation in the Darriwilian and remains constant throughout the Ordovician. It drops at the extinction and rebounds slightly in the Silurian, but never returns to pre-extinction levels. This reflects the constraint in morphospace during the recovery. The sum of ranges (B) is constant throughout this time interval. This reflects a consistent total amount of morphospace. In each plot, the black line is the total variance or range for each stage with 95% confidence intervals. The region bounded by the gray lines is a confidence interval around randomness. The dotted line marks the Late Ordovician mass extinction boundary.

Are Extinction and Origination Random?
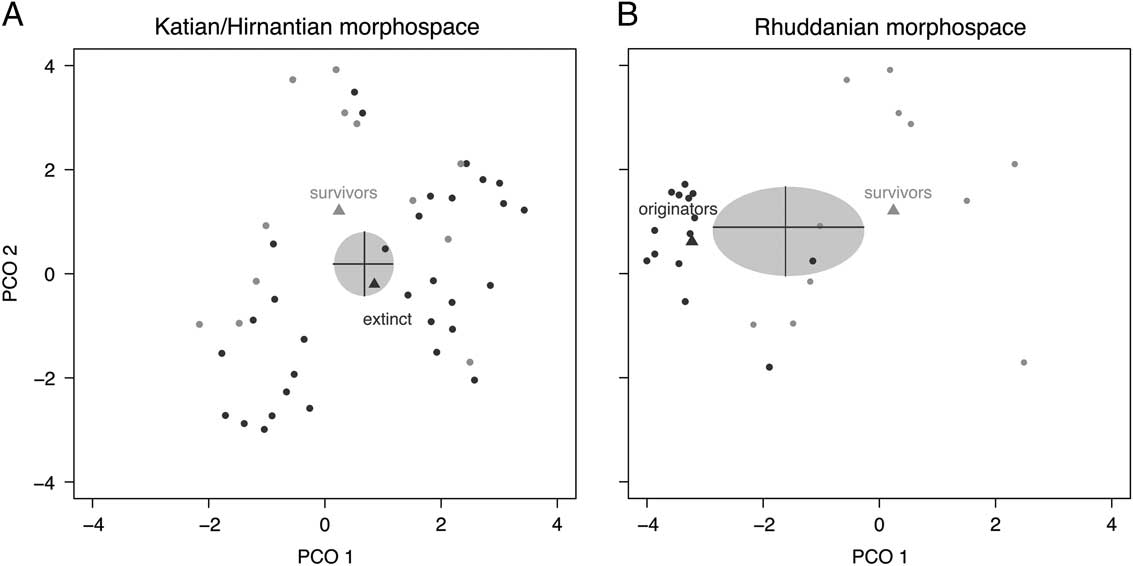
Results from the bootstrap of PCO scores show that extinction during the Late Ordovician does not differ from a random expectation (Fig. 6A). This is because the centroid falls within the range of expected PCO scores if genera were randomly removed from morphospace. However, origination during the earliest Silurian does differ from a random expectation along PCO axis 1 (Fig. 6B; see Supplementary Material for bootstrap values for other axes). The centroid falls outside of the range of expected PCO scores if genera are randomly added to morphospace. This implies that the extinction event did not target specific morphologies and therefore may have been random with respect to morphological adaptations (in addition to being largely random with respect to taxonomic groups [Congreve et al. Reference Congreve, Krug and Patzkowsky2015; Krug and Patzkowsky Reference Krug and Patzkowsky2015]). However, the recovery after the extinction was associated with a significant shift in morphospace. Extinct, surviving, and newly originating taxa in the early Silurian occupied different regions of morphospace (Fig. 6). The largest difference in morphospace occurred along PCO axis 1. Extinct taxa had the highest PCO 1 scores, surviving taxa fell in the middle, and new taxa had the lowest. Additionally, the centroid for taxa that originated in the Silurian was distinct from those of both taxa that survived and taxa that went extinct at the Late Ordovician mass extinction.
Bootstrapped centroids of extinct and originating taxa. The centroid (dark gray triangle in A) of taxa that go extinct at the end of the Ordovician is distinct from that of both those that survive (light gray triangle) and those that originate in the Silurian (dark gray triangle in B). Bootstrapped values for extinct (gray ellipse in A) and new (gray ellipse in B) taxa identify a zone of random expectation. The centroid of taxa that go extinct at the end of the Ordovician falls within the random expectation (A), and the centroid of taxa that originate in the Silurian falls outside the random expectation (B).

The patterns observed when our analyses include ancestral nodes (presented here) are largely consistent with our analyses that exclude ancestral nodes (in the Supplementary Material). Our data set that excludes ancestral nodes also reconstructs the extinction as random with respect to morphology, but was unable to reject the null hypothesis that origination was random in the Silurian, because only three taxa were sampled from the Rhuddanian. This limited sampling reflects both low diversity and low rock availability during this interval (Peters and Foote Reference Peters and Foote2001). It also limits the statistical power of our bootstrap analyses, such that almost any distribution of new taxa in morphospace would be considered random. However, it is clear that morphospace occupation did shift through time in the same way as in the analysis that included ancestors. Furthermore, based on the phylogenetic analysis, origination of these morphologies must have occurred earlier than their stratigraphic first occurrence, because the clade that radiated in the Silurian must have originated in the Ordovician. Our results provide further support for the importance of ancestral node reconstructions and time-calibrated phylogenies to understanding evolutionary transitions (Norell Reference Norell1993; Lane et al. Reference Lane, Janis and Sepkoski2005; Brusatte et al. Reference Brusatte, Benton, Ruta and Lloyd2008), especially during periods of Earth’s history when sample availability and diversity is generally low.
Overall, the patterns of extinction and origination are consistent with the time-scaled phylogeny (Fig. 1). Taxa that go extinct in the Late Ordovician are randomly removed from the basal plectambonitoid grade and the Ordovician strophomenoids, the two groups that occurred during that time. Much of the origination in the early Silurian clustered within a new monophyletic group of strophomenoids. This rapid and clustered diversification is reflected in the location of these clades in morphospace (Fig. 3) and the pattern of morphospace evolution (Fig. 4).
The sum of variance and sum of ranges further support random extinction and nonrandom origination. The extinction did not change total morphospace occupied, but resulted in a persistent drop in morphological variation. Essentially, the total extent of morphospace is unchanged across this event, but the recovery favors a few areas within morphospace, as seen in the shifts in morphospace centroid and decrease in sum of variance. This is consistent with extinction removing morphologies randomly and origination selecting for certain morphologies.
Discussion
■
Impact of the Late Ordovician Mass Extinction
Our results demonstrate that the Late Ordovician mass extinction randomly affected strophomenides based on morphology and clade membership (Fig. 6). The centroid of extinct taxa was not distinguishable from a random expectation. However, the centroid of taxa that survived the extinction fell outside the random expectation, slightly shifting average morphology along PCO axis 1. Although the sum of variance in the Silurian was less than it was during the Late Ordovician, the broad outline of morphospace was relatively unchanged.
For the Strophomenida, the probability of surviving the Late Ordovician mass extinction appears to have depended very little on morphology. In this respect, the Late Ordovician mass extinction differed substantially from other big five mass extinction events for which there was documented morphological (e.g., Ciampaglio Reference Ciampaglio2004; Lockwood Reference Lockwood2004) and phylogenetic (Roy et al. Reference Roy, Hunt and Jablonski2009) selectivity.
The Late Ordovician mass extinction did not appear to preferentially select for certain clades over others. Both the plectambonitoids and Ordovician strophomenoids survived the event with similarly low diversity (there were proportionally more chonetid survivors, but sample size for this group within this study was much lower). This means that, although the extinction reduced morphological variability within the strophomenides, it preserved a large amount of existing phylogenetic diversity, increasing the potential for postextinction diversification to occur within existing clades. The nonselective nature of the extinction is consistent with the suggestions of phylogenetic randomness (Krug and Patzkowsky Reference Krug and Patzkowsky2015) and selectivity independent of taxonomy (Finnegan et al. Reference Finnegan, Rasmussen and Harper2016). This suggests that taxa were randomly removed from all evolutionary lineages during the Late Ordovician mass extinction, as opposed to preferentially removed from some evolutionary lineages. This randomness preserved a large amount of phylogenetic diversity, as most clades survived into the Silurian.
Finnegan et al. (Reference Finnegan, Rasmussen and Harper2016) also suggest that extinction selectivity was not taxon specific, because it was primarily based on bathymetric and biogeographic differences. That is, taxa that went extinct at the Late Ordovician mass extinction were those that lived in shallow water and higher latitudes. These authors argue that environmental gradients cross taxonomic groups, and thus, the impact of extinction was independent of group membership. This also supports the low familial clumping of extinction (Krug and Patzkowsky Reference Krug and Patzkowsky2015) where taxa were removed from evolutionary lineages indiscriminately. However, its support of our findings of morphologically random extinction depends on how tightly morphology and environmental parameters are linked. Extinction that is selective based on environmental difference but random with respect to morphology implies that these environmental gradients might not be the primary driver of morphological diversity within this group. This could be an explanation for the disconnect between taxonomic loss and ecological restructuring. More importantly, it highlights the complexity of the relationship between morphology and ecology and the need for further research.
The Importance of the Silurian Recovery
Origination during the recovery from the Late Ordovician mass extinction had a directional impact on strophomenide morphospace. The centroid of originators was well outside both the original boundary of morphospace and the expectation of randomness. The sum of variance, although relatively constant throughout the recovery, was at lower levels than before the extinction. This reflects an overall decrease in the amount of variation within morphospace (a bottleneck). The reduction in morphological variability during the recovery is consistent with the change to phylogenetically clumped origination across the extinction boundary (Krug and Patzkowsky Reference Krug and Patzkowsky2015), where new origination is concentrated within some families. This type of morphological bottleneck after an extinction event has been observed in multiple groups across multiple extinction events, including ichthyosaurs (Thorne et al. Reference Thorne, M. Ruta and Benton2011), horseshoe crabs (Lamsdell Reference Lamsdell2016), trilobites (Crônier Reference Crônier2013), and eurypterids (Lamsdell and Selden Reference Lamsdell and Selden2017), though our study is potentially unique, given that the bottleneck appears to be caused by selective radiation as opposed to selective extinction.
The results of this study are consistent with our second hypothesis (Fig. 2) that diversification occurred in a new region of morphospace during the recovery, resulting in a directional shift in morphospace occupation. Recovery taxa (the Silurian/Devonian clade; Fig. 3) exploited a new, previously unoccupied region of morphospace, which meant that they were morphologically distinct from those that went extinct during the Late Ordovician. Our results also add support to previous studies from early Silurian brachiopod faunas, which suggested that ecological recovery after the extinction was rapid and dominated by the appearance of new, morphologically distinct taxonomic groups (Rong et al. Reference Rong, Boucot, Harper, Zhan and Neuman2006; Cocks and Rong Reference Cocks and Rong2008; Rong and Cocks Reference Rong and Cocks2014).
A major morphological difference between the Silurian–Devonian strophomenoids and the other strophomenide taxa was an increase in dentition at the hinge line and a change in muscle-attachment structures (Congreve et al. Reference Congreve, Krug and Patzkowsky2015). It is unclear whether this trade-off conferred any evolutionary advantage or was nonadaptive (sensu Gould and Lewontin Reference Gould and Lewontin1979). Initial exploration of the environmental affinities (sensu Simpson and Harnik Reference Simpson and Harnik2009; Hopkins Reference Hopkins2014) does not support water depth, substrate, or latitudinal affinities as an explanation for this pattern (M. Patzkowsky et al. unpublished data). As such, our interpretation of the impact of origination on ecology is complicated. While we acknowledge that morphological changes could be the result of nonadaptive processes, the shift in morphospace during the Silurian recovery may suggest that the current interpretation that the Late Ordovician mass extinction event had little ecological effect (e.g., McGhee et al. Reference McGhee, Clapham, Sheehan, Bottjer and Droser2013) should be revisited. Further research is necessary to determine whether the morphological bottleneck that occurred during the Silurian is due to functional constraints associated with shifts into new ecologies or to evolutionary changes associated with shared phylogenetic descent (Congreve et al. Reference Congreve, Falk and Lamsdell2018).
The Effect on Long-Term Clade Trajectory
Tracking morphospace change through clade history shows that, after the extinction, most diversification occurred in the region of morphospace that was not occupied throughout the Ordovician, at least at the level of the family. There are a few surviving taxa that persist in the Ordovician region of morphospace, but they slowly go extinct throughout the Silurian and Devonian without being replaced. This suggests that morphological constraint during the recovery had a profound impact on overall strophomenide morphology. The selective nature of the recovery makes the amount of evolutionary history preserved by the random nature of the extinction unimportant to the long-term trajectory of the clade. While nearly all strophomenide groups survive the extinction, only a few families diversify in the recovery. Most of the strophomenide families that were dominant in the Ordovician experience a slow decline until the Devonian and are essentially “dead clades walking” (sensu Jablonski Reference Jablonski2002). The origination of a new clade and the slow decline of the pre-extinction clades are consistent with the taxonomic patterns of turnover that have been identified during the recovery (Harper and Rong Reference Harper and Rong1995; Rong et al. Reference Rong, Boucot, Harper, Zhan and Neuman2006; Cocks and Rong Reference Cocks and Rong2008; Rong and Cocks Reference Rong and Cocks2014).
This study adds to our existing understanding of the Late Ordovician mass extinction event by highlighting the significance of the recovery for long-term evolution. Focusing only on selectivity during the extinction itself would suggest that the extinction was not important to strophomenide evolution. However, we have demonstrated that this provides an incomplete picture of how the strophomenides responded. It is only by examining selectivity during the recovery that we are able to identify a shift in morphology and recognize that it persisted for the duration of this group. Similar patterns of selective origination after the Late Ordovician mass extinction has been demonstrated in crinoid phylogenies (Wright and Toom Reference Wright and Toom2017), suggesting that this pattern wherein origination is concentrated within a single subclade may be a widespread phenomenon during the Silurian recovery.
Conclusion
For the Strophomenida, the Late Ordovician mass extinction randomly removed taxa from morphospace. However, diversification during the recovery caused a change in morphospace that was decidedly non-random, and persisted for the remainder of the clade’s duration. This indicates that diversification during the recovery had a greater impact on strophomenide evolution than the mass extinction. Furthermore, it implies that a better understanding of recovery dynamics at this time might lead to a reevaluation of the importance of the Late Ordovician mass extinction in shaping the evolutionary history of the Paleozoic benthos.
The results of this study further emphasize that recovery intervals are at least as important in determining long-term evolutionary trajectories as extinctions themselves (Erwin Reference Erwin1998, Reference Erwin2001, Reference Erwin2008). We have demonstrated that understanding how mass extinctions create new evolutionary opportunities (Jablonski Reference Jablonski1986) can only be tested by looking at the interval of time when these new opportunities allow for origination. Treating an extinction interval as separate from its subsequent recovery provides a fundamentally incomplete understanding of its evolutionary consequences. This becomes especially problematic when attempting to make generalizations about how life responds to catastrophic events. If we want to accurately understand how mass extinction affects the history of life, especially in regard to developing predictions for the future, we must expand our examination of recovery intervals.
Acknowledgments
We thank J. Lamsdell for general support, productive discussions, and revolutionary R code that greatly improved the quality of many aspects of this work. We thank M. Christie, E. Doyle, H. Jones, and A. Karp for helpful comments and insight on early versions of this article and three anonymous reviewers whose comments greatly improved the contents of this article. This research was funded by NASA Astrobiology grant 11-EXO11-0070. Morphological datasets used in this analysis can found in P1037 on Morphobank, with a project doi of http://dx.doi.org/10.7934/P1037.
Supplementary Material
Data available from the Dryad Digital Repository: https://doi.org/10.5061/dryad.4bp82rc