Introduction
Significant research efforts have been dedicated to transparent conductive oxide (TCO) thin films of metal oxide material with increased attention in the area of emerging electronic devices such as photovoltaic devices, transparent electronic displays, photodiodes, and chemoresistive gas sensors [Reference El Hallani, Nasih, Fazouan, Liba, Khuili, Sajieddine, Mabrouki, Laanab and Atmani1, Reference Lee, Han, Jung, Shin, Lee, Noh, Lee, Cho, Lee and Kim2, Reference Gupta, Jain and Mehra3, Reference Ghosh, Ghosh and Giri4]. Since past few years, in the field of different metal oxide and conducting thin films, zinc oxide (ZnO) has been considered as a promising candidate for technological applications such as photovoltaic cells [Reference Gupta and Compaan5] and spintronics [Reference Gupta and Mansingh6]. It is a recognized n-type inorganic semiconductor material from II–VI group [Reference Khan, Arif and Singh7] with broad energy gap and exciton energy, i.e., 3.37 eV and 60 MeV, respectively. Zinc oxide exists in several forms such as nanowires, nanoflowers, and nanosheets [Reference Cui8, Reference Fan, Li and Heng9, Reference Vempati, Mitra and Dawson10]. Pure ZnO thin films offers wide range of applications owing to their stability and low resistivity. However, in the literature, it is reported that a nonstoichiometric composition of the ZnO structure with zinc interstitials delivers a virtuous environment for many dopants and enhances the nonlinear optical properties [Reference Zawadzka, Płóciennik, El Kouari, Bougharraf and Sahraoui11]. Additionally, the properties of ZnO thin films can be dramatically enhanced by doping with suitable ions of metal such as tin, manganese, gallium, indium, aluminum, and cobalt [Reference Shkir, Arif, Ganesh, Manthrammel, Singh, Maidur, Patil, Yahia, Algarni and AlFaify12, Reference Ganesh, Yahia, AlFaify and Shkir13, Reference Benramache, Arif, Belahssen and Guettaf14, Reference Ko, Chen, Hong, Wenisch, Yao and Look15, Reference Sharma, Gupta, Rao, Owens, Sharma, Ahuja, Guillen, Johansson and Gehring16, Reference Shkir, Arif, Ganesh, Manthrammel, Singh, Yahia, Maidur, Patil and AlFaify17]. It has been observed that AZO films not only have high optical transparency and virtuous electrical conductivity in the visible region (380–800 nm), but also offers good thermal, chemical, and mechanical stability. Numerous reports are available from the literature review for the fabrication of pure and doped ZnO films, which involves methods such as pulse laser deposition [Reference Mass, Bhattacharya and Katiyar18], dc sputtering [Reference Grinblat, Borrero-González, Nunes, Tirado and Comedi19], chemical vapor deposition [Reference Sharma and Khare20], hydrothermal [Reference Shrisha, Bhat, Kushavah and Naik21], spray pyrolysis [Reference Ebrahimizadeh Abrishami and Soleimani Varaki22, Reference Paraguay D, Estrada L, Acosta N, Andrade and Miki-Yoshida23], and sol–gel method [Reference Maache, Devers and Chala24]. Among all, sol–gel spin-coated method has been used to fabricate AZO thin films because of its simplicity and low cost. The pure and aluminum (Al)-doped ZnO films were earlier examined intensively for core characteristics; however, some rare investigations associated with linear and nonlinear optical parameters are present [Reference Edison, Nirmala, Kumar, Valanarasu, Ganesh, Shkir and AlFaify25]. Sofiani et al. report the third-order nonlinear (TONLO) studies on cerium-, fluorine-, erbium-, aluminum-, and tin-doped ZnO films [Reference Sofiani, Sahraoui, Addou, Adhiri, Lamrani, Dghoughi, Fellahi, Derkowska and Bala26]. Nagaraja et al. studied TONLO of ZnO with Mn doping, using Z-scan experiment [Reference Nagaraja, Pramodini, Kumar, Nagaraja, Poornesh and Kekuda27]. All the work on nonlinear properties has been done on different substrates but not on silicon (Si). Hence, in the current study, high-quality thin films of pure and Al-doped ZnO with different molar concentrations (1, 2, and 3 wt%) were designed on Si(100) substrate by spin coating, and its detailed linear and nonlinear properties were studied. Several important properties of fabricated thin films such as structural, morphological, optical, and nonlinear optical such as: lattice constant, crystallite size, dislocation density, direct and indirect band gap, refractive index and nonlinear, were investigated and conferred in their corresponding sections.
Results and discussion
Structural analysis
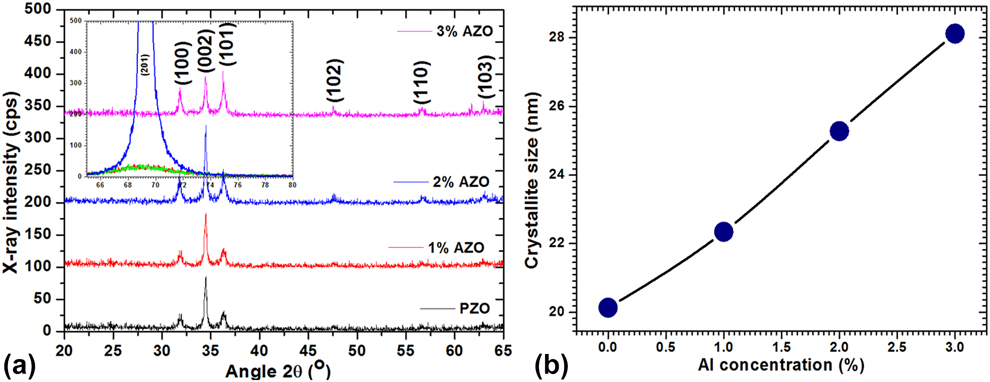
The X-ray diffraction (XRD) spectra for AZO thin films, spin-coated on Si(100) substrate can be seen in Fig. 1(a). It is observed that all the thin films have XRD peaks analogous to (100), (002), (101), (102), (110), and (103) planes. However, it is found that the intensity is high for (201) plane from others for 2 wt% AZO films. The indexed diffraction peaks of the XRD patterns correspond to hexagonal wurtzite ZnO structure, which is in harmony with JCPDS: 36-1451. The XRD analysis confirms the polycrystalline nature of the AZO thin films. Scherer’s formula [Reference Scherrer28, Reference Shakir, Kushwaha, Maurya, Bhagavannarayana and Wahab29, Reference Shakir, Singh, Gaur, Kumar, Bhagavannarayana and Wahab30] was used to determine the crystallite size of the films (Table I) from the width of XRD peaks [Reference Mohd, Khan, Hamdy, Algarni and AlFaify31, Reference Shkir, Yahia, Ganesh, Bitla, Ashraf, Kaushik and AlFaify32, Reference Shkir and AlFaify33],  $D = {{0.9\lambda } \over {\beta \cos \theta }}$, where (β) is FWHM (radians) and λ is wavelength (1.5406 Å). In the present study, large crystallite size is seen for 3 wt% Al in ZnO material owed to effect of doping on crystallinity enhancement. Figure 1(b) shows the crystallite size increasing with the increase in concentration of aluminum doping (i.e., 1, 2, and 3 wt%), which is quite similar to the previous report by Benramache et al. [Reference Benramache, Arif, Belahssen and Guettaf14]. The dislocation density (δ) of films can be estimated by [Reference Yahia, Shkir, AlFaify, Ganesh, Zahran and Kilany34, Reference Shkir, Yahia, Kilany, Abutalib, AlFaify and Darwish35, Reference Shkir, Kilany and Yahia36] δ = 1/D 2. This is a measure of film quality. Here, ZnO and AZO films possess dislocation density in the range of 2.5 × 10⁻³ to 1.3 × 10⁻³ nm−2, which might be the indication that Al incorporation in ZnO reduced the defects. Such results have previously been reported for Sn-, Al-, Co-, In-doped ZnO [Reference Ganesh, Yahia, AlFaify and Shkir13, Reference Benramache, Arif, Belahssen and Guettaf14].
(a) XRD patterns and (b) variation of crystallite size with Al doping.

Calculated lattice constant, D, and δ values for pure and Al-doped ZnO films.

FT Raman analysis
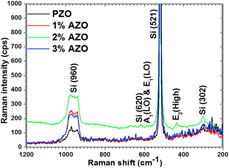
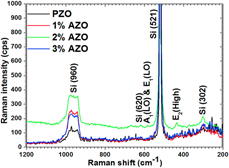
From Raman spectra of ZnO and AZO films depicted in Fig. 2, here it is describing the shifting of Raman spectra with intensity. It is visible from the figure that the Raman modes positioned at ∼302 ± 5, 521 ± 3, 620 ± 4, and 960 ± 3 cm−1 are assigned to Si substrate on which the films are deposited. Moreover, Raman modes positioned at ∼436 ± 2 cm−1 are ascribed to E2 (high), which is a key vibration of ZnO wurtzite phase; however, it shows some shift toward lower wavenumber compared to bulk ZnO (i.e., 443 cm−1). Such a shift is might be owing to low-dimensional nanorods formation in ZnO and AZO in the current work. Another Raman mode positioned at ∼580 ± 3 cm−1 is ascribed to A1 (LO) and E1 (LO) mode of vibration, which is asymmetric vibration mode that may have arisen from short and lofty wavenumbers contributions. The other low-intensity Raman modes observed at ∼370 ± 4, 416 ± 5, and 548 ± 3 cm−1 are assigned to transverse and second-order modes of vibrations. The key vibration mode is found to have ∼7 ± 2 cm−1 shifting in wavenumber toward the lower side, which may be due to small particle size and also the possibility of development of stress in films. This verifies that ZnO and AZO films possess more favorable epitaxial growth with Si substrate. The currently observed vibrational modes are well matched with previous reports [Reference Wei, Man, Liu, Xue, Zhuang and Yang37, Reference Yahia, Znaidi, Kanaev and Petitet38].
Raman spectra of pure and Al-doped (1–3 wt%) ZnO films.

EDX/elemental mapping and SEM analyses
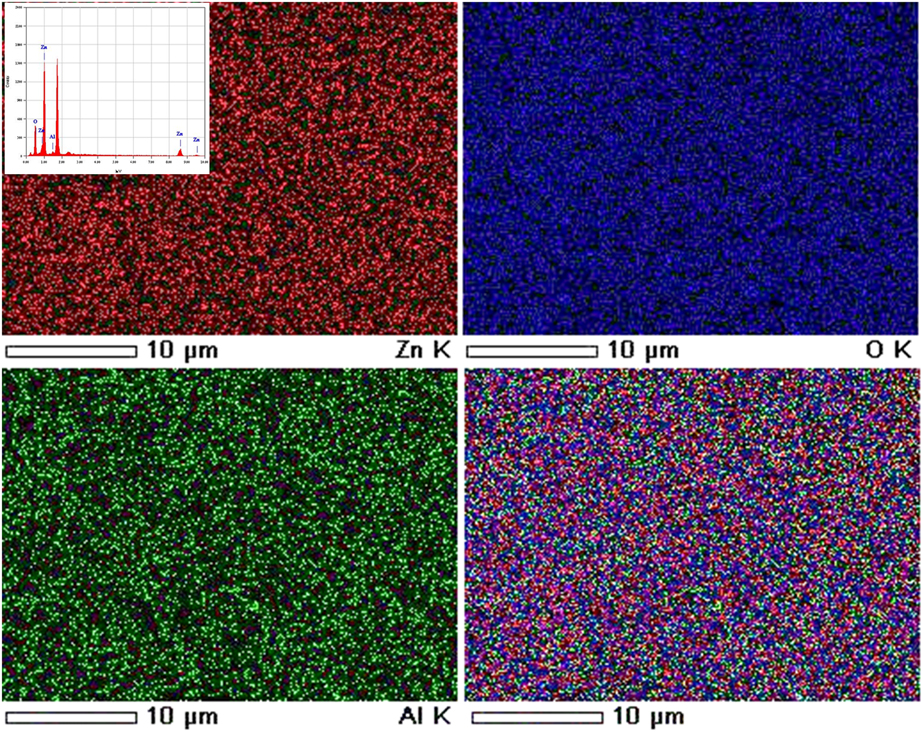
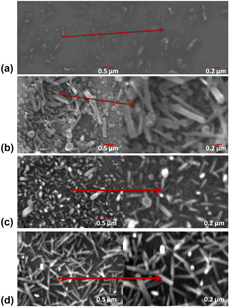
Figure 3 shows the EDX spectrum along with elemental mapping images for 2 wt% Al-doped ZnO films. Figure clearly showed that the Al has been doped homogeneously in ZnO matrix throughout the films. Figures 4(a)–4(d) show the SEM images of pure, 1 to 3 wt% Al-doped ZnO films. From Fig. 4(a), it is observed that the films contain very low size grains, which are maybe guessed as nanorods morphology. However, with 1 wt% Al doping, the nanorods morphology [see Fig. 4(b)] is very clear, which is growing more and more at higher concentration doping of Al [see Figs. 4(c) and 4(d)]. The diameter of nanorods for pure ZnO [Fig. 4(a)] is maybe <5 nm; however, the average dimension is in the range of 30–50 nm. These dimensions in case of 1 wt% and 25 AZO films are increased [Fig. 4(b)], and hence the diameter is also affected; however, at 3 wt% Al doping, the dimension becomes almost constant and showing well-defined nanorods, which are homogeneously distributed throughout the film surface.
EDX elemental mapping micrographs for 2 wt% Al-doped ZnO film.

SEM images of (a) pure, (b) 1 wt% Al, (c) 2 wt% Al, and (d) 3 wt% Al-doped ZnO thin film.

Linear optical properties
A study of electronic structure in reference to the optical properties is vital when non-centrosymmetric semiconductor materials, such as ZnO, are involved [Reference Jaffe, Pandey and Kunz39, Reference Dulub, Boatner and Diebold40]. The application of linear optical characteristics in modern optoelectronic devices has gained them much importance and well-discussed [Reference Chahmat, Haddad, Ain-Souya, Ganfoudi, Attaf and Ghers41, Reference Shishiyanu, Shishiyanu and Lupan42, Reference Tsay, Cheng, Tung, Tuan and Lin43, Reference Bougrine, El Hichou, Addou, Ebothé, Kachouane and Troyon44, Reference Miki-Yoshida, Morales and Solis45]; the current study presents a systematic calculation of the parameters such as diffused reflectance, linear and nonlinear susceptibilities, nonlinear refractive index, and various other parameters using standard relations.
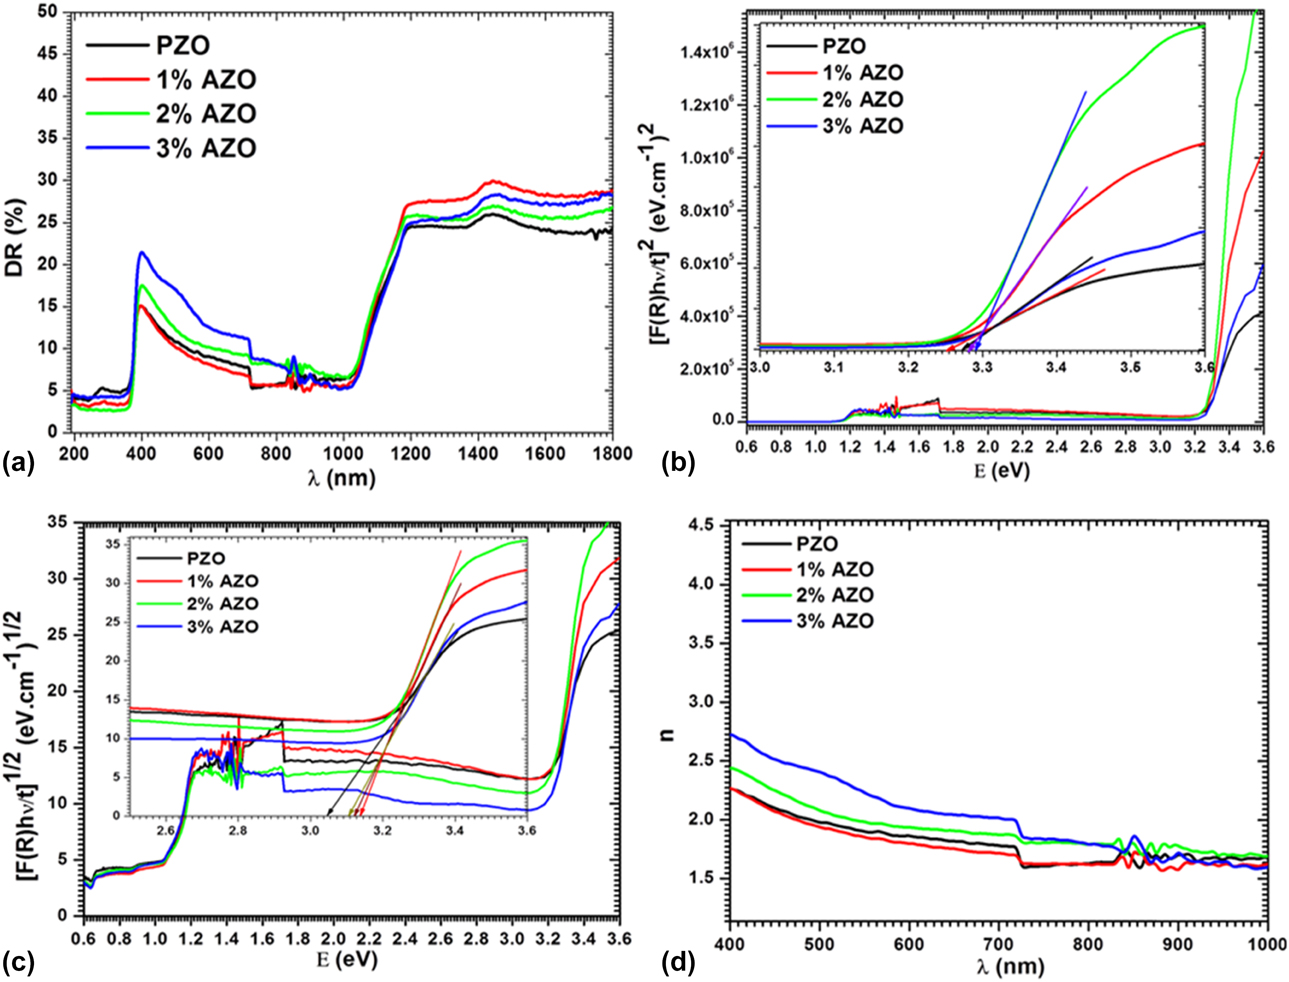
Figure 5(a) displayed DR spectra of ZnO and Al-doped ZnO films in 200–1800 nm range. It is visible from the figure that all films show reasonable transmittance with the edge of absorption at ∼400 nm for ZnO and ∼1000 nm for Si substrate. Measured data were used to determine the energy gap by Kubelka–Munk theory. Kubelka–Munk equation [Reference Kubelka and Munk46] is given by  $F\left( R \right) = {{{{\left( {1 - R} \right)}^2}} \over {2R}}$; here F(R) is a function of Kubelka–Munk and R indicates to reflectance of films. The coefficient of absorption in terms of F(R) is
 $\alpha = {{{\rm{absorbance}}} \over t} = {{F\left( R \right)} \over t}$; here the symbols are of standard meanings and t is thickness of the films. Energy band gap can be obtained using
 ${\left( {\alpha h\nu } \right)^{{1 \over r}}} = {\left( {{{F\left( R \right)h\nu } \over t}} \right)^{{1 \over r}}} = A\left( {h\nu - {E_{\rm{g}}}} \right)$; here the symbols are of standard meanings [Reference Shkir47, Reference Shkir, AlFaify, Ganesh, Yahia, Algarni and Shoukry48]. The band gap of AZO films was computed for direct and indirect allowed transition values of r (r = 1/2 and 2) and plotted as hν versus [F(R)hν/t]1/r in Figs. 5(b) and 5(c). The value of direct energy gap, E (g)dire., is obtained to be in range of 3.25–3.29 eV and is alike to previous reports [Reference Ganesh, Yahia, AlFaify and Shkir13, Reference Benramache, Arif, Belahssen and Guettaf14, Reference Ajili, Castagné and Turki49]. Value of indirect energy gap, E (g)indire., is obtained to be in range of 3.05–3.14 eV. Values of E (g)dire. and E (g)indire. are increasing with doping of 1 and 2 wt% and are higher in comparison to pure material. But the band gap value for 3 wt% doping is found to be slightly less than the other doping concentrations, however still higher than pure ZnO. The reason for this may be attributed to the increased thickness of the film at higher doping concentration, which leads to reduced bad gap value. Such doping concentration effect on energy gap broadening may be explained through Burstein Moss shift [Reference Andrade and Miki-Yoshida50]. It can be seen in figure that there is another energy gap ∼1.1 eV, which attributes due to Si substrate. The refractive index, n, of all films was also calculated using the following relation [Reference Shkir, Ganesh, AlFaify, Yahia and Zahran51]:
 $n = \sqrt {\left( {{{1 + R} \over {1 - R}}} \right) + \left( {{{4 \times R} \over {{{\left( {1 - R} \right)}^2}}}} \right)}$. Figure 5(d) displayed calculated n values for all films and its value is in range of 1.5–2.75. This clearly shows that Al doping in ZnO increases its refractive index.
(a) Diffused reflectance spectra, (b, c) direct and indirect band gap, and (d) linear refractive index of pure and Al-doped ZnO films.

Nonlinear susceptibility and refractive index analyses
To understand the nonlinear behavior of fabricated films and see the effect of Al doping on these properties, we have determined several constraints, as it is essential to investigate the linear and third-order nonlinear susceptibilities and nonlinear refractive index of all films for various nonlinear device applications [Reference Ganeev, Ryasnyansky, Kamalov, Kodirov and Usmanov52, Reference Boyd53, Reference Shkir, Ganesh, AlFaify and Yahia54].
Polarizability (p) in terms of nonlinear polarizability (P NL) is expressed as [Reference Frumar, Jedelský, Frumarova, Wagner and Hrdlička55] p = χ1E + P NL; here P NL = χ2E 2 + χ3E 3; here χ1, χ2, and χ3 are linear, second-order, and third-order nonlinear optical susceptibilities. In similar manner, n(λ) is n(λ) = n 0(λ) + n 2(E 2); here, n(λ) is expressed as n 0 (λ) ≫ n 2(λ), n(λ) = n 0(λ), and (E 2) is defined as mean square value of electric field and n 2 is known as nonlinear refractive index. The values of χ1 and χ3 are determined using the equations [Reference Ticha and Tichy56, Reference Wang57, Reference Wynne58, Reference Nasu and Mackenzie59],  ${\chi ^1} = {{{n_0}^2 - 1} \over {4\pi }}$ and χ3 = A(χ1)4; from these equation, we have
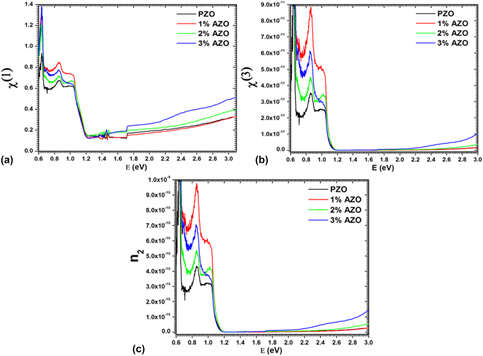
 ${\chi ^3} = A{\left( {{{{n_{\rm{0}}}^2 - 1} \over {4\pi }}} \right)^4}$, where A is a constant and its values is 1.7 × 10⁻¹⁰ esu [Reference Adair, Chase and Payne60]. The calculated values of χ1 and χ3 are plotted in Figs. 6(a) and 6(b). As can be seen from figure that the value of χ1 is found to be higher at 0.64 eV energy viz. ∼0.94 for pure and 1.38 for 3 wt% Al-doped ZnO; however, in energy range of 0.68–1 eV, its value is found almost equal to 0.61 for pure ZnO and 0.75 for 1 wt% Al-doped ZnO films. After 1.15 eV energy, the value of χ1 is found to be in range of ∼0.13–0.51 for ZnO and AZO films. Figure 6(b) displayed the plot for χ3 values and found to have similar behavior as of χ1. Its value is found in the range of 0.0053 × 10⁻¹⁰ to 1.3 × 10⁻¹⁰ for pure films and 0.004 × 10⁻¹⁰ to 6.24 × 10⁻¹⁰ for doped films. These values are found to be comparable with previous theoretical and experimental reports [Reference Edison, Nirmala, Kumar, Valanarasu, Ganesh, Shkir and AlFaify25, Reference Sofiani, Sahraoui, Addou, Adhiri, Lamrani, Dghoughi, Fellahi, Derkowska and Bala26, Reference Nagaraja, Pramodini, Kumar, Nagaraja, Poornesh and Kekuda27].
Plots of variation of (a) χ1, (b) χ3, and (c) n 2 with energy for ZnO and AZO films.

The value of n 2 is obtained using the equation [Reference Hanna61],  ${n_2} = {{12\pi {\chi ^3}} \over {{n_0}}}$, and displayed in Fig. 6(c). From figure, it can be observed that the value of n 2 is found to be higher at 0.64 eV energy viz. ∼1.37 × 10⁻⁹ for pure ZnO and 5.49 × 10⁻⁹ for 3 wt% Al-doped ZnO; however, in energy range of 0.68–1 eV, its value is found almost equal to 3.1 × 10⁻¹⁰ for pure ZnO and 7.1 × 10⁻¹⁰ for doped ZnO films. After 1.15 eV energy, the value of n 2 is found to be ∼2.1 × 10⁻¹³ for pure and doped ZnO films. Such variation in these values is may be due to all three factors such as Si substrate, Al doping, and thickness of films. Also, it may be due to light interaction, which generates polarization higher in such specific wavelength region [Reference Ganesh, Yahia, AlFaify and Shkir13, Reference Shkir, Ganesh, AlFaify and Yahia54, Reference Ganesh, Shkir, AlFaify, Yahia, Zahran and El-Rehim62]. Hence, all above characteristics of ZnO are enhanced by Al doping and found to be comparable with earlier reports on ZnO films [Reference Chtouki, Soumahoro, Kulyk, Bougharraf, Kabouchi, Erguig and Sahraoui63].
Conclusions
Fabrication of good quality pure and 1 wt%, 2 wt%, and 3 wt% Al-doped ZnO films was achieved by spin-coating process on silicon (Si) substrates, which were subsequently annealed at 600 °C. High crystallinity of fabricated films was confirmed from XRD patterns. Lattice constants were found to be varied with Al doping in ZnO; however, no major change was observed, which confirms the single phase. Scherer equation is used to calculate crystallite size and found in a range of 20–40 nm. Presence of Al and its homogeneous distribution throughout the film was approved by EDX and EDX elemental mapping analysis. Nanorods-like morphology was confirmed by SEM investigation. The dimension of nanorods is increased with increasing Al doping concentration and leads to best nanorods morphology. The direct and indirect band gap are calculated in the range of 3.25–3.29 eV and 3.05–3.12 eV, respectively, for pure and doped films. The linear refractive index is determined and found in a range of 1.5–2.75. The value of χ1 is estimated in range of 0.12–0.94 for pure and 0.13–1.4 for doped ZnO films. The χ3 values are estimated in range of 0.0053 × 10⁻¹⁰ to 1.3 × 10⁻¹⁰ for pure and 0.004 × 10⁻¹⁰ to 6.24 × 10⁻¹⁰ for doped ZnO films. The n 2 values are found in range of 0.0009 × 10⁻⁹ to 1.4 ×10⁻⁹ for pure and 0.0008 × 10⁻⁹ to 5.4 × 10⁻⁹ for doped ZnO films. Such enhanced results for doped ZnO films make them suitable for optical and nonlinear devices.
Experimental procedure
The synthesis procedure of sol–gel spin-coating method used for depositing pure and Al-doped (1–3 wt%) ZnO thin films is described in an earlier reported work [Reference Srinatha, Raghu, Mahesh and Angadi64]. In summary, for the fabrication of thin films, zinc acetate dihydrate (Zn(CH3COO)2·2H2O, 97%; Merck, Mumbai, India), 2-methoxy ethanol, (CH3O(CH2)2OH, 97%; Merck), aluminum chloride dihydrate (AlCl3 2H2O 97%; Merck), and monoethanolamine (MEA) ((HOCH2CH2) NH2, 97%; Merck) were used without further purification, as the source, solvent, dopant, and stabilizer, respectively. In the initial phase, 2.173 gm of Zn(CH3COO)2·2H2O was liquefied in 20 mL 2-methoxy ethanol at a constant temperature of 60 °C and was stirred for 1 h using a magnetic stirrer to prepare a 0.5 M homogeneous precursor solution. Also, 0.5 mL of monoethanolamine was added as a stabilizer to the resultant solution during continuous stirring for the equivalent time and temperature. Analogous procedure was implemented to fabricate the other three solutions for Al doping with the desired amount of dopant, which was added in different molar ratios of 1 wt%, 2 wt%, and 3 wt%. As-synthesized solutions of ZnO and AZO were stored in the shaded area for ∼48 h for suitable gel formation. After preparing all the chosen solutions, thin films were fabricated on Si(100) via spin coating.
Earlier to deposition, Si(100) substrates, 1 × 1 cm2 in size, were cleaned in ultrasonic cleaner by placing the substrate in a warm acetone bath for 10 min and in methanol for 5 min, followed by drying with oxygen blower. Sols of ZnO with 0, 1, 2, and 3 wt% Al doping was spin coated on the substrates at a rotation speed of 3000 rpm for 30 s to form thin films, which were then heated at 300 °C for 10 min and then permitted to cool down to RT. The method of coating and successive drying was repeated for 10 times to obtain the desired thickness of the film sample. Finally, the thin films were exposed to annealing at 600 °C for 2 h and cooled down to room temperature by using a programmable muffle furnace. The average thickness of ZnO and AZO thin films measured over thickness monitor is found to be 250 nm. The fabricated pure and AZO films were exposed to X-ray diffraction (XRD) analysis (Shimadzu Lab-X, XRD-600 40 kV, 30 mA; Kyoto, Japan) using Cu Kα radiation of wavelength 1.54056 Å with constant scanning rate 2°/min. The vibrational modes of the films were studied from the FT Raman spectra obtained via DXR FT Raman spectrometer over the range of 3500–500 cm−1. The elemental composition, morphology, and microstructure were examined by SEM/EDX (SEM, JSM 6360 LA, JEOL, Ltd., Tokyo, Japan). Diffused reflectance (DR) measurement was done using UV-3600 (Shimadzu UV-Vis-NIR spectrophotometer, Kyoto, Japan) over 190–1800 nm wavelength region.
Acknowledgment
The authors are grateful to Department of Science and Technology Ministry of Science and Technology & University Grants Commission, Government of India for the financial support. A.S. would like to thank the Department of Science & Technology, Ministry of Science & Technology, Govt. of India for the award of Young Scientist and BOYCAST Fellowship. The authors from KKU would like to express their appreciation to the Deanship of Scientific Research at the King Khalid University for funding this work through Research Groups Program under Grant No. R.G.P. 2/10/39. Authors are also thankful to Prof. I.S. Yahia, KKU, KSA for help in OC.