Introduction
Obesity has risen in all European countries, and on the agendas of policymakers (Gray, Reference Gray2009; Kersh, Reference Kersh2009; Gortmaker et al., Reference Gortmaker, Swinbum, Levy, Carter, Mabry, Finegood, Huang, Marsh and Moodie2011). The call for public intervention is justified on public health grounds, and consensus is growing that the size of the health care burden on taxpayers deserves active consideration by policy planners (World Health Organization, 2000; Mazzocchi et al., Reference Mazzocchi, Traill and Shogren2009). There is less agreement (and little comparative evidence) on the relative effectiveness of alternative public intervention strategies (Cecchini et al., Reference Cecchini, Sassi, Lauer, Lee, Guajardo-Barron and Chisholm2010; Beaglehole et al., Reference Beaglehole, Bonita and Horton2011; Brambila-Macias et al., Reference Brambila-Macias, Shankar, Capacci, Mazzocchi, Perez-Cueto, Verbeke and Trail2011; Capacci et al., Reference Capacci, Mazzocchi and Shankar2012).
While there is broad support for policies aimed at protecting children (Evans et al., Reference Evans, Finkelstein, Kamerow and Renaud2005), conflicting views are especially found for those policies that are regarded as more intrusive, such as taxes on unhealthy food and drinks (Jacobson and Brownell, Reference Jacobson and Brownell2000; Leicester and Windmeijer, Reference Leicester and Windmeijer2004; Caraher and Cowburn, Reference Caraher and Cowburn2005; Brownell and Frieden, Reference Brownell and Frieden2009), restrictions on advertising (Zywicki et al., Reference Zywicki, Holt and Ohlhausen2004; Veerman et al., Reference Veerman, Van Beeck, Barendregt and Mackenbach2009), or the imposition of label requirements or nutrition standards on the food industry (Grunert and Wills, Reference Grunert and Wills2007; Lang and Rayner, Reference Lang and Rayner2007; Ludwig and Nestle, Reference Ludwig and Nestle2008; Variyam, Reference Variyam2008; Capacci et al., Reference Capacci, Mazzocchi and Shankar2012) compared with less intrusive choices like informing consumers through social marketing (Grier and Bryant, Reference Grier and Bryant2005; Lang and Rayner, Reference Lang and Rayner2010), targeting school children through education measures or school meal standards (Story, Reference Story1999; Cawley, Reference Cawley2006), and especially public–private partnerships such as the UK Responsibility Deal (Crockett and Kennedy, Reference Crockett and Kennedy2002).
Together with their health benefits, healthy eating policies involve explicit or implicit economic costs to the taxpayer. Even in cases where the monetary costs are borne by producers, retailers or advertisers, they will ultimately impact consumers through higher retail prices or a restriction in the range of available food choices (Parkinson and Goodall, Reference Parkinson and Goodall2011). Ultimately, public policies must generate social benefits which exceed social costs, but both health outcomes and stakeholder costs are difficult to monetise. Hence, consideration of public perception of the effectiveness and social desirability of the alternative policy routes to improving taxpayers’ well-being becomes a key part of the process. Furthermore, since the debate between libertarianism and paternalism is far from over, policy makers wish to consider public opinion when devising healthy eating policy actions (Kim and Kawachi, Reference Kim and Kawachi2006). The picture becomes even more complicated when distributional effects are taken into account. There is extensive evidence that the prevalence of unhealthy diets, obesity and their health consequences is higher in the middle and lower income classes (Drewnowski and Specter, Reference Drewnowski and Specter2004; Drewnowski and Darmon, Reference Drewnowski and Darmon2005; Pickett et al., Reference Pickett, Kelly, Brunner, Lobstein and Wilkinson2005; Wilkinson and Pickett, Reference Wilkinson and Pickett2006; Gortmaker et al., Reference Gortmaker, Swinbum, Levy, Carter, Mabry, Finegood, Huang, Marsh and Moodie2011), which also means that the economic burden of publicly subsidised health care is larger. Thus, taxation of unhealthy foods or nutrients may lead to undesired regressive economic consequences, as it places a higher burden on the poorer (Leicester and Windmeijer, Reference Leicester and Windmeijer2004; Nnoaham et al., Reference Nnoaham, Sacks, Rayner, Mytton and Gray2009), while the health benefits are expected to be progressive and larger for those with a lower income (Zhen et al., Reference Zhen, Finkelstein, Nonnemaker, Karns and Todd2014). Views on the effectiveness of ‘fat taxes’ in promoting health are also conflicting. The objective of this type of tax is often restricted to tax revenue generation rather than changing behaviour, as is the case for most of the US ‘twinkie taxes’ (Jacobson and Brownell, Reference Jacobson and Brownell2000; Chouinard et al., Reference Chouinard, Davis, LaFrance and Perloff2007). Others argue that these taxes may be effective when large (Nordstrom and Thunstrom, Reference Nordstrom and Thunstrom2009; Powell and Chaloupka, Reference Powell and Chaloupka2009; Fletcher et al., Reference Fletcher, Frisvold and Tefft2010; Tiffin and Arnoult, Reference Tiffin and Arnoult2011; Mytton et al., Reference Mytton, Clarke and Rayner2012; Smed, Reference Smed2012; Briggs et al., Reference Briggs, Mytton and Kehlbacher2013), or that consumer substitution is more likely to occur between unhealthy foods than towards healthier choices, so that, paradoxically, the ultimate effect might be a shift towards cheaper unhealthy foods (Mytton et al., Reference Mytton, Gray, Rayner and Rutter2007). The evidence basis is still rather limited and mainly based on economic simulations, not least because of the small number of nutrition policies in developed countries outside the United States which have been in place for a sufficient number of years to enable health outcome evaluation (Brambila-Macias et al., Reference Brambila-Macias, Shankar, Capacci, Mazzocchi, Perez-Cueto, Verbeke and Trail2011; Capacci et al., Reference Capacci, Mazzocchi and Shankar2012).
Nevertheless, things are moving fast in Europe. France introduced a soda tax in 2012 (Legifrance.gouv.fr, 2012) within a wider tax reform, and Denmark adopted a tax to reduce saturated fat intakes in 2011, only to withdraw it at the end of 2012 (Smed, Reference Smed2012; Jensen and Smed, Reference Jensen and Smed2013). Many other countries are considering fiscal interventions, possibly with an emphasis on tax revenues in times of financial crisis (Chouinard et al., Reference Chouinard, Davis, LaFrance and Perloff2007; McColl, Reference McColl2009).
With such a limited or conflicting body of evidence, an assessment of public perception becomes key to successful implementation, and the most well-intentioned and well-crafted policy may flounder in the absence of public support.
A seminal study on the United States in 2001 (Oliver and Lee, Reference Oliver and Lee2005) reports that those ascribing obesity to the food environment are more supportive of paternalistic policies. Their measures of willingness-to-pay (WTP) to fund policies suggest the majority of US citizens would accept tax increases between $50 and $100 to fund policies aimed at combating (childhood) obesity. In a commentary on this study, Brownell (Reference Brownell2005) challenges the stability of some of the findings by Oliver and Lee, and argues that obesity concerns and support have grown over time, including higher support for taxation and bans. Similarly, although with a focus limited to restrictions in marketing to children, Wilde (Reference Wilde2009) argues that a soft approach and industry self-regulation might generate support for more directive policies over time, in case the former fails to achieve significant results. Finally, a systematic review by Diepeveen et al. (Reference Diepeveen, Ling, Suhrcke, Roland and Marteau2013) on a broader set of health-related lifestyles documents public preference for less intrusive policies and those targeting children.
Since policy preferences vary across culture and over time, and Europeans are relatively new to the debate, in 2011 we conducted a similar survey, based on a representative sample of 3003 respondents in five European countries, to measure public support and WTP (through the tax system) for different policy measures. This is the first multi-country European survey of policy preferences and covers the full range of potential drivers explored in the literature.
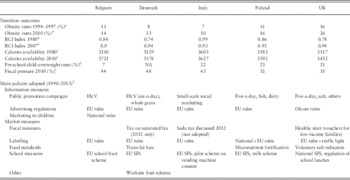
The countries considered in this study are Belgium, Denmark, Italy, Poland and the United Kingdom. These countries have different backgrounds in nutrition outcomes and policies, although they have rising obesity rates in common, as shown in Table 1. The United Kingdom has the highest prevalence of adult obesity, but also a longer history of intervention and a wider range of adopted policy measures, based on a national nutrition policy framework. Denmark has also been very active in policymaking, including notably the short-lived introduction of a fat tax and the implementation of a trans-fat ban. The remaining countries mainly rely on information campaigns or EU-driven legislation on school fruit provision, labelling and advertising. Italy (where interventions are smaller scale and fragmented) has the lowest rate of adult obesity, but alarmingly high child overweight rates, and there is evidence of a declining trend in compliance with dietary recommendations, in contrast to all other countries. Belgium shows the highest increase in calorie availability, whereas a decrease is found in Poland.
Nutrition outcomes and policy measure in surveyed countries

a Based on self-reported weight and height, with the exception of the United Kingdom (measured), source OECD Health Statistics.
b Indicator of compliance to WHO healthy eating norms (see Mazzocchi et al., Reference Mazzocchi, Brasili and Sandri2008), our processing on FAOSTAT data.
c Based on FAOSTAT disappearance data.
d Overweight and obesity rates as reported in (Cattaneo et al., Reference Cattaneo, Monasta and Stamatakis2010) various years (Belgium 1999, Italy 2005, Poland 2000, UK 2002).
e Source: OECD Tax Statistics.
f Based on Capacci et al., Reference Capacci, Mazzocchi and Shankar2012 and integrated with the WHO/NOPA database.
Public support for healthy eating policies and its drivers
There have been few attempts at measuring acceptance or support of policy interventions targeted at improving nutrition, and even less linking support back to the potentially wide range of explanatory factors. These have mainly focused on demographics, with some evidence that support was generally higher amongst those on low incomes, females and those with high education levels, although with heterogeneous and even conflicting results across policies (Evans et al., Reference Evans, Finkelstein, Kamerow and Renaud2005; Oliver and Lee, Reference Oliver and Lee2005). In general, these quantitative models have had relatively poor explanatory power.
Specific results from previous studies in this area are reported below, but some general consistencies across countries can be anticipated. First, almost all surveys find a much higher acceptance for policies targeted at children. Second, when attributions of obesity are measured, these are found to be a major predictor of acceptance regardless of the country being studied. Third, while taxation and restrictions on advertising are consistently reported as ‘less accepted’, there is a great deal of variation across studies. Acceptance rates above 50% are often reported even for those measures perceived as most paternalistic.
An assessment of the evolution of acceptance over time based on the literature is more problematic, as the specificities of the various surveys make the items being measured hardly comparable over time. However, there is suggestive evidence that support is associated with the stage of implementation of policies. Only the United States and Germany had more than one study of this type carried out in different years, but no robust trend emerges from comparing the results. The first study was the one described above by Oliver and Lee on the United States. Based on a telephone survey of a random sample of 909 adult respondents in 2001, they aimed at exploring both the attributions of obesity emerging from the survey and the drivers of nutrition policy acceptance. Their hypothesis (partially confirmed by their findings) was that those who ascribe obesity to individual behavioural failure are less likely to support paternalistic policies than those who see genetics and environments as a leading cause. Their results show relatively little support for policies combatting obesity in general, and they encounter difficulties in explaining the drivers of policy support.
Since 2001, several other US-based surveys have measured the level of public concern for obesity. By means of an on-line survey on a nationally representative sample of 1009 US respondents in 2006/7, Barry et al. (Reference Barry, Brescoll and Brownell2009) consider items similar to those in Oliver and Lee, and include seven explicit and articulated metaphors to record beliefs on the causes of obesity, for example statements that describe obesity in terms of sinful behaviours, addiction or the outcome of a ‘toxic environment’. The explanatory power of their model does increase following the inclusion of these metaphors along with socio-demographic drivers, but it still remains low, explaining 22% or less of the variance in public support.
A nationally representative survey of 1002 respondents conducted by the Harvard Forums on Health (Harvard School of Public Health, 2003) found that adult obesity was perceived as comparable to smoking in terms of public health concern, and reported a relatively high level of support for information campaigns (77% of respondents) but a much lower acceptance for a ‘special tax on junk foods’ (41%). Children-targeted interventions emerged as the most supported (especially ‘healthier school lunches’ with an acceptance rate of 95%), but among these, vending machine bans and advertising restrictions were the least accepted (59% and 58%, respectively). Another study based on a representative random sample of 1010 US adults in 2004 (Evans et al., Reference Evans, Finkelstein, Kamerow and Renaud2005) evaluated public support for 18 alternative policies targeted at childhood obesity. Education measures in schools were widely supported (94% of respondents), while banning vending machines from schools and additional taxation of junk foods were the least supported measures (36% and 39% of respondents). In terms of WTP, 71% of respondents declared they would accept a $25 increase in income tax to fund nutrition policies for children, against 50% who declared they would accept a $100 increase. A similar WTP amount was found by the 2003 Harvard survey, in which 76% of Americans were willing to pay taxes ‘to fight childhood obesity’ and 42% declared they would accept paying more than $100. These figures are consistent with the finding by Oliver and Lee that 64% of Americans would accept to pay $50 for more nutritious school lunches. An analysis by Cawley (Reference Cawley2008) based on 477 respondents from the 2006 Empire State Poll elicited the WTP of New York residents using contingent valuation to curb childhood obesity, with an estimated WTP of $46 per capita to halve obesity rates.
More recently, in October 2011, a large survey administered to 1817 US adults measured acceptance of obesity policy measures among a broader set of regulations also targeting other behavioural risk-factors for non-communicable disease (Morain and Mello, Reference Morain and Mello2013). This study confirmed higher support for childhood obesity policy (around 81%) relative to measures tackling adult obesity (still at 76%). Another recent paper by Barry et al. (Reference Barry, Niederdeppe and Gollust2013) has explored public opinion on pre-defined arguments against or in favour of a tax on sugar-sweetened beverages, showing higher consensus for arguments against (with level of agreement between 50% and 60%) relative to arguments in favour (between 35% and 50%). The top argument against the tax was the perception of its arbitrariness, assuming that its overall impact on calorie intake would be insignificant (60%). Instead, agreement on arguments supporting the tax was maximum for the statement indicating soft drinks as the main contributor to obesity, and its association with high calorie intakes from other foods (50%). The split (and even some overlap) between supporters of the two conflicting arguments clearly indicates the level of uncertainty and the potentially dynamic evolution of public support.
To our knowledge, four similar surveys were carried out outside the United States, one in Australia in 2002 (Hardus et al., Reference Hardus, van Vuuren, Crawford and Worsley2003), two in Germany, in 2005 (Hilbert et al., Reference Hilbert, Rief and Braehler2007) and 2012 (Sikorski et al., Reference Sikorski, Luppa, Schomerus, Werner, Konig and Riedel-Heller2012) and one in the United Kingdom in 2011 (Emm et al., Reference Emm, Gillison and Juszczyk2013). They all found that obesity ascriptions were a major contributor in explaining generic support for obesity prevention. The first three studies exploited a latent variable technique (Principal Component Analysis) to identify causal attributions for obesity starting from specific questionnaire items.
A different stream of research has investigated similar hypotheses relying on qualitative or secondary data. Bos et al. (Reference Bos, Van der Lans, Van Rijnsoever and Van Trijp2013) have investigated Dutch consumer acceptance of alternative policy strategies based on focus groups and semi-structured interviews, suggesting that the three main drivers of support were general beliefs regarding obesity, the perceived effectiveness of interventions, and the perceived fairness of interventions. Some evidence regarding public support for childhood obesity policies in Europe was also found in the Eurobarometer survey (Suggs and McIntyre, Reference Suggs and McIntyre2011), also showing relatively little heterogeneity across EU countries and, once more, a higher support for information and education measures relative to advertising restrictions.
Complementary to studies on public opinion, the PorGrow project (Millstone and Lobstein, Reference Millstone and Lobstein2007) investigated perceptions and judgements of obesity policies by various stakeholder groups, including public interest NGOs, policy makers, and the food industry. The approach consisted of multi-criteria analysis on data from individual in-depth interviews in nine EU countries (Stirling et al., Reference Stirling, Lobstein and Millstone2007). This research also showed a shared acceptance of information-enhancing and education measures, and a lower support for more intrusive regulations, especially for stakeholders in the private sector.
Methods
Survey design, sampling and field work
The survey was administered in five European countries (Belgium, Denmark, Italy, Poland, and the United Kingdom) through Computer Assisted Web Interviewing (CAWI). A validation survey to check for potential on-line biases using a Computer Assisted Telephone Interviewing (CATI) method was additionally administered in United Kingdom and Italy and showed that CAWI returns only slightly lower estimates of support rates compared with CATI (<5% difference in 16 items out of 20). Questionnaires were translated and back-translated to check for consistency across languages, then piloted in November 2010, while the actual survey took place between 7 and 22 February 2011. Sample extraction was based on disproportional stratified sampling from the GfK e-panel (414,000 potential respondents in the five countries), using age and gender as stratification variables. The required sample sizes were achieved via oversampling and by appropriate replacement procedures also based on age and gender matching. Sample size was 3003 for the CAWI (600 in each country, except United Kingdom with 603); the average length of the interview was 22 minutes. The response rate was 18.7% (ranging between 11% in Belgium and 27% in Italy), and no particular demographic pattern was found in non-responses.
The survey was designed to ensure representativeness by age and gender at the country level, and post-stratification weights were applied to match the national age and gender composition. These constituted relatively minor corrections associated with differences in internet penetration rates, which mainly required placing additional weight on elderly stakeholders in Poland and Italy. The application of post-stratification weights had a negligible impact on the results of statistical analysis, which is consistent with the result – discussed later – that demographics have very little influence on policy support and obesity attributions.
Questionnaire
The complete questionnaire included 47 questions structured in three sections, building on and extending the questionnaire by Oliver and Lee (Reference Oliver and Lee2005). A first section was aimed at collecting personal information, including demographics, household characteristics (composition, financial status, etc.), subjective health status, education level, internet use, levels of physical activity (IPAQ classification), smoking, drinking and eating habits, perceived risks to own health. A series of validated questions was also included that probed the ‘regulatory focus’ of respondents, a construct arising from the social psychology literature (Higgins et al., Reference Higgins, Friedman, Harlow, Idson, Ayduk and Taylor2001). This measures the extent to which individuals approach new tasks with ‘promotion-based’ eagerness, or with ‘prevention-based’ vigilance, based on past experiences, and has been shown to be important in explaining how people judge public policies (Camacho et al., Reference Camacho, Higgins and Luger2003) and their attitude towards change in comparison to stability (Jost et al., Reference Jost, Glaser, Kruglanski and Sulloway2003). In the second section respondents were asked to rate the seriousness of a selection of health risks for their country, including conditions like cancer, diabetes and heart disease and risk factors associated with individual behaviour (smoking, heavy drinking and obesity). The measurement of public support for healthy eating policies was based on 20 items formulated as statements (Table 1). Agreement was measured on 5-point Likert scales. Attributions of obesity were measured through 5-point agreement scales with 12 statements (Table 2): six from Oliver and Lee (Reference Oliver and Lee2005) relating to genetic, environmental and individual factors; and six additional items reflecting other factors associated with poor diets: lack of time, discounting future health consequences, affordability of healthy foods, availability of and easy access to unhealthy foods, and lack of information to make healthy choices (Mazzocchi et al., Reference Mazzocchi, Traill and Shogren2009).
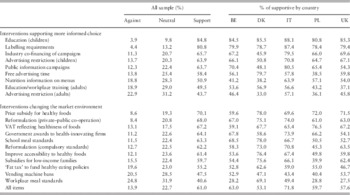
Policy support: aggregate results and by country, ranked by support level

Supportive respondents were defined as those who agree or strongly agree to the policy statement. Percentages do not sum to 100% because ‘don’t knows’ are not shown. Full tables (including full wording of questionnaire items and variability measures) are available as supplemental on-line material.
The third section was targeted at monetising acceptance of healthy eating policies and collecting information on diagnosed diseases, political views, household income and self-assessed financial conditions, and beliefs related to eating choices. Stated WTP measures are likely to be overestimates, but they should give a reliable representation of WTP heterogeneity across individuals (Botelho and Pinto, Reference Botelho and Pinto2002). One question measured the relative importance of healthy eating policies compared to other actions to promote health, housing, security, transportation and the environment by asking respondents to allocate among these policies the proceeds from a €150 increase in taxes. The next item asked whether the respondent would either accept an increase or demand a cut in general taxes to support each of five different healthy eating policies (public information; education; ‘thin’ subsidies; healthy-eating vouchers for low-income families; and free shopping delivery for disadvantaged groups). Based on their response to this question, respondents were asked by how much they would be prepared to accept an increase or demand a reduction in taxes, using five fixed €10 brackets, up to €50.
Statistical analysis
The relatively large number of items employed to measure policy support and obesity attributions enables the application of exploratory and confirmatory factor analysis, and the estimation of a structural equation model (SEM) to estimate and test interactions and assumed causal relationships. These methods assume that the questionnaire items are observable proxies of the true latent dimensions, and exploit the correlations between multiple items loading on the same construct to identify these dimensions. Thus, potential item-specific biases like wording or ambiguity end up in the error terms and are likely to become negligible.
A three-step procedure was adopted (Anderson and Gerbing, Reference Anderson and Gerbing1988): (1) exploratory ordinal factor analysis (EFA) (Jöreskog and Moustaki, Reference Jöreskog and Moustaki2006); (2) confirmatory factor analysis (CFA) separately for each construct to confirm/disconfirm the result of the EFA; (3) complete SEM using the results of the CFA. All estimates were based on robust maximum likelihood for observed ordinal data (Jöreskog et al., Reference Jöreskog, Sörbom, Du Toit and Du Toit2001). The final SEM model was the outcome of a backward selection process on the explanatory variables, applied in order to obtain more efficient estimates for those variables which were retained. The starting model included a large number of potential drivers related to individual and household characteristics (country of residence, age, gender, marital status, education level, political views of the respondent, household size, number of kids, presence of elderly requiring assistance), other lifestyle and health risk factors (eating out, physical activity, drinking and smoking habits, body mass index, subjective health status), and a set of attitudinal drivers corresponding to the identified latent factors, which relate to obesity attributions, individual and societal health risk concerns, regulatory focus, and beliefs about eating choice.
Finally, we explored the determinants of WTP to support healthy eating policies based on three regression models. First, we benchmarked the drivers of policy support by generating a binary variable to distinguish between those that were supportive (or at most neutral) to all types of envisaged policies, vs those who were not supportive of at least one policy. We estimated a binary logistic regression model to identify the drivers of generic support. Then we estimated two least-squares regression models, where stated WTP was expressed as a function of the same drivers, and the policy support factors were estimated through EFA. The first regression included all observations in the sample, whereas the second was based on a restricted sample of respondents who declared to be supportive.
Results
Public support for healthy eating policies
Results indicated relatively high levels of public support for all healthy eating policies (Table 2). Although percentages are likely to be affected by biases associated with social desirability and the higher ‘neutrality’ rates observed in CAWI interviews relative to other administration methods, there is no reason to expect relative comparisons to be affected. The average level of support was very high, with 61% of responses in the agreement/strong agreement range against only 13.9% in the disagree/strongly disagree range. The policy measure with least support in most countries was the imposition of standards on workplace meals (40.6% agreed with such a measure, and 24.8% opposed it). Bans (advertising to adults, vending machines in schools) also received relatively less backing. The statements which received the highest level of support related to healthy eating education in schools (84.8% support and 3.9% disagree), and compulsory labelling with nutrient and calorie information on all foods (80.8% vs 4.4%). Public subsidisation to reduce fruit and vegetable prices was also highly supported (70.1%). Average stated support is highest in Italy and lowest in Denmark. Many consistencies emerge across countries, like the low backing for banning advertising to adults and the high support for education measures and labelling. The least consistency is observed for government-industry cooperation in reformulating foods, which receives good support in Italy and Belgium, and a much lower support in Denmark and the United Kingdom.
Perceived attributions of obesity
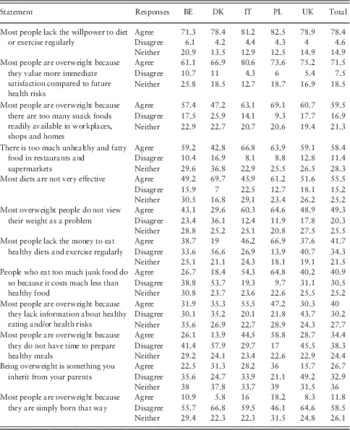
Table 3 shows the distribution of agreement/disagreement for attributions of obesity. Two dimensions dominate, one pertaining to individual behavioural failure (especially lack of will-power at 78% or self-control at 72%), the other blaming the excessive availability of snack and unhealthy foods (in workplaces, shops, restaurants, supermarkets and homes, with a rate of agreement just below 60%).
Attributions of obesity (frequency distributions, %)

Genetics-related statements generated the highest level of disagreement. Among all causes, those for which public opinion is most divided are related to financial and time constraints. The results are consistent with those reported in Oliver and Lee, but opinions in Europe are stronger (e.g. 78% agreeing with lack of willpower in Europe vs 65% in the US survey, or 27% agreeing with inheritability of obesity in Europe vs 40% in the United States). Whether these discrepancies can be ascribed to the survey location or to the long time elapsed between these two surveys remains an open question.
Factors explaining public support for healthy eating policies
Our analysis of policy support statements first focused on the latent factors uncovered from the questionnaire items based on EFA. All extracted factors came out neatly in terms of interpretability and fit, and rotation of the CAWI questionnaire items guaranteed that this was not due to order biases. The classification of healthy eating policies based on correlations in the levels of stated support resulted in four latent groups: advertising restrictions, information policies (education, labelling and social marketing), fiscal interventions (taxes, VAT measures and price subsidies), and policies relating to content and access (vending machine bans, imposition of nutritional standards, food supply reformulation, vouchers to increase economic accessibility for low-income consumers). Attributions of obesity also generated four factors, reflecting responsibility ascribed to individual factors (lack of willpower, discounting the future, not caring about being obese, ineffectiveness of diets), the supply environment (excessive availability of unhealthy foods supermarkets and restaurants, too many snack foods readily available in workplaces, shops and homes, lack of information), economic factors (prices, incomes, time availability), and genetic factors (obesity inherited from parents, obese individuals are born that way). EFA was also carried out to uncover latent factors underlying variables in the survey relating to health risk perceptions and beliefs driving food choices. In a second stage, the results from EFA were reproduced using CFA, with fully satisfactory goodness-of-fit diagnostics.
The complex set of relationships between the latent variables and other covariates was then explored through a structural equation model. The final model, which only retains those explanatory factors and covariates significant at the 10% confidence level in at least one of the structural equations, shows an excellent goodness-of-fit by SEM standards (Iacobucci, Reference Iacobucci2010).
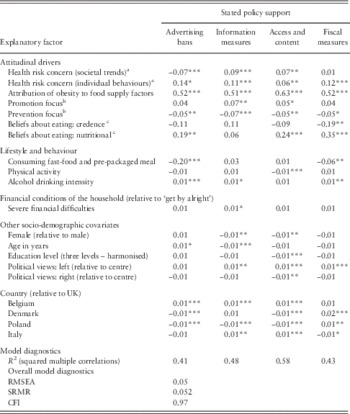
Table 4 reports the standardised coefficients of the model for each category of policy support. Standardisation of the coefficients enables comparability across the various explanatory factors.
Structural model of support for healthy eating policies

***Significant at the 99% confidence level; **95% c.l.; *90% c.l.
a Concern for health risks driven by societal lifestyle trends’ measures level of concern with morbidity and mortality risks associated with societal lifestyle trends, such as heart disease, cancer and AIDS; ‘Concern for health risks driven by individual factors’ measures concern with risks more frequently associated with individual choices, such as smoking, drinking and obesity.
b Promotion focus’ measures the extent to which individuals are likely to approach new tasks with ‘promotion-based’ eagerness, and ‘prevention focus’ measures the extent to which they are likely to approach with ‘prevention-based’ vigilance, based on past experiences.
c Beliefs about eating are variables that measure strength of beliefs that drive respondents’ food choices. Credence (ethics and safety) measures importance attached to aspects such as ethics and environmental aspects of production and animal welfare. The nutritional (healthiness) variable measures importance attached to overall healthiness, as well as individual nutrient contents.
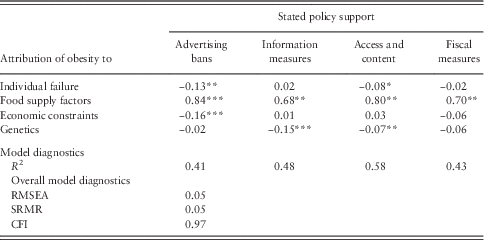
For ease of reading, we have classified the retained explanatory factors into four categories: attitudes, lifestyle and behaviours, economic factors and demographic factors, plus a final set of dummies to capture any remaining country-specific effect. Attitudinal drivers are by far the most influential, as they show the largest standardised coefficients. More specifically, obesity attributions are confirmed as an important predictor of healthy eating policy support, as in previous studies (Oliver and Lee, Reference Oliver and Lee2005; Hilbert et al., Reference Hilbert, Rief and Braehler2007; Barry et al., Reference Barry, Brescoll and Brownell2009), but the SEM model goes further by indicating the primary importance of the specific set of attributions referring to the food supply environment. As a matter of fact, the three other factors derived from obesity attribution statements were not significant at the 10% level and did not enter the model, which suggests that ascription of obesity to individual behavioural failure, economic factors, or genetics is not discriminating in determining policy support.
Instead, people who agree that obesity is the outcome of excessive availability of nutritionally inadequate foods are very supportive of all types of healthy eating policy. This factor is especially relevant in explaining support for more intrusive content and access regulatory measures. Next in importance are attitudinal factors relating to beliefs driving food choice. More specifically, those who attribute a large importance to the nutritional content of foods (calorie, fats, cholesterol) tend to be more supportive of paternalistic policies, like fiscal measures, advertising bans and access and content measures, while the effect on information measures is positive but not significant, possibly indicating that nutrition-conscious consumers do not feel constrained by information asymmetries. On the other hand, respondents who state that credence or ethical characteristics are important in their food choices (e.g. animal welfare, environmental impacts, food safety) are less supportive of fiscal interventions.
Other highly significant attitudes are those related to health risk concerns, which enter the model in two dimensions: (a) ‘societal concerns’ for the prevalence of non-communicable diseases (cancer, heart disease, depression, diabetes, etc.); (b) ‘individual concerns’ for the health consequences associated with risky individual behaviours (smoking, drinking, excess weight). These beliefs act in heterogeneous ways. While concerns about individual behaviours translate into higher support for all types of policies, those worried about societal trends tend to be more supportive of information and access/content measures, but less supportive of restrictive regulations like advertising bans, and neutral towards fiscal policies. Last among attitudinal factors, regulatory focus seems to have a significant impact on support, but its interpretation is not straightforward, as we find evidence that individuals with a stronger prevention focus tend to be less supportive of any type of policy, and vice versa (although to a lesser extent) those with a stronger promotion focus are more supportive. While this contrasts with the expected association between regulatory focus and paternalism/libertarianism, Jost et al. (Reference Jost, Glaser, Kruglanski and Sulloway2003) indicate that prevention focus could be interpreted as a proxy for conservatism and a preference for stability over change, which might partially explain the result.
The second set of drivers explores the link between policy support and stated lifestyles and behaviours. These effects are relatively small, with the exception of those reporting a frequent consumption of fast-food and pre-packaged foods, whose support for advertising bans and fiscal policies is significantly negative. There is also a very small but positive and significant association between drinking intensity and policy support.
All other significant covariates move in the expected direction, but the magnitudes of the effects are very small compared with attitudinal and lifestyle drivers. Subjective health status, as well as body mass index categories including overweight and obesity, turned out to be insignificant and were excluded in the backward selection process.
After controlling for the explanatory factors, there is still some unexplained country-specific variability, as indicated by the very small but significant country effects. The Danish sample is associated with a slight preference for fiscal measures, although the magnitude of this effect is as small as those found for social and demographic drivers.
In summary, estimates from the causal model indicate the relevance of attributions of obesity to external factors in explaining stated support, a result which is consistent with the findings of Oliver and Lee (Reference Oliver and Lee2005) and Barry et al. (Reference Barry, Brescoll and Brownell2009) in the United States, Hilbert et al. (Reference Hilbert, Rief and Braehler2007) and Sikorski et al. (Reference Sikorski, Luppa, Schomerus, Werner, Konig and Riedel-Heller2012) in Germany. However, our study also found that ascriptions to individual failure, genetic causes or economic constraints do not emerge as significant in the most comprehensive model. Table 5 shows the results from a reduced structural model where only obesity attributions and policy support are considered. It is worth noting that the model diagnostics are similar to those from the larger model. Beyond confirming the large and positive relevance of external factors in explaining support, the model returns some other significant coefficients, all with negative signs. Ascription to behavioural failure is negatively associated with support for advertising bans or access/content measures, blaming economic constraints reduces support for advertising bans, and attribution to genetic causes reduces support for information policies and access/content measures.
Relationship between attributions of obesity and stated policy support (SEM model)
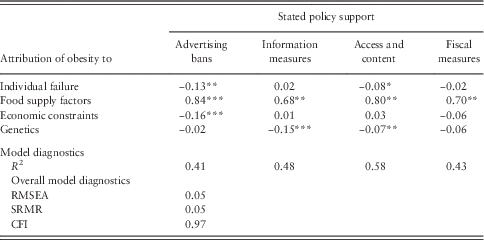
***Significant at the 99% confidence level; **95% c.l.; *90% c.l.
From support to WTP for healthy eating policies
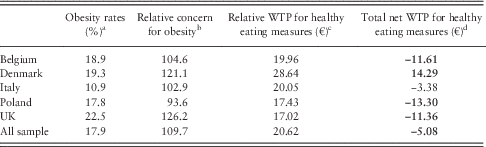
Finally, we checked whether stated support translates into WTP higher taxes to fund the policies. A first descriptive exploration (Table 6) shows that Denmark stands out as willing to allocate the highest share of the hypothesised $150 tax increase to healthy eating policies, about €29 compared with €20 or less in other countries. Second, respondents were asked how much extra tax they would be willing to pay, or would need to be given, in order to accept five healthy eating policies. Denmark is again the only country to return a positive and significant value of average WTP to support the five selected healthy eating policies (about €14). In Italy the figure is not statistically significant, all other countries reported negative significant average values between €11 and €13, which indicates a preference for tax reduction and less funding.
Obesity and WTP for healthy eating policy
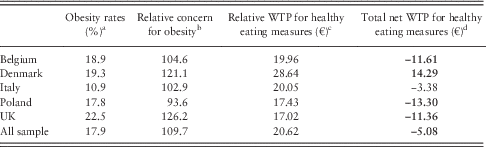
WTP=willingness-to-pay. Values are significant at the 95% confidence level.
a Computed from self-reported weight and height in the survey.
b Computed as the ratio between perceived societal risk (PSR) from obesity relative to PSR from cancer, AIDS, heart disease, diabetes, smoking, heavy drinking, depression and influenza. A value of 100 means that PSR from obesity equals the average PSR risk from other risk factors, while values larger than 100 means a higher relative PSR from obesity.
c Given a €150 increase in taxes, respondents were asked to state how they would allocate the proceedings be to healthy eating policies, other policy actions to promote health, housing, security, transportation, and the environment.
d Considering five alternative healthy eating policies (public information, education measures, price subsidies, healthy food vouchers for low-income families, and free home delivery of healthy foods to the elderly) respondents were asked first to state whether they would willing to pay more taxes, less taxes or the same amount of taxes to support these measures. Then, depending on their answer, they were asked to choose a bracket for a tax increase (cut) among five alternatives (€0–10, €10.01–20, €20.01–30, €30.01–40, €40.01–50. The values for each of the five measures were added up for each individual and averaged across respondents to provide this indirect measure of total ‘net’ WTP.
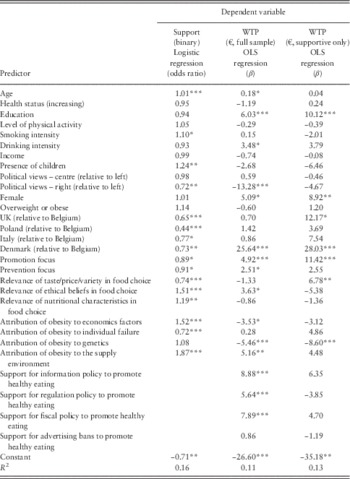
A deeper analysis of the underlying factors is reported in Table 7 and was based on a comparison between the general drivers of policy support (logistic regression model) and the influence of the same drivers on WTP, first considering the whole sample, and then only those who stated support for all of the twenty policy options. As expected, results from the overall support model resemble those of the disaggregated SEM model, although some drivers come out stronger. Considering the odds ratio in the first column, attribution of obesity to the supply environment is confirmed as the main driver of support, but ascription to economic factors (price levels, income, information) and to individual failure emerge as significant factors influencing general support. The former has a positive impact, while the latter acts negatively on support (odds ratio below 1). The other results are in line with expectations (and with the findings from the SEM model), with a higher probability of being supportive when ethical beliefs and nutrition characteristics are important in food choice; age and the presence of children increase the odds, while those who attribute more relevance to price, taste and variety in food choice are significantly less likely to be unconditionally supportive of nutrition policies. Ceteris paribus, Belgium emerges as the most supportive country, followed by Italy, Denmark, United Kingdom and Poland. Relative to the fit of the SEM model, the logistic regression has a relatively low explanatory power (the Cox-Snell R 2 is 0.16, the Nagelkerke R 2 is 0.22, the percentage of correct predictions is 68%), but these results become interesting when compared with the determinants of WTP.
Determinants of general policy support and WTP

WTP=willingness-to-pay.
***Significant at the 99% confidence level; **95% c.l.; *90% c.l.
The coefficients for the WTP equations in Table 7 can be interpreted directly in monetary terms. Considering the full sample of respondents, we find that policy support does increase average WTP by an amount ranging from €5 to €9. There are other similarities with the coefficients of support equation and with those from the SEM model. WTP increases when obesity is ascribed to the supply environment, and when credence beliefs are important in food choice, and is lower for those stating right-of-centre political views (a reduction of €13). We also find that education has a significant and positive impact on WTP, and that other attributions of obesity lose power, except attribution to genetics which is associated with a WTP which is lower by about €5. When restricting our attention to the sample of those supportive of all policies, unsurprisingly support factors become non-significant, and only a few variables remain significant. These include education level, gender (females are willing to pay an extra €9), having a promotion focus, and relevance of taste, price and variety in eating choices. The only attribution of obesity which remains significant (and negative) is the one related to genetics. Country-level effects are highly significant and relatively large for Denmark in both samples, indicating that the explanatory factors included in the model are not sufficient to capture the reasons for higher WTP.
Given that our data set does not allow a conclusive interpretation, we may only speculate on the reasons why Denmark shows a higher WTP to fund nutrition policies, together with a relatively higher support for junk food taxes (see Table 2) and a small but significant positive country effect in the SEM equation for fiscal policies. One the one hand, Danish governments have been particularly active in nutrition policies over the last few years, including the short-lived fat tax of 2012, and a trans-fat ban on all processed food products (Smed, Reference Smed2012). This may have favoured the formation of clearer opinions across respondents. As a matter of fact, Denmark has the lowest proportion of neutral respondents both for the item on fat taxes (18.9%, all other countries above 21%) and on adjusting VAT rates (11.5%, all other countries above 15%). This interpretation would be consistent with the finding in the systematic review by Diepeveen et al. (Reference Diepeveen, Ling, Suhrcke, Roland and Marteau2013) indicating that public support is associated with the stage of implementation of the policy, with increased or sustained acceptance after the introduction of interventions observed for measures like smoking or advertising bans for alcohol. A second speculative explanation is associated with the fact that Denmark is the OECD country with the highest tax rate (48.1% of GDP in 2011), indicating a high level of state intervention, which combined with relatively wealthy economic conditions might encourage higher trust in the effectiveness of public intervention.
Discussion and conclusions
This first multi-country European survey investigating public opinion on healthy eating policies and its determinants provides the ideal setting to benchmark public support. It confirms and updates several results from previous studies and facilitates the investigation of novel research hypotheses.
Some of our results help consolidate a previous set of findings in the literature. They are in line with a large body evidence from the United States (Harvard School of Public Health, 2003; Oliver and Lee, Reference Oliver and Lee2005; Barry et al., Reference Barry, Brescoll and Brownell2009) and Europe (Hilbert et al., Reference Hilbert, Rief and Braehler2007; Sikorski et al., Reference Sikorski, Luppa, Schomerus, Werner, Konig and Riedel-Heller2012; Emm et al., Reference Emm, Gillison and Juszczyk2013) showing a public preference for measures explicitly targeting children, and – on average – relatively lower support for more intrusive actions like bans or taxation. Our results also conform with those from the PorGrow study on stakeholders (Millstone and Lobstein, Reference Millstone and Lobstein2007), which found that (i) acceptance of nutrition labelling and education measures is substantially stronger than of reformulation and taxation, and (ii) stakeholder views are particularly heterogeneous in relation to some of the policy options, especially for advertising restrictions, price subsidies and labelling, with sceptical food chain operators, but supportive public interest non-governmental organisations (NGOs) and public health experts. From that perspective, the match between our policy ranking and those for NGOs in PorGrow is relatively high, although we find a less pronounced opposition to fiscal measures.
Since stated acceptance may be inflated by social desirability biases, our analysis relies on a thorough multivariate analysis to explore heterogeneity across respondents, considering their socio-demographic and economic background, but also their behavioural and attitudinal profiles. Among the latter, attribution of obesity to external factors – and more specifically the excessive market availability of nutritionally inadequate foods – stands out as the main determinant of support, regardless of the type of measure.
Our analysis leads to the identification of four groups of policies (advertising restrictions, information measures, regulation of access and content, fiscal measures) and four categories of perceived obesity causes (behavioural failure, food supply, economic constraints, genetics). In terms of generic support we confirm the findings of Oliver and Lee (Reference Oliver and Lee2005), Barry et al. (Reference Barry, Brescoll and Brownell2009), Hilbert et al. (Reference Hilbert, Rief and Braehler2007), Sikorski et al. (Reference Sikorski, Luppa, Schomerus, Werner, Konig and Riedel-Heller2012) that attribution to external factors (food supply sector or economic constraints) increases support, while ascription to individual failure and, especially, genetic causes decrease it. External factors, however, seem to have a differentiated impact when the analysis is disaggregated by policy type. Attribution of obesity to the food supply environment increases support for all policy types, whereas acceptance is lower for advertising bans and access/content measures when the blame is placed on economic factors. These relationships are weak, however, and they disappear when a larger set of covariates is included.
Based on the most general model, we also identify other important attitudinal and behavioural drivers, with differentiated roles: the influence of beliefs governing food choice and the attitude towards health risks. Other covariates which have been previously related to support, like demographic characteristics, income or political views, return signs that are consistent with previous research, but we highlight their low relevance relative to attitudinal and behavioural factors, a result which conforms with those from the stepwise regression in Hilbert et al. (Reference Hilbert, Rief and Braehler2007) or the hierarchical regression in Emm et al. (Reference Emm, Gillison and Juszczyk2013).
This finding should not be understated, as it indicates that public support in this domain cannot be traced back to a socio-demographic segmentation, and that ideological and political background matters to a very small extent. A US qualitative study by Barry et al. (Reference Barry, Niederdeppe and Gollust2013) investigating differences between liberal and conservative respondents reached similar conclusions, and showed that attributions of obesity are generally disjointed from political views, although some heterogeneity remains with regard to proposed policy solutions. The same study suggests that public communication about policy interventions should focus on the external causes of obesity and solutions, while acknowledging the freedom of individual decision making. Whether this recommendation can be transferred to the EU setting remains an open question, but our results confirm that individual beliefs are a key driver – not only those relating to the external causes of obesity, but also more general attitudes towards health risks and eating choices.
Another original contribution of this study lies in the exploration of the link between stated support and WTP higher taxes to fund and improve policies. Our evidence shows that the relationship between support and WTP is weak and the considered set of explanatory factors is less than satisfactory in explaining heterogeneity among respondents. Results show a positive correlation between WTP, level of education, and left-of-centre political views. But we also find that the importance of the role of attributions of obesity in driving stated support does not extend to WTP, with the exception of attribution to genetic factors which, as expected, reduces WTP to fund interventions. The negative (but weak) link between attribution to economic factors (prices and income) and WTP is also consistent with expectations. Findings for WTP are similar to those in Cawley (Reference Cawley2008) where the focus was on policies for childhood obesity, but in contrast to that study we do not find any evidence of a relationship between income and WTP.
The analysis here throws up further research questions which have not been addressed in this or other studies. First, given that nutrition policies are relatively young in Europe, there is incomplete evidence on the association between the stage of implementation and the evolution in public support, which has been investigated in other countries and for other policies (Diepeveen et al., Reference Diepeveen, Ling, Suhrcke, Roland and Marteau2013). Second, the loose link between stated support and WTP demonstrated in our study should be further investigated, as – despite the wide set of covariates used in our study – the explanatory power of our WTP models is relatively low. Among those drivers not explored in our study, institutional trust, objective knowledge, familiarity, perceived effectiveness and fairness of interventions are examples of variables which deserve further attention (Bos et al., Reference Bos, Van der Lans, Van Rijnsoever and Van Trijp2013). Third, even among experts, judgements on the cost-effectiveness of the various interventions are mixed (Millstone and Lobstein, Reference Millstone and Lobstein2007), but the body of evidence is growing rapidly. How this uncertainty and any novel evidence are communicated to the public may have a strong influence on acceptance of interventions, and the mechanisms governing public and private provision of information, as well as its processing, are worth investigating.
Acknowledgements
The research leading to these results received funding from the European Union Seventh Framework Programme (FP7/2007–2013) under Grant Agreement no. 226713, Eatwell Project.
Ethical Standards
Ethical clearance was obtained from the project lead institution’s (University of Reading) ethics board.
Contributors
W.B.T. and M.M. conceived the study, all authors contributed to study design survey development, questionnaire translation and back-translation and took part in interpretation of findings. MM co-ordinated the study design, survey and data analysis, and took primary responsibility for writing and revising the manuscript. B.S., W.B.T. and W.V. commented on the first draft and contributed to its finalisation. M.M. and W.B.T. coordinated the questionnaire development process and the implementation of the field work by GFK NOP. S.C. and M.M. planned and carried out the statistical analysis.
Conflicts of Interest
None.