

INTRODUCTION
Delirium is a complex neuropsychiatric syndrome that is common across healthcare settings and associated with a variety of adverse outcomes (Breitbart & Alici, Reference Breitbart and Alici2012; Ryan et al., Reference Ryan, O'Regan and Caoimh2013). Although historically understudied, the past decade has witnessed increasing interest in the detection and treatment of this important condition (Meagher et al., Reference Meagher, McLoughlin and Leonard2013). The phenomenological assessment of delirium, including its severity, has become increasingly important, as studies exploring a variety of pharmacological and nonpharmacological treatments have increased.
In a review of prospective studies of the treatment of delirium, Meagher et al. (Reference Meagher, McLoughlin and Leonard2013) found that, though the original DRS was the most commonly used instrument overall, for recent studies the Revised Delirium Rating Scale (DRS–R98) and Memorial Delirium Assessment Scale (MDAS) were the instruments most commonly utilized to measure treatment response. Although evidence indicates a high correlation between the MDAS and the original DRS (r = 0.88) (Breitbart et al., Reference Breitbart, Rosenfeld and Roth1997), direct comparisons of the MDAS and DRS–R98 scales are lacking. Unlike the confusion assessment method (CAM), both measure the severity of a broad range of symptoms. Additionally, because some studies employ the MDAS and others the DRS–R98, having a conversion system to apply to scores could be useful to allow for more direct comparison of study results, including the magnitude of treatment effects. In clinical settings, the MDAS might be used by less well-trained clinical staff due to its ease of use and simpler format while specialists might use the DRS–R98. An accurate and validated conversion algorithm could allow more continuity over time for patients rated with both scales. Although these scales were originally designed for broad usage, they have been validated and often used in particular settings; for instance, the MDAS was initially derived and validated for hospitalized patients with cancer and AIDS but often has been used for palliative care patients. The DRS–R98 was initially validated for inpatients with medical/surgical conditions and psychiatric patients but later validated in nursing homes, for patients with stroke, and in orthopedic rehabilitation units, and is often utilized in geriatrics wards and for consultation-liaison psychiatry (Adamis et al., Reference Adamis, Sharma and Whelan2010). As such, a comparison of their performance in a single population (e.g., palliative care) could explore their level of agreement within a particular clinical setting. Therefore, the aims of our study were as follows:
-
1. to compare DRS–R98 and MDAS agreement in assessment of delirium in a population of 77 palliative care patients with delirium,
-
2. to investigate the level of agreement between the scales considering separately common and unique items,
-
3. to derive a conversion formula between the two scales and test it by using the second assessment of 76/77 patients.
METHODS
Subjects and Design
This observational longitudinal study of delirium symptoms and cognitive performance evaluated 77 consecutive patients with DSM–IV delirium. Patients were referred to the psychiatric consultation-liaison service's delirium research team at a palliative care inpatient service at Milford Care Hospice. All patients were routinely assessed daily for altered mental states, and where any indication of possible delirium was evident also formally screened with the confusion assessment method algorithm (CAM) by a medical team trained in its use to supplement routine case finding for delirium. Patients with CAM-positive status or other altered mental states were referred to the psychiatry team for further evaluation and expert diagnosis of delirium using DSM–IV criteria. In order to optimize the real-world nature of the study, both incident and prevalent cases of delirium were included. Patients were not included if they were imminently dying or where circumstances were too difficult to allow assessment (as per the opinion of the treating medical team).
Procedures
The current report derives from data that formed part of a previous report of longitudinal symptom patterns over the course of an episode of delirium that involved biweekly assessments (Meagher et al., Reference Meagher, Leonard and Donnelly2011). For the purpose of the present study, we investigated the relationship between the MDAS and DRS–R98 at first assessment (n = 77), and then employed MDAS and DRS–R98 data from the second assessment (three days later) to test a conversion formula derived from analyses of the first assessment data.
Assessments were conducted by research psychiatrists trained in the use of the DRS–R98 and MDAS (DM or ML), and, to further enhance reliability, difficult ratings were discussed and rated by consensus between both raters.
Scales
Revised Delirium Rating Scale (DRS–R98)
The DRS–R98 is the instrument most widely employed to measure symptom severity in delirium and is useful as both a diagnostic and a severity assessment tool (Trzepacz et al., Reference Trzepacz, Maldonado and Kean2010). It is a 16-item clinician-rated scale with 13 severity items and 3 diagnostic items (temporal onset of symptoms, fluctuation of symptoms, physical disorder) and is a valid measure of delirium severity over a broad range of symptoms. The 13-item severity section can be scored separately from the 3-item diagnostic section; their sum constitutes the total scale score. The severity of individual items is rated from 0 to 3 points. Thus, DRS–R98 severity scale scores range from 0 to 39, with higher scores indicating more severe delirium and a cutoff score above 15 consistent with a diagnosis of delirium. Total scale scores range from 0 to 46, with a score greater than 18 consistent with a delirium diagnosis. All items are anchored by text descriptions of phenomenology as guides for rating along a continuum from normal to severely impaired. The instrument can be employed to rate symptoms over variable periods from hours to weeks, and for the purposes of our study was applied twice weekly to encompass the previous 3–4 day period (i.e., since last assessment). It has high interrater reliability, validity, sensitivity, and specificity in distinguishing delirium from mixed neuropsychiatric populations, including dementia, depression, and schizophrenia (Trzepacz et al., Reference Trzepacz, Mittal and Torres2001). Completion time is 15–20 minutes.
Memorial Delirium Assessment Scale (MDAS)
The Memorial Delirium Assessment Scale (MDAS) is a 10-item, clinician-rated scale (possible range 0–30) designed to quantify both the severity of delirium and the presence/absence of delirium when cutoff points are applied. Each item is rated on a Likert-type scale (0–3: absent–mild–moderate–severe). Items included in the MDAS reflect the diagnostic criteria for delirium in the DSM–IV, as well as symptoms of delirium from earlier or alternative classification systems (e.g., DSM–III, DSM–III–R, ICD-9). It consists of a combination of cognitive and neuropsychiatric items and is suited for both quantification of delirium severity and screening or diagnosis, although, regarding the latter, a range of possible diagnostic cutoff scores has been suggested varying from 7 to 13 across cancer, palliative care, elderly orthopedic, and cardiac surgery populations (Breitbart et al., Reference Breitbart, Rosenfeld and Roth1997; Marcantonio et al., Reference Marcantonio, Ta and Duthie2002; Kazmierski et al., Reference Kazmierski, Kowman and Banach2008). Completion time is approximately 10 minutes.
For the purposes of our study, DRS–R98 ratings were conducted prior to the MDAS to minimize cross-contamination of assessments. Attention (item 10) on the DRS–R98 was assessed according to performance on the months-backward test, with scores of 0 (no problems), 1 (able to recite the months at least as far as July but with some difficulty), 2 (failure to reach at least July), and 3 (difficulties with the basic sequencing of the test and/or unable to engage coherently with the test). For MDAS attention (item 5), a reduced ability to maintain and shift attention was assessed according to general behavior and performance during the assessment.
Preexisting Cognitive Impairment/Dementia
Dementia due to various causes was defined as the presence of persistent cognitive impairment for at least six months prior to assessment and per DSM–IV criteria based on all available information at the time of initial assessment, including clinical case notes and collateral history from family and/or carers.
Ethics
The procedures and rationale for the study were explained to all patients, but because the majority had an index episode of delirium at entry, it was recognized that most would not be capable of giving informed consent. Because of the noninvasive nature of the study, the Limerick Regional Ethics Committee approved verbal patient assent augmented by proxy consent from next of kin (where possible) or a responsible caregiver. This is in accordance with best practices as outlined in the Helsinki Guidelines for Medical Research Involving Human Subjects (World Medical Association, 2014).
Statistical Analyses
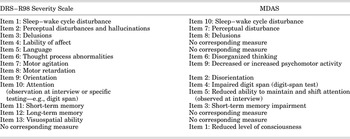
Statistical analyses were conducted using the PAWS (SPSS v. 19) and the [R]Psych packages (Revelle (Reference Revelle2013). Overall agreement between the two scales was assessed using Pearson's product-moment correlation coefficient. However, this estimation has been criticized by Bland and Altman (Reference Bland and Altman1986) as misleading, so the concordance correlation coefficient (CCC) was also calculated. The CCC was introduced by Lin (Reference Lin1989) and measures agreement by assessing how well the relationship between measurements is represented by a line through the origin at an angle of 45° (as would be generated if the two measurements generated identical results). The two scales have seven common items that measure symptoms of delirium but in somewhat different ways (see Table 1).
Comparison of items from the DRS–R98 and MDAS

Since neither of these scales can be considered a gold standard, we examined the agreement of common items. Agreement of these items was assessed using polychoric correlations (Olsson, Reference Olsson1979). For both scales, each item is rated from 0 to 3 in ordinal terms, but with an assumed continuous underlying latent variable (severity), which is measured by the four points. Similarly, for reasons of comparison, we calculated Cohen's kappa coefficient, which is a more conservative measure of agreement. Given that in each item there are four categories, we utilized squared weighted kappa (where disagreements are weighted according to their squared distance from perfect agreement) (Cohen, Reference Cohen1968; Fleiss et al., Reference Fleiss, Cohen and Everitt1969).
The concordance (concurred validity) of each of the seven common items was also estimated. Concordance reflects the interchangeability of two scales, where if two items are concordant they will produce the same ordering of individuals. Goodman–Kruskal's gamma (γ) is a measure based on the difference between the numbers of concordant and discordant pairs adjusted for ties on the marginal distribution (Goodman & Kruskal, Reference Goodman and Kruskal1963). The value of γ can vary between −1 and 1, where a value of 1 indicates perfect concordance and 0 a total absence of concordance Svensson (Reference Svensson2000).
To derive a rule for conversion of MDAS to DRS–R98 (and vice versa), we generated an equation to link the two scales. Conversions were extracted from the first assessment and then tested in the second data assessment. The conversion rule is derived according to the following equation (Kolen & Tong, Reference Kolen, Tong, Everitt and Howell2005):
 $$l\gamma \lpar x\rpar = \sigma \lpar Y\rpar \left[{\displaystyle{{x - \mu \lpar X\rpar } \over {\sigma {\rm \lpar X\rpar }}}} \right]+ \mu \lpar Y\rpar ,$$
where μ(X) is the mean score of the referred variable (in this case, MDAS), σ(X) the standard deviation of MDAS scores, μ(Y) the mean DRS–R98 score, σ(Y) the standard deviation of DRS–R98 scores, and lγ the linear equating function.
In doing this, we have made the following assumptions: (1) both scales measure the same latent construct (in this case, delirium); (2) the two scales are not free from error, but the errors are small (both scales must have high reliability); and (3) the ratings have been conducted by experts and the conversion rule will apply again in measurements that have been done by experts. Although both scales are continuous, they are discretized continuous, meaning that the score of person A on the DRS–R98 (or MDAS) will be 11 and never 11.2, so that the delivered MDAS score needs to be converted to the nearest integer (and vice versa). However, this may not be necessary for statistical use and calculations.
RESULTS
Descriptive Statistics of the Studied Sample
Consecutive patients with DSM–IV delirium (n = 77) were assessed with both scales (MDAS and DRS–R98). The mean age was 70.1 ± 11.1 (range 36–90 years). Some 40 participants (52%) were male, and 21 (27%) had a history of longstanding cognitive impairment/dementia. At first assessment, the mean MDAS score was 13.3 ± 5.1 (range 3–26), and the mean DRS–R98 severity scale score was 16.7 ± 6.1 (range 5–36).
Overall Agreement of the Two Scales
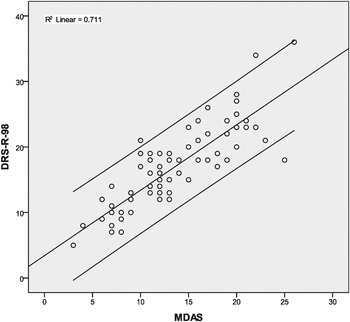
The Pearson's product-moment correlation coefficient for the MDAS and DRS–R98 was 0.84 (p < 0.001). Figure 1 depicts a scatterplot including a fitted linear line with a 95% confidence interval (CI 95). The CCC was 0.70 (95% CI 95 = 0.60–0.78), indicating substantial agreement between the two scales.
Linear relationship between MDAS and DRS–R98 and the 95% confidence interval.

Further, we compared the agreement between the two scales separately in those with dementia (n = 21) and in those without cognitive problems (n = 56). In those with dementia (r = 0.88) the CCC was 0.65 (CI 95 = 0.44–0.80). Thus, the agreement remained substantial though the CIs were wider, which reflects the relatively smaller sample size. For those without dementia, the agreement between the scales was substantial, with r = 0.84, CCC = 0.71 (CI 95 = 0.59–0.81).
Agreement and Concordance Between Common DRS–R98 and MDAS Items
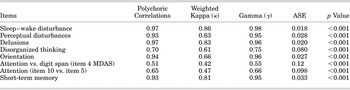
The agreement between items (polychoric correlation, weighted κ) and their concordance (γ) are presented in Table 2. Also, the asymptotic standard error (ASE) is given in the table as a measure of precision. As can be seen from Table 2, agreement between items was high, with the exception of those that measure disorganized thinking and attention, where agreement was somewhat lower but still fair, and in all cases highly statistically significant (p < 0.001).
Agreement between MDAS and DRS–R98 on common items

Conversion Rules
Conversion Rule from Total MDAS Score to DRS–R98 Severity Scores
After estimation of means and SD and calculations according to the above-reported equation, the following conversion rule emerged:
 $${\hbox{DRS} \! - \!\hbox{R}98 \, \, \hbox{severity}\, \, \hbox{score} = \lpar 1.184 \times \hbox{MDAS} \, \, \hbox{score}\rpar + 0.948}$$
Using this rule, we converted total MDAS scores to DRS–R98 severity scores and then tested these against the actual DRS–R98 severity scores in the second wave of assessments. At second assessment, 76 subjects had ratings with both scales bereft of missing values. The actual DRS–R98 severity scores had these characteristics: mean = 16.3 ± 6.7, SE of the mean = 0.77, variance = 44.8, range 4–33. For the DRS–R98 severity scores converted from MDAS using the formula: mean = 16.4 ± 7.0, SE of the mean = 0.80, variance = 49.1, range 1–35.
Thus, agreement between the two scales was very high and without any significant differences between the original rated DRS–R98 and the derived version: r = 0.86, CCC = 0.86 (CI 95 = 0.79–0.91), indicating an almost perfect level of agreement. Therefore, we concluded that the conversion rule is effective.
Conversion Rule from DRS–R98 to MDAS
Using the same approach as above, a conversion rule from DRS–R98 to MDAS was generated (the inverse function of the equation above):
 $$\eqalign{{\rm Total} \, \, {\rm MDAS} \, \, {\rm score} & = \lpar 0.845 \times {\rm DRS} - {\rm R}98\, \, {\rm severity}\, \, {\rm score}\rpar \cr & \quad - 0.808.}$$
Similarly, the DRS–R98-derived MDAS from the second assessment wave was compared with the actual MDAS scores. The descriptive statistics for the actual MDAS scale (n = 76) were: mean = 13.1 ± 5.9, SE= 0.68, variance = 34.9, range 0–30; and the statistics for the derived MDAS scores: mean = 12.9 ± 5.6, SE = 0.65, variance = 31.99, range 3–27. Again, there were no significant differences between the statistics of the actual MDAS and the DRS–R98-derived version. Estimations for agreement of the MDAS and converted MDAS were as follows: r = 0.86, CCC = 0.86 (CI 95 = 0.79–0.91). Thus, the agreement was very high, indicating that the conversion rule from DRS–R98 to MDAS also worked well.
DISCUSSION
A variety of scales for delirium screening, diagnosis, and severity exist, of which a small number are considered validated and sufficiently robust for use in clinical and research settings (Adamis et al., Reference Adamis, Sharma and Whelan2010). Consensus on which is the best scale is lacking and may vary according to the setting in which they are employed (Adamis et al., Reference Adamis, Sharma and Whelan2010). The availability and use of a variety of scales in delirium research complicates efforts to directly compare studies. In the case of drug treatment studies, for example, six different scales have been employed to assess primary outcome, of which the MDAS and DRS–R98 are the most commonly applied in recent studies (Meagher et al., Reference Meagher, McLoughlin and Leonard2013). In our study, we generated and tested a rule for convenient and rapid conversion between DRS–R98 and MDAS scores that applies to patients both with and without comorbid dementia.
We demonstrated a high correlation between the overall severity scores of the MDAS and DRS–R98 in a population of palliative care patients. Agreement between overall scores in cognitively impaired and cognitively intact subgroups was also substantial. There are a number of differences between the two scales both in terms of the individual symptoms included and assessment methods. The eight common items showed high levels of agreement when assessed individually; however, two items had somewhat lower levels of agreement. First, thought process abnormalities/disorganized thinking had a modest level of agreement. The criteria for scoring these two items differ in that the MDAS allows a general observation of degree of disorganized thinking and how this impacts on the interview, whereas the DRS–R98 more specifically assesses the character of abnormalities in thinking. Similarly, for assessment of attention, the DRS–R98 combines the interviewer's observations of performance on the months of the year backward (Trzepacz et al., Reference Trzepacz, Maldonado and Kean2010), while the MDAS includes two items—the interviewer's assessment and observation of the patient's behavior during the interview—and a separate item that specifically uses performance on the digit-span test. These methodological differences may explain why the agreement levels for these items was somewhat lower than for other items, but also highlights how these tests focus on different elements of attention and how these (subtle) differences can impact assessment of patients with delirium.
We have generated conversion rules from MDAS to DRS–R98 scores and vice versa. The rules were derived from initial assessments of a palliative care population and were then tested on data from the second assessment of these same patients three days later (Meagher et al., Reference Meagher, Leonard and Donnelly2011). The generated scores were not significantly different from the actual scores. The consistency of assessment methods and raters almost certainly contributed to the high level of agreement, and, this being said, further studies in other populations are needed, but this initial study suggests a promising level of accuracy that can facilitate comparisons of studies using different methods of assessing delirium.
Diagnostic cutoff scores for delirium diagnosis using the DRS–R98 and MDAS have been identified that vary according to the population studied (Breitbart et al., Reference Breitbart, Rosenfeld and Roth1997; Trzepacz et al., Reference Trzepacz, Mittal and Torres2001; Kazmierski et al., Reference Kazmierski, Kowman and Banach2008; Shyamsundar et al., Reference Shyamsundar, Raghuthaman and Rajkumar2009). In our study, we have not attempted to identify any particular cutoffs. Some previous studies related to a conversion rule suggested that, where high diagnostic sensitivity was required, cutoff scores of 12 and 9 could apply for the DRS–R98 and MDAS, respectively, while for greater specificity, scores of 15 and 12 could be applied (Trzepacz et al., Reference Trzepacz, Maldonado and Kean2010).
Future work can explore the value of identifying specific ranges that equate with mild versus severe delirium, including their relevance to predicting treatment responsiveness and overall prognosis. While these scales can capture the phenomenological intensity of delirium, evidence that the hypoactive subtype of delirium is associated with a poorer prognosis (and possibly lower treatment response), despite relatively lower scores for severity on these scales, highlight the possible mismatch between phenomenological intensity and prognostic severity (Kiely et al., Reference Kiely, Jones and Bergmann2007; Kobayashi et al., Reference Kobayashi, Takeuchi and Suzuki1992; Liptzin & Levkoff, Reference Liptzin and Levkoff1992; Meagher et al., Reference Meagher, Moran and Raju2008; Olofsson et al., Reference Olofsson, Weitzner and Valentine1996; Meagher et al., Reference Meagher, Leonard and Donnelly2011).
Similarly, the issue of relative weighting of various delirium symptoms/scale items also warrants consideration. Both the MDAS and DRS–R98 allow for detailed and systematic assessment of the broad phenomenological profile of delirium, but both weight all items equally (on a scale from 0 to 3). Where the principal requirement is for accurate diagnosis of delirium, it may be more prudent to focus on symptoms that are especially diagnostically important, such as inattention and disorganized thinking, which reflect two of the three core domains of delirium (Mattoo et al., Reference Mattoo, Grover and Chakravarty2012; Franco et al., Reference Franco, Trzepacz and Meagher2012). To this end, inclusion of two items that rate inattention may be a relative advantage of the MDAS, but, interestingly, the diagnostic cutoff scores for the DRS–R98 are much more consistently identified. Where the principal aim is to predict prognosis, it may be better to emphasize features that are more closely linked to outcome, such as motor profile combined with such other parameters as comorbid dementia and/or presence of organ failure as a cause of delirium (Leonard et al., Reference Leonard, Raju and Conroy2008). It may be the case that different scales may be better for assessment of the different clinical (motor) subtypes of delirium and/or that a scale which provides better coverage of relatively hypoactive features of delirium needs to be developed.
LIMITATIONS
In the evaluation data (second assessment), the ratings were provided by professionals with the same expertise, and the errors were perhaps minimal and in the same direction. This conceivably influenced the high agreement between the actual scale and the converted one. It is essential that this conversion rule apply to other areas of expertise as well. This needs to be tested with different data and possibly from different settings to generalize the conversion rule. Ideally, a new prospective study will be designed for this purpose. Our present study is a first attempt at finding a rule that can convert different delirium rating scales, and the data we obtained indicate that our results are most promising.