Implications
Chicory forage is a fibre source high in pectin and chicory root is a fibre source high in inulin and fructo-oligosaccharides. Because of their specific fibre composition, they modulate the gut microbiota differently with indications of synergistic effects when combined in the diet. The high digestibility of the fibre fraction in both chicory forage and chicory root compared with cereal fibre suggests that there is potential for both to be used as regular feed ingredients in pig diets. High inclusion levels can be applied to pigs without any major depression in digestibility of energy.
Introduction
Inclusion of fibre-rich feedstuffs in pig feed decreases the digestion in the foregut, increases the microbial fermentation in the hindgut and decreases the net energy content in the diet (Anguita et al., Reference Anguita, Canibe, Perez and Jensen2006). However, to maintain normal gut function, a minimum level of fibre has to be included in the diet (Wenk, Reference Wenk2001) and inclusion of dietary fibre can be a strategy to change the structure of the gut microbial communities (Castillo et al., Reference Castillo, Skene, Roca, Anguita, Badiola, Duncan, Flint and Martin-Orue2007). The microbial ecosystem in the gastrointestinal (GI) tract is characterized by a high population density, wide diversity and complexity of host–microbe and microbe–microbe interactions (Zoetendal et al., Reference Zoetendal, Collier, Koike, Mackie and Gaskins2004). However, the knowledge about the gut microbial diversity is still far from complete and the use of molecular techniques has revealed that many of the pig gut microbial communities have not previously been cultured (Leser et al., Reference Leser, Amenuvor, Jensen, Lindecrona, Boye and Mller2002; Castillo et al., Reference Castillo, Skene, Roca, Anguita, Badiola, Duncan, Flint and Martin-Orue2007; Patterson et al., Reference Patterson, Yasuda, Welch, Miller and Lei2010).
The coefficient of total tract apparent digestibility (CTTAD) of dietary fibre ranges from about zero for water-insoluble dietary fibres rich in lignin to 0.80 to 0.90 for water-soluble dietary fibres such as pectin, and consequently the energy and nutrient utilization of dietary fibre is highly dependent on the fibre source (Noblet and Le Goff, Reference Noblet and Le Goff2001). Moreover, the effect on the microbiota varies with fibre source. Metzler et al. (Reference Metzler, Vahjen, Baumgartel, Rodehutscord and Mosenthin2009) showed that changes in supply of dietary carbohydrates affect the bacterial species composition rather than the number of total bacteria. Insoluble non-starch polysaccharide (NSP) decreases the richness of the ecosystem and promotes a much more homogeneous community, whereas soluble NSP leads to higher diversity and a more stable ecosystem (Högberg et al., Reference Högberg, Lindberg, Leser and Wallgren2004; Konstantinov et al., Reference Konstantinov, Favier, Zhu, Williams, Kluss, Souffrant, Vos, Akkermans and Smidt2004). Recent studies (Wang et al., Reference Wang, Zhu, Li, Wang and Jensen2004; Wellock et al., Reference Wellock, Fortomaris, Houdijk, Wiseman and Kyriazakis2008) in pigs have shown that addition of soluble NSP increases the lactobacilli : coliform ratio, but addition of insoluble NSP does not affect this ratio (Schedle et al., Reference Schedle, Plitzner, Ettle, Zhao, Domig and Windisch2008). Chicory (Cichorium intybus L.) is a perennial herb with deep roots, high mineral content and high drought resistance that can be complementary to traditional forage crops (Foster, Reference Foster1988). The chicory forage has a high content (150 g/kg dry matter, DM) of uronic acids, which in dicotyledonous plants are derived from galactouronic acid, and are the building blocks of pectin (Voragen et al., Reference Voragen, Beldman and Schols2001). Recent studies in weaned pigs have shown a high growth performance and a high NSP digestibility, with only minor negative impact on total tract nutrient and energy digestibility on cereal-based diets with up to 160 g/kg chicory forage inclusion (Ivarsson et al., Reference Ivarsson, Frankow-Lindberg, Andersson and Lindberg2011). No studies on the effects of chicory forage on the pig microbiota have yet been reported. An in vitro study using ruminal fibrolytic bacteria has shown that chicory forage is efficiently degraded by the pectinolytic bacteria Lachnospira multiparus and Fibrobacter succinogenes (Sun et al., Reference Sun, Joblin, Andrew, Hoskin and Harris2008). The chicory root has a high content of inulin and fructo-oligosaccharides. Inulin consists of a mixture of fructan chains (Flickinger et al., Reference Flickinger, Van Loo and Fahey2003) and is one of the most studied prebiotic sources in domestic animals (Castellini et al., Reference Castellini, Cardinali, Rebollar, Bosco, Jimeno and Cossu2007). In humans and rodents, inulin selectively stimulates lactobacilli and bifidobacteria in the large intestine (LI; Gibson et al., Reference Gibson, Probert, Loo, Rastall and Roberfroid2004), whereas the effect on the microbiota in pigs is less clear and varies between studies (Verdonk et al., Reference Verdonk, Shim, van Leeuwen and Verstegen2005). A recent study in weaning piglets has shown that inulin in combination with benzoic acid increased the bacterial diversity in digesta, whereas inulin alone decreased the relative abundance of Lactobacillus acidophilus and tended to increase the relative abundance of Megasphaera elsdenii (Halas et al., Reference Halas, Hansen, Hampson, Mullan, Kim, Wilson and Pluske2010).
The aim of this study was to increase the knowledge about chicory as a fibre source in pig nutrition to be able to evaluate its usefulness as a feed ingredient. The effect of feeding growing pigs with different inclusion levels of chicory forage and/or root on the digestive organ size, digestibility and faecal microbiota was examined. In addition, individual growth rates and feed intakes were recorded. We hypothesized that chicory inclusion will increase digestive organ size, have minor negative effect on digestibility and increase the faecal microbial diversity and the lactobacilli : coliform ratio.
Material and methods
Animals and housing
A total of 30 7-week-old Yorkshire pigs (16 castrated males and 14 females) were used in an 18-day experiment. The pigs originated from six different litters and had an initial body weight of 15.5 kg (s.e. 1.61 kg). The pigs were housed individually in pens equipped with a rubber mat and had no access to straw during the experiment. The room temperature was maintained at 20 ± 1°C. In addition, each pen had a heat lamp to increase the pigs’ comfort during the 1st week of the experiment. Pigs had ad libitum access to feed and water throughout the experiment. They were weighed on days 0, 7, 14 and 18 and the feed intake was registered daily.
The experiment was carried out at the Swedish University of Agricultural Sciences in Uppsala and was approved by the ethics committee of the Uppsala region.
Diets and experimental design
The experiment was organized as a split-litter design, five piglets per litter from six different litters were selected and the piglets from the same litter were randomly allocated to one of the diets. The piglets within each litter were selected on the basis of live weight to get as low within-litter variation as possible, whereas sex was randomized across diets.
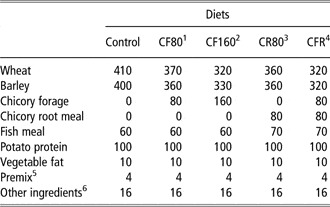
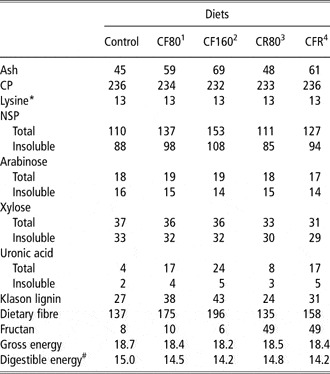
A total of five diets were formulated (Table 1): one cereal-based (wheat, barley) control diet (C) and two diets composed to contain 80 or 160 g/kg chicory forage meal (CF80, CF160), two diets composed to contain 80 g/kg of chicory root meal (Inu60 Inter-Harz GmbH, Germany; CR80) or a mix of 80 g/kg chicory forage and 80 g/kg chicory root meal (CFR). The diets were supplemented with protein, amino acids, minerals and vitamins to meet minimum nutritional requirements of piglets according to National Research Council (NRC, 1998). The analysed chemical composition of the diets is shown in Table 2. All ingredients were milled through a 3.5-mm screen before they were mixed. In diets with chicory forage and root meal inclusion, the cereal mixture was substituted on an air-dry basis. Chicory forage was made from vegetative shoots of chicory and was a mix (50 : 50) from two harvests, June and September 2007, which were pooled to a composite batch. At both time points, the chicory was harvested with a stubble height of ∼5 cm and dried for 1 week at low temperature (30°C) with forced air. TiO2 was included in the diets (2.5 g/kg) as an internal digestibility marker.
Ingredient composition (g/kg) of the experimental diets

1CF80, 80 g/kg chicory forage.
2CF160, 160 g/kg chicory forage.
3CR80, 80 g/kg chicory root meal (Inu60, Inter-Harz Gmb, Germany).
4CFR, mix of 80 g/kg chicory forage and root meal.
5Concentration per kg premix: minerals: Ca 3.77 g, P 1.02 g, Mg 3.10 g, K 1.50 g, Na 0.37 g, Cl 0.11 g, S 84.00 g, Fe 120 493 mg, Cu 29 791 mg, Co 52.62 mg, Mn 24 076 mg, Zn (as ZnO4) 134 mg, I 238 mg, Se 476 mg; vitamins: retinol 5 952 000 IE, cholecalciferol 595 200 IE, α-tocopherol 101 190 mg, thiamin 2381 mg, riboflavin 5952 mg, pyroxidine 3750 mg, B12 24 mg, pantothenic acid 11 914 mg, nicotinic acid 23 810 mg, biotin 2238 mg.
6Concentration g/kg other ingredients: NaCl 2.5, l-lysine-HCL 0.5, dl-methionine 0.5, monocalciumphosphate 5, limestone 5, TiO2 2.5.
Analysed chemical composition (g/kg DM) and gross energy content (MJ/kg DM) of the control and experimental diets

DM = dry matter; NSP = non-starch polysaccharide.
1CF80, 80 g/kg chicory forage.
2CF160, 160 g/kg chicory forage.
3CR80, 80 g/kg chicory root meal (Inu60, Inter-Harz Gmb, Germany).
4CFR, mix of 80 g/kg chicory forage and root meal.
*Calculated values.
Digestible energy = Gross energy × Coeffiecient of total tract digestibilityenergy.
Sample collection
Faecal samples for determination of digestibility were collected once a day for 4 subsequent days from the carefully cleaned pen floor during days 15 to 18, and stored at −20°C. Feed samples were collected weekly. Additional fresh faecal samples for bacterial enumeration and determination of faecal pH were collected directly after defecation, from each pig at days 6, 13 and 17, and were immediately put on ice and transported to the laboratory for analysis. Samples for terminal restriction fragment length polymorphism (T-RFLP) analysis were collected at days 0 and 17, and stored at −80°C. At day 18, the pigs were sedated by a mix of Domitor (medetomidin HCl 1 mg/ml; Orion Pharma, Espoo, Finland) and Zoletil (tiletamin 25 mg/ml and zolazepam 25 mg/ml, Vibrac S.A., Carros, France) at a dose of 0.05 ml/kg BW and killed by a lethal dose of Pentobarbital Sodium (60 mg/ml; Apoteket, Umeå, Sweden) at 100 mg/kg BW. The abdominal cavity was opened and the entire GI tract was removed. The small intestine (SI), caecum and the entire (ascending and descending) colon (LI) were isolated and the length was determined before the intestine was emptied and weighed; the liver was weighed separately.
Bacterial enumeration and faecal pH
For bacterial enumeration, 5 g of faeces was serially diluted (10−1 to 10−9) in peptone water, containing 0.2% peptone and 0.05% TWEEN 20, homogenized with a laboratory blender (Stomacher 400, York, UK) and plated on selective media. Lactobacilli were enumerated by plating on Rogosa agar (Merck, Darmstadt, Germany) and anaerobically incubated at 37°C for 96 h before counting. Coliforms were enumerated by plating on MacConkey agar (Merck, Darmstadt, Germany) and incubated aerobically at 37°C for 24 h before counting. All bacterial counts were log10 transformed before statistical analysis. To determine the faecal pH, a subsample of 2 g of each fresh faecal sample was diluted in 20 ml distilled water and the pH was measured (PHM 210, Radiometer, Cedex, France).
T-RFLP
DNA was extracted from 200 mg faecal sample using QIAamp DNA Stool Mini kit (Qiagen, Hilden, Germany), according to the manufacturer's instruction. To ensure appropriate lysis of bacteria, the heating step was supplemented with three cycles of heating at 95°C for 5 min followed by snap-freezing in liquid nitrogen. To obtain a profile of the faecal microbiota composition, extracted DNA was analysed with the T-RFLP methodology as previously described (Dicksved et al., Reference Dicksved, Halfvarson, Rosenquist, Jarnerot, Tysk, Apajalahti, Engstrand and Jansson2008). Briefly, bacterial 16S rRNA gene fragments were PCR amplified from each DNA extract with general primers Bact-8F 5′-end labelled with 6-carboxyfluorescein and 926r. The PCR products were digested with a restriction enzyme (HaeIII), the digested products were separated on a capillary sequencer (ABI 3730) and T-RFLP profiles were processed using Peak Scanner V1.0. Relative peak area of each terminal restriction fragment (TRF) was calculated by dividing individual peak area by total peak area within the following size limits: lower limit 50 base pairs and upper limit 500 base pairs. TRFs with a relative abundance below 0.5% were excluded from the remaining analysis. The TRF profile for each pig was based on the results from two PCR reactions.
Cloning and sequencing
To identify bacteria that corresponded to TRFs of interest, small clone libraries from six pigs were created as previously described (Dicksved et al., Reference Dicksved, Halfvarson, Rosenquist, Jarnerot, Tysk, Apajalahti, Engstrand and Jansson2008). Briefly, 16S rRNA gene fragments of the extracted DNA were amplified using primers Bact-8F and 926r. PCR products were gel-purified using Qiagen gel extraction kit (Qiagen, Holden, Germany), cloned into TOPO TA pCR 4.0 vector and transformed into Escherichia coli TOP 10 chemically component cells. A total of 48 inserts from each library were PCR amplified using vector primers M13f and M13r, and the resulting PCR products were analysed by T-RFLP analysis as described above. Clones with TRF sizes of interest were sent for sequencing at a total of 103 sequenced clones. The sequences were compared with the GenBank database using standard nucleotide BLAST at NCBI, as well as with the Ribosomal Database Project 10 Sequence Match. Unique sequences were deposited in GenBank at NCBI under the following GenBank accession numbers: JF794786–JF794852.
Calculations
Relative organ weight was calculated as g organ/kg live weight. Dietary fibre was calculated as total NSP + lignin; organic matter (OM) = DM−ash. CTTAD were calculated using the indicator technique (Sauer et al., Reference Sauer, Fan, Moesenthin and Drochner2000) according to the equation:

where CTTADD is the coefficient of apparent digestibility of the nutrient in the diet; TiD the TiO2 concentration in the diet (g/kg); N F the nutrient concentration in faeces (g/kg); N D the nutrient concentration in the diet (g/kg); and TiF the TiO2 concentration in faeces (g/kg).
Simpson's diversity index was calculated according to Begon et al. (Reference Begon, Harper and Townsend2006) using the equation

where D = ∑(n/N)2 and n is ∑ of the relative abundance for a TRF; N the total ∑ of the relative abundances.
Chemical analyses
Feed and faecal samples were freeze-dried and milled through a 1-mm sieve before analysis. Samples were analysed for DM by drying at 103°C for 16 h and for ash after ignition at 600°C for 3 h (Jennische and Larsson, Reference Jennische and Larsson1990). CP (N × 6.25) was determined by the Kjeldahl method according to Nordic Committee on Feed Analysis (2003), using a Kjeltec Auto 1030 analyser (Tecator, Höganäs, Sweden). Total, soluble and insoluble NSP and their constituent sugars, Klason lignin and total dietary fibre were determined using a modified Uppsala method (Bach Knudsen, Reference Bach Knudsen1997). Fructan content was determined according to Association of Official Analytical Chemists with a Fructan Assay Kit (Megazyme Cat. no. K-FRUC, Bray County, Ireland). Gross energy was measured with a bomb calorimeter (Parr 6300 Oxygen Bomb Calorimeter, Illinois, USA). TiO2 concentration was measured according to Short et al. (Reference Short, Gorton, Wiseman and Boorman1996).
Statistical analyses
The statistical analyses were performed with procedure Mixed in SAS (SAS Institute, Cary, NC, USA, version 9.1). Performance, digestibility, organ measurements, bacterial enumeration and faecal pH were analysed with a model including diets (C, CF80, CF160, CR80 and CFR) and sex as a fixed factor and litter as a random factor. For average daily weight gain (DWG), the initial weight was used as the covariate in the model. As faecal samples used for the bacterial enumeration and faecal pH were collected from all pigs three times during the experiment (days 6, 13 and 17), diet effects were analysed with repeated statement with heterogeneous autoregressive of order 1. Two-way interactions between diets and time were tested, but without any significance, and were therefore excluded from the model. The relative abundance of the TRFs were analysed both with procedure Mixed in SAS (SAS Institute, Cary, NC, USA, version 9.1) and cluster analysis. TRFs that occurred in three or less pigs were excluded from the analyses. The mixed model included the same fixed and random factors as above and the relative abundance at day 0 was used as a covariate. Cluster analysis of TRF data was performed on day 17 samples using the Spearman rank correlation. The level of significance was set at P < 0.05.
Results
Feed intake, growth performance and digestive organ parameters
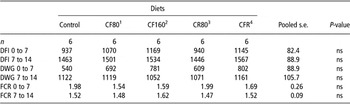
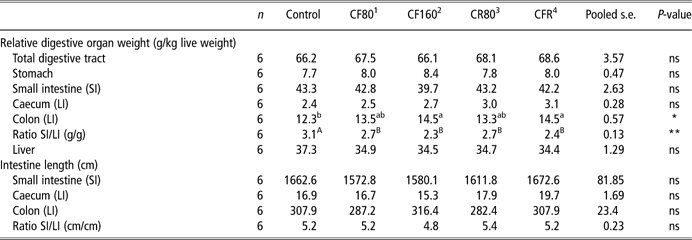
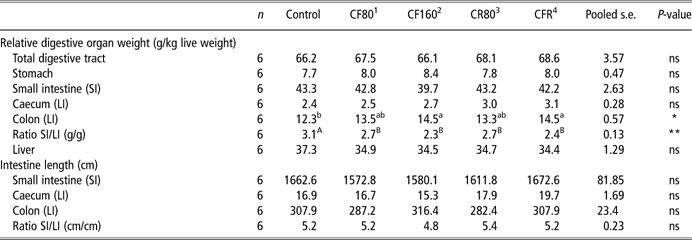
The average daily feed intake (DFI), DWG and feed conversion ratio (FCR) did not differ between the diets at any time (Table 3). The relative weight of colon was higher in pigs fed diets CF160 and CFR than in pigs fed the control diet (P < 0.05). Pigs fed diets with chicory inclusion had a lower (P < 0.05) SI/LI ratio compared with pigs fed the control diet (Table 4).
Effect of diet on DFI (g), DWG (g) and FCR during days 0 to 7 and 7 to 14 on the experimental diets

DFI = daily feed intake; DWG = daily weight gain; FCR = feed conversion ratio.
The results are presented as least square means.
1CF80, 80 g/kg chicory forage.
2CF160, 160 g/kg chicory forage.
3CR80, 80 g/kg chicory root meal (Inu60, Inter-Harz Gmb, Germany).
4CFR, mix of 80 g/kg chicory forage and root meal.
Effects of diet on relative empty digestive organ weights (g/kg live weight) and intestine length (cm)
SI = small intestine; LI = large intestine.
The results are presented as least square means.
1CF80, 80 g/kg chicory forage.
2CF160, 160 g/kg chicory forage.
3CR80, 80 g/kg chicory root meal (Inu60, Inter-Harz Gmb, Germany).
4CFR, mix of 80 g/kg chicory forage and root meal.
a,bDifferent letters in a row, indicate difference (P < 0.05).
A,BDifferent letters in a row, indicate difference (P < 0.01).
Digestibility
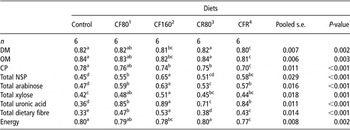
In general, inclusion of 80 g/kg chicory in the diet, either as forage or root, did not affect the CTTAD of DM and OM, whereas inclusion of 160 g/kg chicory (CF160 and CFR) resulted in lower (P < 0.01) CTTAD of DM and OM compared with the control diet and diet CR80 (Table 5). The CTTAD of CP did not differ between the control diet and diet CF80, whereas diets CR80 and CF160 had a lower (P < 0.05) CTTAD of CP than the control diet. Diet CFR had a lower (P < 0.05) CTTAD of CP than all the other diets. Overall, the CTTAD of NSP was higher in diets with inclusion of chicory than the control diet, and diet CF160 had the highest CTTAD values for both total NSP and its constituent sugars and dietary fibre (Table 5). Diet CF160 had the highest (P < 0.01) CTTAD of uronic acids, which was followed in decreasing order by diets CFR and CF80, diet CR80 and the control diet, respectively. The CTTAD of energy did not differ between the control diet and diets CF80 and CR80, whereas it was lower in diets CFR and CF160 (P < 0.05) compared with the control diet.
Effect of diet on the CTTAD of dietary components

CTTAD = coefficient of the total tract apparent digestibility; DM = dry matter; OM = organic matter; NSP = non-starch polysaccharide.
The results are presented as least square means.
1CF80, 80 g/kg chicory forage.
2CF160, 160 g/kg chicory forage.
3CR80, 80 g/kg chicory root meal (Inu60, Inter-Harz Gmb, Germany).
4CFR, mix of 80 g/kg chicory forage and root meal.
a,b,c,dDifferent letters in a row, indicate difference (P < 0.05).
Bacterial enumeration and faecal pH
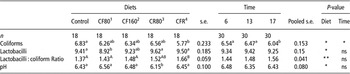
Pigs fed with diet CFR had lower (P < 0.05) coliform counts than pigs fed the control diet (Table 6). The counts of cultivable lactobacilli were lower (P > 0.05) in pigs fed diet CF80 than in pigs fed the control, CR80 and CFR diets. The lactobacilli : coliform ratio was higher in pigs fed diet CFR than in pigs fed the control diet and diets CF80 and CF160. Faecal pH was lower (P < 0.05) in pigs fed diet CR80 than in pigs fed the other diets. The coliform counts were lower (P < 0.05) at day 17 than at days 6 and 13; no other time effect was observed (P > 0.05).
Effect of dietsFootnote # and time (days 6, 13 and 17) on faecal microbial counts (log10 cfu/g) and faecal pH

The results are presented as least square means.
1 CF80, 80 g/kg chicory forage.
2 CF160, 160 g/kg chicory forage.
3 CR80, 80 g/kg chicory root meal (Inu60, Inter-Harz Gmb, Germany).
4 CFR, mix of 80 g/kg chicory forage and root meal.
a,b Different letters in a row, indicate difference (P < 0.05).
A,B Different letters in a row, indicate difference (P < 0.01).
# Analysed with repeated measurements at three times, days 6, 13 and 17.
T-RFLP
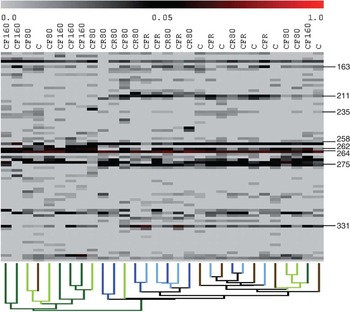
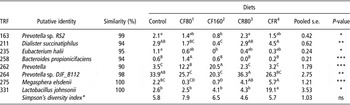
T-RFLP was used to assess the dietary impacts on the composition of the microbiota. In general, the results showed a high complexity with a high individual variation. Cluster analysis of the T-RFLP data revealed two clusters (Figure 1). One of the clusters was dominated by pigs fed diet CF160; five of six pigs fed that diet clustered together. The same cluster also contained three pigs fed diet CF80 and one pig fed the control. Statistical analyses were performed to identify correlations between diet and the relative abundance of specific TRFs. A total of 62 TRFs were statistically analysed, of which 12 differed (P < 0.05) in relative abundance because of diet. Of these TRFs, eight were identified by cloning and sequencing (Table 7). Two TRFs (TRF 163 and TRF 264), identified as two different species related to Prevotella, followed the same pattern and had a lower relative abundance in pigs fed chicory forage diets, in particular for the CF160 diet, compared with pigs fed diet CR80 and the control diet. A third TRF, but with only 90% sequence similarity, was identified as a species related to Prevotella (TRF 262). However, this TRF had higher relative abundance (P < 0.05) in pigs fed diets CF160 and CF80 compared with the control, CR80 and CFR diets. One TRF, showing high similarity to Dialister succinatiphilus (TRF 211), had a lower (P < 0.05) relative abundance in pigs fed diet CF160 compared with pigs fed diets CR80, CFR and control. TRF 235, showing high similarity to Eubacterium halii, was not detected in pigs fed diet CF160, but was detected at a low level in pigs fed all the other diets. TRF 258, showing high similarity to Bacteroides propionicifaciens, had higher (P < 0.05) relative abundance in pigs fed diet CF80 than in pigs fed the other diets. TRF 275, identified as M. elsdenii, had higher (P < 0.05) relative abundance in pigs fed diets CR80 and CFR than in pigs fed diets CF80 and CF160. TRF 331, identified as Lactobacillus johnsonii, had a higher (P < 0.05) relative abundance in pigs fed diet CFR than in pigs fed the other diets. The Simpson's diversity index tended to differ (P = 0.07; Table 7) because of diet, with the numerically highest diversity in pigs fed diet CF80 and the lowest diversity in pigs fed diet CR80.
Overview of the terminal restriction fragment length polymorphism profiles from analysed samples. A heatmap shows the abundance data of terminal restriction fragments (TRFs). Explanation of the abundance intervals is shown with a progressive colour scale at the top of the figure, where 0.0 is the lowest and 1.0 the highest abundance. Each row corresponds to a TRF size and each column corresponds to one pig. The samples are sorted according to their clustering pattern using the Spearman rank correlation. Branch colour in the dendrogram represents the diets: dark green, 160 g/kg chicory forage (CF160); light green, 80 g/kg chicory forage (CF80); brown, control (C); dark blue, 80 g/kg chicory root meal (CR80); light blue, 80 g/kg chicory forage and root meal (CFR). TRFs that differed between diets are indicated to the right.

Effect of diet on the relative abundance (%) of TRF that were identified and differed between diets and Simpson's diversity index

The results are presented as least square means.
1CF80, 80 g/kg chicory forage.
2CF160, 160 g/kg chicory forage.
3CR80, 80 g/kg chicory root meal (Inu60, Inter-Harz Gmb, Germany).
4CFR, mix of 80 g/kg chicory forage and root meal.
a,b,c,dDifferent letters in a row, indicate difference (P < 0.05).
A,B,C,DDifferent letters in a row, indicate difference (P < 0.01).
*Simpson's diversity index was calculated according to Begon et al. (Reference Begon, Harper and Townsend2006), for details see the section ‘Materials and methods’.
Discussion
Inclusion of chicory did not affect the DWG, DFI or FCR. This is in agreement with previous studies where chicory forage and inulin have been included in diets of weaned piglets (Halas et al., Reference Halas, Hansen, Hampson, Mullan, Wilson and Pluske2009; Ivarsson et al., Reference Ivarsson, Frankow-Lindberg, Andersson and Lindberg2011). It should be noted that these studies have used few animals per treatment in short-term experiments, and to fully explore the potential of chicory feeding on growth performance long-term feeding trials need to be performed.
Inclusion of dietary fibre is often associated with increased GI organ weight, increased gut fill and decreased empty BW gain (Pluske et al., Reference Pluske, Black, Pethick, Mullan and Hampson2003; Wellock et al., Reference Wellock, Fortomaris, Houdijk, Wiseman and Kyriazakis2008). In our study, gut fill was not measured, but no differences in the relative weight of the total GI tract was detected, which was in agreement with Halas et al. (Reference Halas, Hansen, Hampson, Mullan, Wilson and Pluske2009). The contrasting results in GI organ weights between the referred studies can be explained by the difference in the dietary fibre content between the control and the treatment diets. In our study and in the study by Halas et al. (Reference Halas, Hansen, Hampson, Mullan, Wilson and Pluske2009), different fibre sources have been compared and the fibre level in the control and experimental diet has been rather similar. However, in the studies where the GI organ weight increased (Pluske et al., Reference Pluske, Black, Pethick, Mullan and Hampson2003; Wellock et al., Reference Wellock, Fortomaris, Houdijk, Wiseman and Kyriazakis2008), the difference in dietary fibre level between the control and the treatment diets was more distinct. Although no differences in relative weight of the total digestive tract was detected in our study, inclusion of 160 g/kg chicory did result in heavier colon compared with the control diet, and the SI/LI ratio was lower in all diets with chicory inclusion. This indicates that chicory inclusion stimulates hindgut development.
Inclusion of 80 g/kg chicory forage or root did not impair the CTTAD of OM or energy, and inclusion of 160 g/kg only gave minor impairment of the same parameters, whereas the CTTAD of NSP, especially uronic acids, increased with increased chicory forage inclusion, which is in agreement with a previous study (Ivarsson et al., Reference Ivarsson, Frankow-Lindberg, Andersson and Lindberg2011). This can be explained by differences in chemical composition of the plant cell walls between the fibre sources compared in this study. In monocotyledonous plants, such as cereals, the polysaccharides in the cell wall are arranged as arabinoxylans and the constituent sugars such as uronic acids and arabinose are a part of this structure, whereas in dicotyledonous plants, such as chicory, the polysaccharides in the cell wall are arranged as pectin, and consequently the constituent sugars are a part of that structure (Laar et al., Reference Laar, Tamminga, Williams and Verstegen2000). The control diet had the highest content of wheat and barley, and thereby the highest content of arabinoxylans. Inclusion of chicory forage increased the content of pectins, whereas inclusion of chicory root increased the content of fructan, at the expense of cereal arabinoxylans. Although we were not able to estimate the digestibility values of the chicory forage and root independently of diet, it is clear that chicory forage is the fibre source with highest fibre digestibility followed by chicory root and wheat/barley. A close link between the chemical composition of plant fibre and digestibility in pigs has also been found by Noblet and Le Goff (Reference Noblet and Le Goff2001).
The improved fibre digestibility together with the indications of a more developed hindgut in pigs fed diets with chicory inclusion suggests that the microbiota in these pigs could be altered, and to some extent this was also the case. By analysing the gut microbial ecosystem with both culture-based and molecular profiling methods, a broader and more accurate picture of the effects of chicory inclusion was expected. The cultivation data showed an interesting synergistic effect of combining chicory root and chicory forage by lowering the coliform counts and increasing the lactobacilli : coliform ratio. The effect of chicory inclusion on the lactobacilli counts was less clear than the effect on coliform counts; pigs fed diet CF80 had lower counts than the pigs fed control and this was not expected. No other dietary effects on the lactobacilli counts were detected, which is consistent with other studies (Loh et al., Reference Loh, Eberhard, Brunner, Hennig, Kuhla, Kleessen and Metges2006; Molist et al., Reference Molist, de Segura, Gasa, Hermes, Manzanilla, Anguita and Perez2009).
Overall, the T-RFLP data showed a high complexity and a high individual variation in microbial profiles of pigs, which was clearly demonstrated by the cluster analysis and is in agreement with other studies (Zoetendal et al., Reference Zoetendal, Collier, Koike, Mackie and Gaskins2004; Loh et al., Reference Loh, Eberhard, Brunner, Hennig, Kuhla, Kleessen and Metges2006). Despite this, some dietary effects were detected, and pigs fed diet CF160 seem to have a more uniform microbiota than pigs fed the other diets. The analysis of individual TRFs also showed that chicory root and chicory forage to a certain extent stimulates different bacterial groups. Moreover, the diversity tended to be higher with addition of chicory forage compared with chicory root inclusion. In contrast, TRF 275, identified as M. elsdenii had a higher relative abundance in pigs fed diets with chicory root, which is in agreement with others (Mølbak et al., Reference Mølbak, Thomsen, Jensen, Knudsen and Boye2007; Halas et al., Reference Halas, Hansen, Hampson, Mullan, Kim, Wilson and Pluske2010). Mølbak et al. (Reference Mølbak, Thomsen, Jensen, Knudsen and Boye2007) suggested a role for M. elsdenii in inhibition of the pathogenic bacteria Brachyspira hyodysenteriae. In the diet that contained both chicory forage and chicory root (CFR), some synergistic effects were detected. Except for lower coliform counts, pigs fed diet CFR had more than four times higher relative abundance of L. johnsonii than pigs fed only chicory root or chicory forage. Synergistic effects on the microbial population between insoluble and soluble NSP have previously been reported by Molist et al. (Reference Molist, de Segura, Gasa, Hermes, Manzanilla, Anguita and Perez2009).
TRF 163, 262 and 264 all had Prevotella as the closest match but responded differently to the diets. TRF 262 was stimulated by chicory forage, whereas TRF 163 and 264 was lower in the diets with chicory forage. Leser et al. (Reference Leser, Amenuvor, Jensen, Lindecrona, Boye and Mller2002) found that Prevotella is one of the dominating commensal bacteria in the LI of the pig, but the sequence similarities with identified bacteria were few. Moreover, we know little about how this genus responds to different diets in pigs. In this study, the sequence similarity was low, especially for TRF 262 that had as low as 90% sequence identity to the closest match. Ruminal Prevotella is known to have oligosaccharolytic and xylanolytic activities and to be second-line degraders (Flint, Reference Flint1997). Tajima et al. (Reference Tajima, Aminov, Nagamine, Matsui, Nakamura and Benno2001) showed that Prevotella ruminicola and Prevotella bryantii in rumen respond in opposite directions to hay and grain diets, showing a high variation within the genus. Clearly, to fully understand our dietary effects, more knowledge is needed about the commensal bacteria in pig.
In conclusion, this study shows that chicory forage can be included in a pig diet up to 80 g/kg without negative effects on short-term growth performance and digestibility. Moreover, a combination of chicory forage and root synergistically affect the faecal microbiota.
Acknowledgements
The authors thank Anna-Greta Haglund for the excellent work with the chemical analyses and Associate Professor Hans Jonsson, Department of Microbiology, Swedish University of Agricultural Sciences for support with the microbial analysis.