I. INTRODUCTION
As the global energy consumption continues to increase rapidly, we are compelled to find alternative renewable energy generation and storage resources and make their production economically viable to displace the use of fossil fuels.Reference Dincer1,Reference Dresselhaus and Thomas2 While solar and wind energy harvesting could be directly integrated into the grid, thermoelectric (TE) materials that convert waste heat into electricity, can serve as an excellent energy resource for low-power electronic devices, such as automotive TE generators and radio communications.Reference DiSalvo3,Reference Rowe4 However, limited efficiency, dissimilar compatibility factors between the n- and p-type TE materials,Reference Puneet, Podila, Karakaya, Zhu, He, Tritt, Dresselhaus and Rao5 and the lack of inexpensive scalable methods to manufacture TE materials have limited their use in power generation.Reference Rowe4 The performance of TE materials is strongly associated with the dimensionless figure of merit (ZT) which is defined as
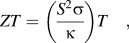 $$ZT = \left( {{{S^2 \sigma } \over \kappa }} \right)T\quad ,$$
where S is the Seebeck coefficient, σ is the electrical conductivity, and κ is the total thermal conductivity (κ = κl + κe; κl and κe are the lattice and electronic thermal conductivities, respectively). High electrical conductivity (corresponding to low Joule heating losses, or electron crystal behavior), large Seebeck coefficient (corresponding to large potential difference over a wide temperature range), and low thermal conductivity (corresponding to a high degree of phonon scattering, or phonon-glass behavior) must coexist within the same material to realize high TE performance. Additionally, a weakly temperature-dependent compatibility factor (ratio of the electrical current density to heat flux) is highly desirable for assembling materials with high TE performance into devices.Reference Min and Rowe6–Reference Heremans, Jovovic, Toberer, Saramat, Kurosaki, Charoenphakdee, Yamanaka and Snyder9 Lead telluride (PbTe) is one of the most widely studied materials for low temperature TE applications due to its cubic rock salt structure, narrow band gap (∼0.32 eV at room temperature), and the strong quantum confinement present in nanoscale PbTe (whose dimensions are less than its relatively large Bohr radius of 46 nm).
Tailoring the micro and nanostructures at multiple length scales in TE materials using both simple and advanced materials preparation methods (e.g., ball-milling, melt-spinning) is known to decrease the phonon mean free path and thereby decreases κ for achieving high ZT in TE materials.Reference Snyder and Toberer10,Reference Chen, Dresselhaus, Dresselhaus, Fleurial and Caillat11 For example, the introduction of suitable nanoscale precipitates in the parent matrix of PbTe has been shown to reduce the lattice contribution of thermal conductivity in PbmSbAgTem+2 (abbreviated as LAST),Reference Poudeu, D'Angelo, Kong, Downey, Short, Pcionek, Hogan, Uher and Kanatzidis8,Reference Hsu, Loo, Guo, Chen, Dyck, Uher, Hogan, Polychroniadis and Kanatzidis12 Na-doped PbTe–PbSReference Girard, He, Zhou, Shoemaker, Jaworski, Uher, Dravid, Heremans and Kanatzidis13 and (PbTe)1−2x(PbSe)x(PbS)x.Reference Korkosz, Chasapis, Lo, Doak, Kim, Wu, Hatzikraniotis, Hogan, Seidman and Wolverton7 (PbTe)1−x(PbSe)x was reported to attain high power factor values via modification of the band structure. Conversely, (PbTe)1−x(PbS)x was reported to exhibit a low thermal conductivity arising from extensive nanostructuring.Reference Korkosz, Chasapis, Lo, Doak, Kim, Wu, Hatzikraniotis, Hogan, Seidman and Wolverton7 In addition, Tl-doped (Ref. Reference Heremans, Jovovic, Toberer, Saramat, Kurosaki, Charoenphakdee, Yamanaka and Snyder9) and Se-doped (Ref. Reference Pei, Shi, LaLonde, Wang, Chen and Snyder14) PbTe showed excellent TE properties due to band engineering, such as multiple valance bands and the introduction of density of states (DOS) distortion in their valence bands. All of the above discussed materials exhibit a ZT in the range of 1–2.2 (Ref. Reference Biswas, He, Blum, Wu, Hogan, Seidman, Dravid and Kanatzidis15) in the temperature range from 600 to 915 K. Moreover, Hicks and DresselhausReference Hicks and Dresselhaus16 have proposed that a high ZT can be achieved by reducing the TE material's dimensions to a quantum confinement size.Reference Hicks and Dresselhaus16–Reference Heremans, Thrush, Morelli and Wu21 In light of successful doping and nanostructuring of PbTe, there is renewed interest in the synthesis methods for PbTe whose dimensions (size and shape) lie within its excitonic radius of 46 nm.
Although many synthesis methods have been reported for PbTe nanostructures with high surface to volume ratio (nanocrystals,Reference Mokari, Zhang and Yang22,Reference Urban, Talapin, Shevchenko and Murray23 nanorods,Reference Peng, Manna, Yang, Wickham, Scher, Kadavanich and Alivisatos24 nanoboxes,Reference Wang, Poudel, Wang and Ren25 nanowires,Reference Zhang, Yu, Mo, Wu, Kwong and Li26–Reference Lee, Shim, Jang, Roh, Kim, Park and Lee29 nanosheets,Reference Zhu, Chen, Meng, Zhao and He30 hollow spheres and nanotubes,Reference Zou, Liu, Wang, Jiang and Qian31 nanocompositesReference Martin, Nolas, Zhang and Chen32), they remain challenging due to their high sensitivity to pH and synthesis temperatures. All efforts to improve ZT in PbTe nanostructures can have a far-reaching impact only if economically viable and scalable methods to produce them with minimal batch-to-batch variation in TE performance can be developed. Accordingly, in this study we report a cost-effective, surfactant-free, and scalable method for PbTe nanocubes whose crystallite size and shape evolves with increasing reaction time and exhibit superior TE properties compared to the bulk. Notably, our synthesis method produces sufficiently large quantities that are amenable for further processing through spark plasma sintering (SPS). The pellets obtained by SPS processing of PbTe nanocube powder samples, exhibited high Seebeck coefficient, moderate electrical conductivity and significantly low thermal conductivity. Interestingly, we found that the Seebeck coefficient exhibits strong bipolar turnover unlike the bulk PbTe while the electrical conductivity exhibits a degenerate semiconductor-like doping even in the absence of extrinsic doping. We obtained a room temperature ZT of ∼0.45 (which is four times higher than the reported values with similar chemical composition) in nanostructured PbTe with excellent TE compatibility factor, as discussed below.
II. EXPERIMENTAL DETAILS
In this study, the PbTe nanocubes were prepared by vigorously mixing Te metal powder (99.9% purity) with PbCl2 (99% purity) in an alkaline solution (NaOH) via the chemical precipitation method, without the addition of stabilizing agents. Our method is surfactant-free, cost effective, and amenable for scalable production of high yield PbTe nanocubes, and thus advantageous over existing synthesis techniques.Reference Gupta, Neeleshwar, Kumar and Chen33,Reference Mlowe, Nejo, Pullabhotla, Mubofu, Ngassapa, O'Brien and Revaprasadu34 Furthermore, the reaction time and temperature used in our chemical precipitation method are comparatively lower than those reported by other groups using similar chemical methods. In our method, PbCl2 and Te powders were first transferred into a 250 mL flask attached to a condenser containing 100 mL double distilled water. The mixture was then stirred for 10 min at 60 °C, and subsequently, 0.25 M of NaBH4 (97% purity, as a reducing agent) and 1.25 M of NaOH (for pH control) were added to the stirred mixture. For comparison, the PbTe nanoparticles synthesized via the wet chemical methodReference Dong, Liu, Li, Su, Tang and Uher35 required a longer reaction time of 24 h at 100 °C in comparison to the shorter reaction time of 2 h and lower reaction temperature of 60 °C used in this study. Good phase purity (1:1 ratio) was observed in the chemical reaction involving 0.025 M of PbCl2 and 0.025 M Te. In general, for a particular solvent, there is certain solubility for a solute, whereby addition of any excess solute will result in precipitation and formation of nanocrystals. In this chemical precipitation method, the supersaturated solution initially promotes nucleation. Once the concentration of solution level falls below a critical level, the nucleation process automatically terminates. Furthermore, the growth of nuclei is dependent on the molecular additions until the equilibrium concentration of the nanocrystal species has reached.Reference Burda, Chen, Narayanan and El-Sayed36 The PbTe nanocrystals were formed similarly from the solution and they grew with the addition of the molecules in a particular direction until it reached the super saturated state. In our case, the addition of the molecules took place in the (111) direction and got saturated with the cubic shape. Clearly, well-grown nanocubes were formed after a long reacting time of 24 h. Also, the addition of the surfactant promoted growth of nanocubes when the reaction time was of a longer duration. The resultant products were dried, consolidated, and sintered into a pellet in a graphite die using SPS (SPS Syntex, 725) at identical optimized process parameters [vacuum ∼ 4 Pa, pressure ∼ 60 MPa, temperature ∼ 673 K, DC pulse ratio (current on/off time in milliseconds = 12:2) for 3 min holding time with a comparatively high heating rate of 200 °C/min]. In the auto mode operation of the SPS, both the pressure and temperature parameters were controlled by proportional integral derivative (PID) controllers to maintain proper current path, and prevent the overshoot of temperature (within an accuracy of ±2 °C). Using the conventional Archimedes' method, the density of PbTe pellets was measured to be ∼90% of its theoretical density. Powder x-ray diffraction (XRD) measurements were performed using PAN analytical x-ray diffractometer with a Cu Kα radiation (λ = 1.5406 Å) for analyzing the samples, and the particle size was estimated by Scherer formula  $D = {{k\lambda } \mathord{\left/ {\vphantom {{k\lambda } {\beta \cos \theta }}} \right. \kern-\nulldelimiterspace} {\beta \cos \theta }}$, where k = 0.90, β is the full width half maximum of the intense peak and θ the Bragg angle. The high-resolution transmission electron microscopy (HRTEM) experiments were performed using a Tecnai G2 F30 STWIN operated at the electron accelerating voltage of 300 kV. Specimens for electron microscopy were prepared by using mechanical polishing followed by subsequent ion milling. Mechanical polishing was carried out by reducing a 3 mm diameter disc of sample specimen, from a thickness ∼50–100 μm to ∼20–30 μm by utilizing a dimple grinder (model: 515 CE, South Bay Technology). Subsequently, ion beam milling was carried out using an ion mill system (model: Baltec RES 101) at 7 kV and low angle milling was utilized to attain specimens that are electron beam transparent. During ion milling, Ar+ ions were used for a few minutes for a gentle thinning of the specimen without causing any damage to the samples. Field emission scanning electron microscope (FESEM) (Zeiss, Model: Supra 40VP, Germany) was used to examine the morphology of the PbTe nanocubes. The resolution of the instrument was 1.3 nm at 15 kV. The FESEM sample was initially polished by SiC emery paper (Grade: 4–1000) and finally polished on a polishing grade cloth with Al2O3 slurry. The scanning electron microscope image of a fractured surface of the SPS-processed nanocubes was taken using a Hitachi S4800 operated at beam energy of 10 kV. The thermal diffusivity measurements were performed on as-sintered PbTe pellets of diameter of ∼12 mm and thickness of 3 mm using a laser flash system (Linseis, LFA 1000, Germany), and the specific heat capacity at constant pressure was determined using differential scanning calorimetry (Netzsch, DSC 404 F3, Germany). The total thermal conductivity was calculated as κ = DρC p, where D is the thermal diffusivity, ρ is the mass density of the sample, and C p is the specific heat capacity at constant pressure. The Seebeck coefficient and resistivity were measured using the commercial equipment (Ulvac, ZEM 3) using 3 mm3 × 3 mm3 × 11 mm3 parallelepipeds cut from the as-sintered pellet. The uncertainties in the transport measurements were: ±6% for thermal diffusivity, ±5% for electrical conductivity, ±7% for Seebeck coefficient, ±8% for specific heat, and ±0.5% for density.
III. RESULTS AND DISCUSSIONS
A. Phase and structural analysis
In the chemical precipitation method, the precursors react with the reducing agent in an alkaline environment to form nucleation centers (spherical), which, through the addition of the Pb and Te atoms, subsequently evolve into nanocubes in specific crystal directions. In this work, the nanocrystals attained a cubic shape after a reaction time of ∼2 h, which subsequently grew in size from 15 to 25 nm cube edge size with the reaction time (up to 24 h). Figure 1(a) shows the XRD patterns of the surfactant-free PbTe nanocubes obtained at different reaction times. All samples exhibit a cubic PbTe phase with space group  $\left( {Fm\overline 3 m} \right)$ (JCPDS card #78-1905). Refined XRD patterns indicated pure PbTe phase (lattice constant, a = 6.45 Å) with the absence of any secondary phases. Quantitative analysis using Rietveld refinement indicated a goodness of fit, χ2 ∼ 3.7 with weighted profile R-factor. value ∼16%. (Fig. S1, Supplementary Information) The average crystallite sizes estimated by Scherer method are, respectively, ∼15 and ∼25 nm for a reaction time of 2 h (PbTe-2 h) and 24 h (PbTe-24 h), which are in a good agreement with the HRTEM images shown in Figs. 1(b)–1(d). The XRD patterns of the SPS-processed PbTe nanocubes exhibited no change in crystal structure after densification via SPS. A detailed analysis of the lattice spacing using HRTEM [Fig. 1(b)] confirmed the nanocube growth direction as the [111] cubic symmetry direction. As evident in the Fig. 1(c), the nanocrystals exhibit a cubic shape after a reaction time of ∼2 h, which grew in size from (15–25 nm) with the reaction time (up to 24 h) without any loss in shape [Fig. 1(d)]. The homogeneous distribution of Pb and Te elements in PbTe nanocubes was confirmed by FESEM and energy dispersive x-ray analysis exhibited a Pb/Te ratio of 61.84/38.16 (1:1) (shown in Fig. S2(a), Supplementary Information). Furthermore, in Figs. 2(a) and 2(b), the transmission electron microscopy (TEM) images illustrate the particle size distribution of PbTe nanocubes after reaction times of 2 and 24 h, respectively. As observed from the histograms in Fig. 2, an increase in the particle size with increasing reaction time is evident with a simultaneous change in their morphology. As a result, we performed detailed electrical and thermal transport measurements on the PbTe-2 h samples (after SPS) to gage their TE properties. Selective area electron diffraction (SAED) confirmed that the samples are highly polycrystalline in natureReference Kuo, Jeng, Ku, Wu, Chou and Hwang37 concurring with the XRD pattern of the nanocubes.
(a): XRD patterns of PbTe nanocubes as a function of reaction time. TEM images show (b) the nucleation of the PbTe nanocrystal, (c) the growth of the crystal in (111) direction, and (d) as the reaction time increases the crystal exhibits cubic shape with edge length around 15–20 nm. Scale bars in all panels correspond to 10 nm.

TEM images illustrating the particle size distribution of PbTe nanocubes after 2 and 24 h reaction times, in (a) and (b) respectively. Expanded view of PbTe nanocubes obtained after 2 h reaction time (c) and a typical SAED pattern is shown in (d).
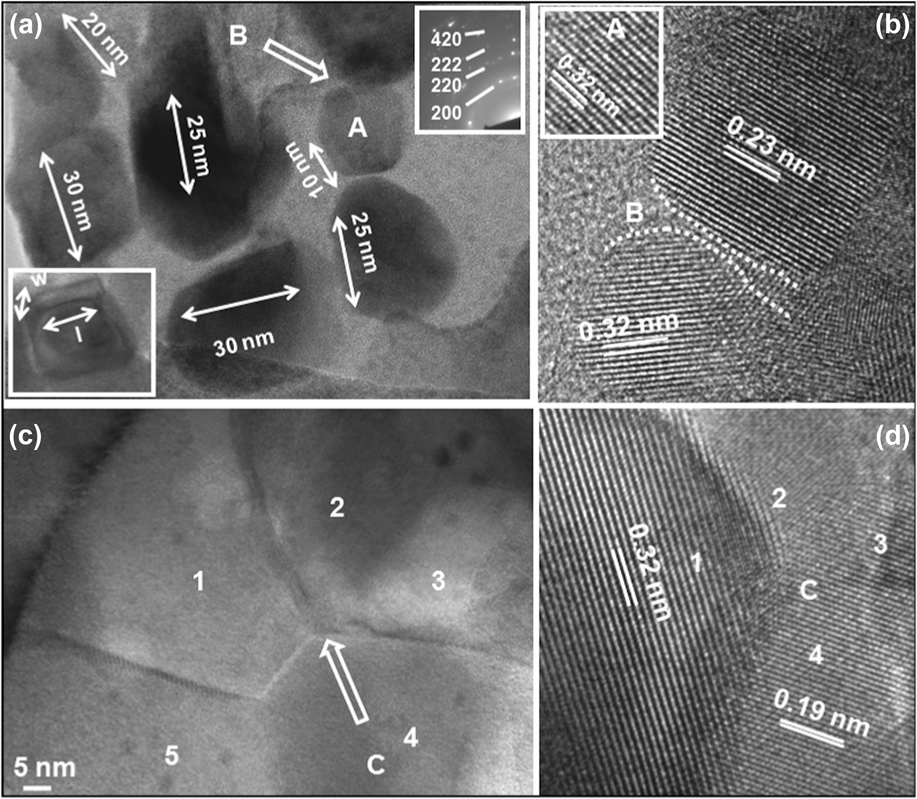
Figure 3(a) shows the HRTEM image of the spark plasma sintered PbTe showing the cuboids of different sizes after a reaction time of 2 h and the nanostructured grains with clear interfaces between them. In general, the nanostructured grains were noted as the constituents of the entire specimen. The size of these grains was approximately between 10 and 30 nm, with majority of the grains sizes ∼20–25 nm [Fig. 3(a)]. It was further revealed that the individual grains are faceted with sharp edges and mostly distributed in random orientations. It is important to mention that, although the corresponding powder sample (Fig. 2) exhibited well-defined cuboidal morphologies, however, in sintered samples it is difficult to elucidate such contours of individual grains as shown in Fig. 3(c), presumably due to their random compaction during high temperature annealing under spark plasma. Still, some of these grains can be seen in clear cuboid morphologies with sharp contours and facets. One such fascinating morphology of a cuboid is elucidated as region A in Fig. 3(a) with the edge length of about 10 nm. A corresponding SAED pattern recorded from the randomly oriented nanoscaled grains [inset in Fig. 3(a)] shows the presence of selected Debye rings of the important atomic planes (hkl): 200, 220, 222, 420 with the interplanar spacings of 0.32, 0.23, 0.19, 0.14 nm, respectively, of PbTe cubic crystal structure (lattice constant: a = 0.645 nm, space group:  $\left( {Fm\overline 3 m} \right)$, reference: JCPDS card no. 78-1905). Inset in Fig. 3(b), shows an atomic scale image of region A in Fig. 3(a), with the interplanar spacing of 0.32 nm, revealing that the individual cuboids are constituted of well oriented lattice planes. Another atomic scale image [Fig. 3(b)] demonstrates the region B [Fig. 3(a)] and shows that the thin interface between these ultrafine nanocrystallites, as indicated by two sets of dotted lines, is crystallographically perturbed due to different orientations of neighboring crystallites with varied interplanar spacing of 0.32 and 0.23 nm. Figure 3(c) shows a set of faceted grains, marked as 1 to 5, interacting at around the same region within the vicinity of about 12 nm. Among these grains, the grains 1 to 4 are joined at their vertices at a point C in Fig. 3(c). A corresponding atomic scale image of region C [Fig. 3(d)] displays different orientations of crystallographic planes in the nanoscaled grains present in the microstructure. A fractured surface of the SPS-processed PbTe pellet is shown in Fig. S2(b), where the sizes of the clusters vary from ∼200 to 800 nm, arising from localized Joule heating of the SPS process. The SPS technique works mainly on the basis of the electric spark discharge, wherein a high energy pulsating current momentarily generates plasma between adjacent particles and results in a highly localized rise (∼200 °C/min) in temperature. It is well known that the heat generated at the particle interfaces during the SPS process also removes surface contaminants, and in conjunction with an applied external force, leads to higher densification of the particles in the pellet.Reference Puneet, Podila, Karakaya, Zhu, He, Tritt, Dresselhaus and Rao5,Reference Puneet, Podila, Zhu, Skove, Tritt, He and Rao38,Reference Datta, Popescu, Woods and Nolas39 The post sintering nanoscale features [see Fig. 3(b)] are attributed to the rapid heating rates of SPS (∼200 °C/min) associated with short consolidation times.
HRTEM image of spark plasma sintered PbTe showing, (a) cuboids of different sizes, (b) atomic scale image of region B in panel “a”, (c) nanostructured grains with clear interfaces between them, and (d) atomic scale image of region C in panel (c). A topographical view of a cuboid with the length (l) and the width (w) about 20 and 10 nm, respectively, is displayed in the inset panel (a). Insets: upper (a) SAED of nanograins, (b) atomic scale image of region A in panel (a).
1. Electrical transport
Figure 4(a) shows the temperature dependence of electrical conductivity (σ) of the SPS processed PbTe nanocubes compared with reported values. Surprisingly, the electrical conductivity exhibits a degenerate semiconductor-like behavior (i.e., σ decreases with increasing temperature), similar to the SPS-processed PbTe nanowiresReference Finefrock, Zhang, Bahk, Fang, Yang, Shakouri and Wu40 and nanocrystalline Bi2Te3,Reference Kim, Han, Yo, Lee and Kim41 plausibly due to the presence of the surface states induced by nanostructuring. A slight upturn in σ is observed above 500 K due to the bipolar conduction. Assuming that the carrier concentration (here hole concentration) remains temperature independent below 450 K, the σ is observed to decrease as a function of temperature as T −1.5, indicating acoustic phonon scattering. (Supplementary Information, Fig. S3)
Temperature dependent transport properties of PbTe nanocubes (300–600 K), (a) electrical conductivity (b) Seebeck coefficient, and (c) power factor.
As observed in the Fig. 4(a), the SPS-processed nanocubes exhibited a maximum σ of about 8000 S/m at room temperature that is nearly four times higher than the reported values of pure PbTe prepared by a wet chemical method, compacted via SPS by Dong et al.Reference Dong, Liu, Li, Su, Tang and Uher35 A slightly higher σ ∼ 9000 S/m was reported by Finefrock et al.Reference Finefrock, Zhang, Bahk, Fang, Yang, Shakouri and Wu40 in the PbTe nanowires, compacted by SPS at T = 405 °C. The electrical conductivity was observed to increase with increasing SPS temperature in the nanowires. Similar behavior is reported in the attrition-milled SPS sintered PbTe nanograins by Kuo et al.,Reference Kuo, Jeng, Ku, Wu, Chou and Hwang37 where σ increases from 8900 to 11,000 S/m on increasing the SPS temperature from 300 to 400 °C. The value of σ is much lower in the nanocubes compared to the bulk ingot possibly due to the increased scattering of the charge carriers with increased number of grain boundaries. Nevertheless, the electrical conductivity remains higher in the SPS-processed PbTe nanocubes compared to the pure PbTe nanoparticles prepared by the wet chemical method. Despite the larger particle sizes (∼5–10 μm) reported in the latter, a comparatively low electrical conductivity is attributed to the presence of organic residues, and the relatively low densities in materials prepared by chemical methods.Reference Dong, Liu, Li, Su, Tang and Uher35
The spark plasma sintered PbTe nanocubes exhibit a p-type Seebeck coefficient (S) from room temperature to 500 K as shown in Fig. 4(b). A conversion from p-type to n-type semiconducting behavior is observed above 500 K that is similar to the pure PbTe nanocrystals prepared by the wet chemical method.Reference Dong, Liu, Li, Su, Tang and Uher35 The total Seebeck coefficient of a two-band semiconductor is given by:
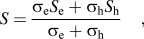 $$S = {{\sigma _{\rm{e}} S_{\rm{e}} + \sigma _{\rm{h}} S_{\rm{h}} } \over {\sigma _{\rm{e}} + \sigma _{\rm{h}} }}\quad ,$$
where S e and S h are the Seebeck coefficients of the two carriers, electrons and holes that are opposite in sign, and σe and σh are the contributions to electrical conductivities of the two carriers, respectively. At T < 400 K, the Seebeck coefficient is p-type, and the term σhS h dominates. In the narrow band gap semiconductors, a large number of electrons enter the conduction band due to thermal excitation. As a result, the S e term gradually increases with increasing temperature that reduces the magnitude of the total Seebeck coefficient. Eventually, the majority n-type charge carriers dominate over the p-type exhibiting a negative sign beyond 530 K.Reference Liu, Yan, Chen and Ren42 The Seebeck coefficient exhibits a maximum value of S ∼ +420 µV/K (p-type) at a temperature ∼400 K that remains at the high value ∼+400 ± 10 µV/K over an extended temperature range of 300–425 K. In contrast, a peak of similarly high magnitude is observed at T ∼ 350 K in the pure PbTe nanoparticles reported by Dong et al.,Reference Dong, Liu, Li, Su, Tang and Uher35 which decreases with increasing temperature more steeply than the SPS-processed nanocubes. A subtle change of slope in the Seebeck coefficient is observed in the dS/dT versus temperature plot below 350 K, where S remains fairly constant (Fig. S3, Supplementary information). Above 450 K, the slope changes abruptly, the temperature of which is consistent with the upturn in the electrical conductivity due to bipolar conduction. Despite the higher electrical conductivity exhibited by the SPS-compacted nanograins and nanowires,Reference Finefrock, Zhang, Bahk, Fang, Yang, Shakouri and Wu40,Reference Tai, Zhou and Guo43 the Seebeck coefficient of both the materials exhibits a much lower S ∼ 240–270 µV/K at 300 K that reduces the TE power factor as shown in Fig. 4(c). A slightly lower Seebeck coefficient value ∼+328 µV/K at room temperature was reported by Martin et al.Reference Martin, Nolas, Zhang and Chen32 with an electrical conductivity ∼4000 S/m at a carrier concentration of ∼9.5 × 1017 cm−3. The electrical conductivity was reported to have been increased to ∼7937 S/cm at a carrier concentration of ∼1.5 × 1018 cm−3 with a similar Seebeck coefficient value ∼+324 µV/K at room temperature at a slightly different stoichiometry. Nevertheless, the TE power factor at room temperature is comparatively higher in the SPS-processed PbTe nanocubes compared to the PbTe nanocomposites by Martin et al. In addition, as compared to the bulk PbTe a considerable enhancement in the Seebeck coefficient is observed, which may be attributed to either an increase in the DOS at the Fermi level, or energy dependent charge carrier scattering mechanisms,Reference Heremans, Jovovic, Toberer, Saramat, Kurosaki, Charoenphakdee, Yamanaka and Snyder9 or to energy filtering (potential boundary scattering at the grain boundaries).Reference Moyzhes and Nemchinsky44 The Seebeck coefficient S of a degenerate semiconductor from the Mott expression [Eq. (3)] depends on the energy derivative of the electrical conductivity, σ(E) = n(E)qμ(E) = nq 2τ(E)/m*, where μ(E) is the energy dependent carrier mobility, q is the carrier charge, n(E) is the carrier density, τ(E) = τ0E r−0.5 is the carrier relaxation time, r is the scattering exponent, and m* is the effective mass of the charge carriers:
 $$S = {{{\pi ^2}} \over 3}{{{k_{\rm{B}}}} \over q}{k_{\rm{B}}}T{\left\{ {{1 \over n}{{{\rm{d}}n\left( E \right)} \over {{\rm{d}}E}} + {1 \over \mu }{{{\rm{d}}\mu \left( E \right)} \over {{\rm{d}}E}}} \right\}_{E = {E_{\rm{F}}}}}\quad .$$
Based on the Sofo–Mahan theory,Reference Mahan and Sofo45 an increase in S may be attributed to an increase in the carrier density n(E) = g(E)f(E), which depends on g(E), the local DOS at the Fermi energy. An increase in the local DOS near the Fermi level may be observed due to the presence of surface/defect-induced states arising from impurity atoms in the valence or the conduction band of the host semiconductor matrix, as reported in the dilute Tl–PbTe alloy.Reference Heremans, Jovovic, Toberer, Saramat, Kurosaki, Charoenphakdee, Yamanaka and Snyder9 The magnitude of S may also increase due to strongly energy dependent scattering of the charge carriers [i.e., increased energy dependence of μ(E)]. In degenerate semiconductors, the Seebeck coefficient is related to the effective mass, according to the following relationReference Ravich, Efimova and Smirnov46:
 $$S = {{8\pi ^2 k_{\rm{B}}^2 T} \over {3qh^2 }}m^*\left( {{\pi \over {3n}}} \right)^{{2 \mathord{\left/ {\vphantom {2 3}} \right. \kern-\nulldelimiterspace} 3}} \left( {1 + r} \right)\quad .$$
In general, for a given carrier density n, as the effective mass m* increases (S increases), the carrier mobility and consequently the electronic conductivity decreases. Compared to the Seebeck coefficient (S) shown in Fig. 4(b) [where S varies as n −2/3, Eq. (4)], it may be concluded that the carrier concentration in the SPS-processed PbTe remains temperature independent in the temperature range below 450 K, assuming effective mass remains a constant. In the SPS-processed PbTe, the electrical conductivity does not exhibit any local minima below T ∼ 450 K, where the Seebeck coefficient is also a maximum. Hence, we assume that the increase in Seebeck coefficient may not be due to an increase in μ(E) or g(E). Nevertheless, nanostructuring may also enhance the Seebeck coefficient due to potential barrier scattering at the grain boundaries via energy filtering of the low energy charge carriers that may otherwise affect S adversely.Reference Minnich, Dresselhaus, Ren and Chen47 The preferential scattering of the low energy charge carriers increases their average energy, which leads to an increase in the Seebeck coefficient value.Reference Martin, Wang, Chen and Nolas48 A quantitative expression for S arising from potential boundary scattering at the grain boundaries, is given by Kishimoto and KoyanagiReference Kishimoto and Koyanagi49 as
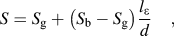 $$S = S_{\rm{g}} + \left( {S_{\rm{b}} - S_{\rm{g}} } \right){{l_\varepsilon } \over d}\quad ,$$
where, d is the grain size, the energy mean-free path l ε is the distance between the barriers, S g is the Seebeck coefficient of the material without grain boundary (d » l ε), and S b is the Seebeck coefficient of the material with grain boundaries (d < l ε) (S b > S g). As evident from the above equation, the enhancement of the Seebeck coefficient in the SPS-processed PbTe nanocubes compared to the bulk PbTe is most likely due to the potential boundary scattering of the charge carriers. A model for Seebeck coefficient enhancement has also been discussed in Popescu et al.Reference Popescu, Woods, Martin and Nolas50 where an increase in the mean energy per carrier may be achieved by altering the physical properties of the grains, namely the potential barrier height, width, or the distance between the grains. In a previous study by Puneet et al.,Reference Puneet, Podila, Karakaya, Zhu, He, Tritt, Dresselhaus and Rao5 preferential scattering of electrons via interfacial charged defects was reported in the SPS-processed few layered Bi2Te3 that gave rise to an increase in the electrical conductivity.
Figure 4(c) shows the temperature dependence of the TE power factor (S 2σ) of the SPS-processed PbTe nanocubes, compared to the reported values. A combination of high Seebeck coefficient S > 400 μV/K and moderately high electrical conductivity, σ ∼ 8000 S/m at 300 K, gives rise to a high power factor ∼1.23 × 10⁻³ W m−1 K−2 at 300 K, which is about twice that of the ball milled PbTe nanograins as well as SPS-sintered PbTe nanowires.Reference Finefrock, Zhang, Bahk, Fang, Yang, Shakouri and Wu40 Furthermore, the power factor of the PbTe nanocubes is almost three times higher than that of the PbTe nanoparticles synthesized by the wet chemical method,Reference Dong, Liu, Li, Su, Tang and Uher35 owing to the comparatively high electronic conductivity in the nanocubes. The power factor steadily decreases with increasing temperature up to about 500 K, above which, a reverse trend is observed. The upturn in the power factor above 530 K arises from the observed upturn in σ at that temperature.
2. Thermal transport
Figure 5(a) shows the total thermal conductivity (κtot) of the SPS-processed PbTe nanocubes in the temperature range T ∼ 300–600 K. The total thermal conductivity (κtot = κl + κe) consists of contributions from both the electrons (κe) and phonons (κl), with a majority of the contribution arising from the phonons. As shown in the figure, the SPS-processed PbTe nanocubes exhibit a low thermal conductivity ∼0.8 W m−1 K−1 at 300 K that is comparable to the SPS compacted PbTe nanowires,Reference Finefrock, Zhang, Bahk, Fang, Yang, Shakouri and Wu40 but significantly lower than the bulk PbTe and the SPS-compacted bare PbTe nanoparticles prepared by the wet chemical method. The scattering mechanism of the charge carriers that enhances the Seebeck coefficient via potential barrier scattering at the grain boundaries also increases the phonon scattering that decreases the lattice thermal conductivity dramatically. This is due to the presence of the nanocube morphology of the SPS-processed PbTe that gives rise to increased phonon boundary scattering at numerous interfaces of the nanocubes. The sizes of nanocubes are well above the mean free path of electrons (∼5 nm). Hence, a significant reduction in the lattice thermal conductivity is obtained without creating much penalty to the electrical conductivity. Using the Wiedemann–Franz relation, where L is the Lorenz number, [Eq. (6)], it is observed that the electronic contribution to the thermal conductivity (κe) is considerably low in the SPS-processed nanocubes, as σ decreases considerably with increasing temperature [Fig. 4(a)]
 $${{k_{\rm{e}} } \over \sigma } = LT\quad .$$
TE performance as function of temperature of the SPS-processed PbTe nano cubes: (a) Thermal conductivity (b) figure of merit (ZT) (c) TE compatibility factor in comparison with state of-the-art.
Consequently, the SPS-processed PbTe nanocubes exhibit a much reduced total thermal conductivity ∼0.8 W m−1 K−1 at 300 K that reduces further ∼0.57 W m−1 K−1 at 550 K.
3. TE performance
Figure 5(b) shows a high ZT ∼ 0.45 at 300 K in the SPS-processed PbTe nanocubes that gradually decreases above 400 K. To the best of our knowledge, this ZT value at room temperature is ∼50% higher than the other reported values of ZT at room temperature in similar nanostructured PbTe alloy compositions.Reference Kuo, Jeng, Ku, Wu, Chou and Hwang37 This enhancement in ZT has been achieved without doping or use of complex processing methods and is attributed to the significant reduction in the lattice thermal conductivity by the influence of nanosized PbTe cubes containing large scale of the grain boundaries effectively scattered various length scales of phonons. An increase in the Seebeck coefficient is also observed owing to the filtering of the low energy charge carriers across the grain boundaries. Consequently, the TE power factor also exhibits considerable improvement at room temperature.
4. TE compatibility factor
Researchers worldwide have been focusing on the temperature dependent electrical and thermal transport properties of TE materials. However, in actual TE device fabrication one has to concentrate on different issues, such as (i) temperature difference (ΔT) and (ii) proper Ohmic contactReference Fan, Mohammad, Kim, Aktas, Botchkarev and Morkoç51 to get maximum charge transfer from device. Moreover, temperature difference can be obtained by maintaining suitable cooling mechanism on the other side of the same leg. As reported in literature, materials may exhibit better output efficiencies when segmented with compatible materials of both p and n-type. Hence, there is a need to identify the compatibility factor of the SPS-processed PbTe nanocubes. In a segmented TE device fabrication, device materials should possess similar compatibility factor in the same temperature range for drawing maximum power output from the device,Reference Snyder and Ursell52,Reference Ursell and Snyder53
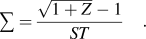 $$\sum = {{\sqrt {1 + Z} - 1} \over {ST}}\quad .$$
The highest efficiency of the TE material in device (determined by ZT) is only achieved when the relative current density u, which is the ratio of the electrical current density to the heat flux by conduction:  $u = {J \mathord{\left/ {\vphantom {J {k\Delta T}}} \right\kern-\nulldelimiterspace} {k\Delta T}}$ is equal to the compatibility factor Σ. In a segmented element, all segments are thermally in parallel and electrically in series to get relative current density (u) throughout the element.Reference Maciá54 To obtain a quantitative idea about the compatibility factor of current PbTe nanocubes, we have plotted the compatibility factor of the PbTe nanocubes in comparison with available literature values [Fig. 5(c)]. The current PbTe material possesses good compatibility factor (1.2 V−1) up to a temperature of 370 K and is comparable to that of the PbTe nanowires. This value is higher than other available materials of similar chemical composition. This enhancement in the compatibility factor is attributed to superior electrical conductivity and low thermal conductivity in SPS-processed PbTe nanocubes.
IV. CONCLUSIONS
In the present investigation, we report a cost-effective, surfactant-free, and scalable synthesis technique for PbTe nanocubes by chemical precipitation method, followed by densification via SPS. The HRTEM studies revealed that the nanoparticles transform into nanocubes with increased reaction time during the synthesis process. The electrical transport measurements of the SPS-processed sample suggest that the electrical conductivity decreases with increasing temperature due to the scattering of charge carriers. The Seebeck coefficient, on the other hand, increases monotonically up to 400 K due to potential barrier scattering at the grain boundaries and exhibits broad maxima over the extended temperature range of 300–425 K. Moreover, thermal excitation of the charge carriers results in a decrease in the Seebeck coefficient with increasing temperature and a conversion of p to n-type semiconducting behavior at 530 K. Finally, significant decrease in thermal conductivity was attributed to effective scattering of phonons at nanoscale features of PbTe cubes and multiple interfaces. Additionally, nanosized dimensionality of cubes has not affected the electrical conductivity adversely, and a moderately high electrical conductivity ∼8000 S/m is exhibited by the SPS-processed nanocubes at 300 K. As a result, a high ZT ∼ 0.45 at 300 K and 0.38 at 400 K has been observed, which is higher than the reported literature values of similar nanostructured alloy compositions at the same temperature. Importantly, PbTe shows good compatibility factor ∼1.2 V−1 up to a temperature ∼370 K as compared to the available materials of similar chemical composition.
Supplementary Material
To view supplementary material for this article, please visit http://dx.doi.org/jmr.2015.227.
ACKNOWLEDGMENTS
This work was sponsored by DAE, BRNS project Grant No. 2010/34/47/BRNS/2317. One of author (B. Khasim Saheb) acknowledges UGC-MANF for the JRF fellowship.