Implications
Intensive feeding systems are used for dairy heifer rearing, mainly because they allow a better control of animal growth and greater BW gains than pasture based diets. In this model study where a competitive situation was maintained over time, subordinate (SUB) heifers ate faster, spent less time ruminating and more time standing than dominant (DOM) ones during the first hours after feed delivery, with no differences in feed intake. Thus, it is expected that heifers will cope with competitive situations differently according to their social position. Further studies are necessary to determine if differences are maintained in heifers reared under commercial conditions.
Introduction
In group-housed domestic ruminants, social hierarchies and competition for feed affect feeding behavior (Grant and Albright, Reference Grant and Albright2001). Social dominance is the relation of dominance/subordination established between individuals maintained by agonistic interactions (Drews, Reference Drews1993) that may affect productive performance and behavior of cattle. In intensive feeding systems, in which animals are fed a total mixed ration (TMR), competition may be high and social dominance may affect animal performance by changing dry matter intake (DMI), feeding behavior patterns or efficiency of feed utilization (De Vries, Reference De Vries2010).
In dairy heifers, when competition for feed is exacerbated, feeding behavior patterns are affected (De Vries and von Keyserlingk, Reference De Vries and von Keyserlingk2009), and the strategies developed by heifers of different social status appear to differ. If competition level is high, when feedbunk space per animal is low, heifers have shorter eating time and reduced daily BW gains (Keys et al., Reference Keys, Pearson and Thompson1978), but most of the authors have not reported differences in total DMI between heifers (Longenbach et al., Reference Longenbach, Heinrichs and Graves1999; De Vries and von Keyserlingk, Reference De Vries and von Keyserlingk2009). In the few studies that determined dominance order when competition level increased, it was reported that DOM cows stay at the feedbunk for longer than SUB cows, increasing their total feeding time (Grant and Albright, Reference Grant and Albright2001; Val-Laillet et al., Reference Val-Laillet, de Passille, Rushen and von Keyserlingk2008). In contrast, low-ranked animals are more often interrupted while they are eating, have shorter periods of consumption, and thus, need to visit more times the feeder than high-ranked animals (cows: Olofsson, Reference Olofsson1999; heifers: González et al., Reference González, Ferret, Manteca, Ruiz-de-la-Torre, Calsamiglia, Devant and Bach2008a and 2008b). When the level of competition is high, to maintain DMI, low-ranked cattle need a higher intake rate than high-ranked ones (Harb et al., Reference Harb, Reynolds and Campling1985; Proudfoot et al., Reference Proudfoot, Veira, Weary and von Keyserlingk2009), and thus, they need to develop alternative behavioral strategies. Moreover, in these situations, SUB heifers spent more time standing and lying during periods where DOM heifers were eating (Olofsson, Reference Olofsson1999) and showed higher variability in BW gains (González et al., Reference González, Ferret, Manteca, Ruiz-de-la-Torre, Calsamiglia, Devant and Bach2008a; Fiol et al., Reference Fiol, Carriquiry and Ungerfeld2017) than DOM ones. It should be noted that most of the above-mentioned studies are all short-term studies or block designs, and DMI was measured as the group mean, and individual differences may be lost.
Social competition is an important stressor (Proudfoot and Habing, Reference Proudfoot and Habing2015); therefore, high levels of competition are associated with high levels of stress in heifers (González et al., Reference González, Ferret, Manteca, Ruiz-de-la-Torre, Calsamiglia, Devant and Bach2008b) and bulls (Gupta et al., Reference Gupta, Earley and Crowe2007). Moreover, individual social status appears to affects the individual’s ability to cope with crowding, influencing the animals’ stress response (Huzzey et al., Reference Huzzey, Grant and Overton2012; Proudfoot and Habing, Reference Proudfoot and Habing2015). If the competitive situation is maintained over time, stress may become chronic, modifying animal’s behavior (Trevisi and Bertoni, Reference Trevisi and Bertoni2008). Behavioral parameters, such as rumination, lying and standing, can be used to evaluate the response of the animal to a situation of chronic stress (Friend, Reference Friend1991; Trevisi and Bertoni, Reference Trevisi and Bertoni2008). In this sense, rumination (Grant and Albright, Reference Grant and Albright2001) and lying (Fregonesi et al., Reference Fregonesi, Tucker and Weary2007) times are reduced in stressed animals or when cows are overstocked at the freestall. In contrast, in overstocked cows and stressed calves standing time may be increased (Fregonesi et al., Reference Fregonesi, Tucker and Weary2007; Wilcox et al., Reference Wilcox, Schutz, Rostagno, Lay and Eicher2013).
The objective of the present study was to compare individual DMI, intake rate and eating, ruminating, lying and standing behaviors in DOM and SUB pre-pubertal dairy heifers maintained under continuous competitive situations. Although in most commercial systems heifers are maintained in larger groups, as a strategy to study the effects of dominance we chose to maintain them in dyads as a model. We hypothesized that SUB heifers maintained under continuous competitive situations have lower DMI, higher intake rate (trying to compensate the decreased on DMI), reduced eating, ruminating and lying time, and increased standing time, compared with DOM heifers.
Material and methods
Animals and housing
The study was performed in the Campo Experimental N°2 of the Facultad de Veterinaria, San José, Uruguay (S 34°40′, W 56°32′) from October 2013 to March 2014 (spring-summer). The animals and the general procedures were the same used in another study that assessed the effects of social dominance on animal performance and metabolic status (Fiol et al., Reference Fiol, Carriquiry and Ungerfeld2017).
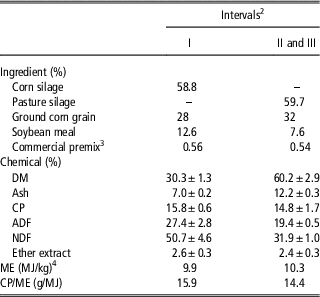
In brief, 16 Holstein (n=12) and Jersey×Holstein (n=4) pre-pubertal heifers (251±10 days of age; 209±14 kg BW; mean±SEM) were allocated into eight homogeneous dyads, according to breed, age and BW. The sample size calculated to obtain a power test >0.80 was 14 heifers (G*Power 3.1, University of Düsseldorf). Heifers were managed in a single group (mixed with other heifers of the same age) and fed a ration plus hay supplementation from weaning (60 days of age) to the beginning of the study. Each dyad was maintained during 120 days (day 0=beginning of measurements) in shed pens (5×8 m) separated 1 m by electrical fences from the adjacent pen. Heifers were fed once daily (between 0730 and 0830 h) a TMR with a 60 : 40 forage:concentrate ratio (Table 1). During the adaptation period (20 days; total duration of the study=140 days) the potential DMI of each dyad was determined. Thereafter, to maximize competition between heifers, the amount of TMR offered to each dyad was restricted 5% upon the potential DMI and supplied on the same feeder (60 cm) throughout all the experiment. We did not find refusals along the study as feeders were empty at the end of the day. During the first 60 days of the study mean temperatures were over 23°C (range 22°C–31°C) and the temperature humidity index was greater than 72 (range 72-86; INIA La Estanzuela, Colonia), which corresponded to mild to moderate levels of heat stress.
Composition, chemical analysis and nutritive value of total mixed rationFootnote 1 fed to pre-pubertal dairy heifers (on dry matter (DM) basis) according to the three intervals of DM intake estimation over the 120 days of the experiment

ME, metabolizable energy.
1 Diet was formulated for 0.800 kg/day average daily gain National Research Council (NRC), 2001.
2 Intervals I, II and III corresponds to days 17-26, 78-87 and 112-120 of the experiment. The total mixed ration composition was the same in intervals II and III.
3 On 100 g contained 0.8 g Rumensin®, 20 g calcium carbonate, 5 g mineral and vitamins premix, 7 g oxide Mg, 36 g sodium bicarbonate, 2 g Procreatin-7®, 5 g salt, 3 g Safmannan®, 21.2 g Semitin.
4 ME, estimated according to NRC (2001).
Within dyad, the DOM and SUB heifer was determined by real time observations of the winning agonistic interactions in each dyad during 15 min immediately after TMR supplied on day 0, twice during the first month of the experiment and then every month afterwards. On the first two determinations, the same four trained observers made the determinations in the eight pairs of heifers to maintain the same criteria and maximize the intra- and inter-observer reliability. Thereafter, one of the four observers made the determination in each pair of heifers. A heifer was considered the winner when displaced physically the other heifer. In most cases the same heifer won all the interactions, but if not, the animal that won more interactions during the 15 min was considered as the DOM, while the other was the SUB.
Behavioral recordings
The general activity pattern of each heifer was recorded by direct real time observation using instantaneous scan-sampling in seven specific days (days 1, 21, 35, 60, 75, 100 and 120) along the experiment. It was expected to find differences on behavioral parameters along the seven sampling days, especially because heifers could have some degree of habituation to the competitive situation that may also differ between DOM and SUB heifers. For each day, scan recordings were performed by the same observer every 10 min for 12 h (total=73 recordings/day), from 0730–0830 h (hour 0=TMR supply) to 1930–2030 h adjusting the beginning and ending time according to sunrise and sunset along the experiment. In each scan, it was recorded if the animal was eating (standing with the head in the trough), ruminating (chewing regurgitated feed, outside the feeder), lying (lying down with chin on the floor or head up) or standing (maintained an upright position on extended legs, without walking). Every time the heifer was recorded ruminating, it was noted if she was doing it standing or lying; therefore this activity was not mutually excluding the others.
Dry matter intake and intake rate
Individual DMI was estimated with the double marker technique (Velásquez et al., Reference Velásquez, da Silva, Sousa, Oliveira, Martins, dos Santos, Balieiro, Rennó and Fukushima2018). The marker technique to estimate DMI uses an external marker to estimate fecal output and an internal marker (naturally occurring in feedstuffs) to estimate dry matter (DM) digestibility (Velásquez et al., Reference Velásquez, da Silva, Sousa, Oliveira, Martins, dos Santos, Balieiro, Rennó and Fukushima2018). In this study, the estimation of fecal excretion and DM digestibility were done with chromium oxide (Cr2O3), as an external marker, and indigestible NDF (iNDF) as internal marker, respectively.
Each animal was orally given a daily 6.0 g bolus of Cr2O3 containing 4.1 g/day of chromium (68.4%, chromium III oxide; Sigma-Aldrich, Buenos Aires, Argentina) during 10 days, on three different intervals along the experiment (I=days 17-26; II=78-87 and III=112-120). Thereafter, animals were observed for a short period of time to ensure that there was no regurgitation. On the last 5 days of each interval, ~400 g of fecal samples were collected directly from the rectum two times/day (Kozloski et al., Reference Kozloski, Netto, de Oliveira, Maixner, Leite, Maccari, Brondani, Bonnecarrère Sanchez and Ferreira de Quadros2006). Samples were collected at different times in different days to consider the daily fluctuation of chromium excretion in feces. All samples were maintained at −20°C until analysis for chromium and DM digestibility. For chromium analysis, samples were dried in an air-forced oven at 60°C until achieved constant weight, and then ground until filtering through a 1-mm screen. Fecal samples were composited by heifer and interval. Chromium concentration on feces was determined on the Laboratorio de Bromatologia e Nutricão de Ruminantes of the Universidad Federal de Santa Maria (Brazil) according to Czarnocki et al. (Reference Czarnocki, Sibbald and Evans1961). Fecal excretion was estimated as chromium intake/chromium concentration in feces.
For DM digestibility, samples of the TMR were also collected daily during the last 5 days of each interval of Cr2O3 administration, composited and stored at −20°C for chemical analysis. Samples of TMR and feces were dried in an air-forced oven at 60°C until achieving constant weight, and then grounded until passed through a 2-mm screen. The iNDF was estimated by in situ incubation. In brief, samples of feces (6 g, in duplicate) and TMR (6 g, in triplicate) were placed in nylon bags (5×10 cm, 25-μm-pore-size bags; Ankom Technology Corporation, Macedon, NY, USA) and incubated in two non-lactating Holstein cows fitted with ruminal cannulas and fed a standard diet (70% alfalfa hay and 30% commercial concentrate) during 12 days (Lee and Hristov, Reference Lee and Hristov2013). Thereafter, the bags were removed from the rumen, manually washed with tap water for 5 min, and frozen at −20°C. Once the incubation series finished, all the bags were thawed and manually washed again until the rinse water was clear, and then dried at 60°C until achieving constant weight. The iNDF was considered as the NDF content in the undigested residue after 12 days of in situ incubation. Determination of NDF in feces and in TMR was performed on the Laboratorio de Nutrición Animal of the Facultad de Veterinaria (Montevideo, Uruguay) according to Mertens (Reference Mertens2002), using a fiber analyzer (Ankom 200/220). Dry matter digestibility was determined as (g iNDF/kg feces−g iNDF/kg TMR)/(g iNDF/kg feces).
Afterwards, considering the fecal excretion and the DM digestibility that were calculated for each heifer, the DMI (g/day) in each interval was determined as fecal excretion/(1−DM digestibility) (Velásquez et al., Reference Velásquez, da Silva, Sousa, Oliveira, Martins, dos Santos, Balieiro, Rennó and Fukushima2018). To calculate the corrected individual DMI, the known amount of TMR offered and consumed by each dyad was weighted by the percentage that represented each heifer individual DMI in the dyad intake (sum of both heifer individual intake) estimated by the double marker technique.
Intake rate (kg/min) was calculated as DMI/total eating time. Days of behavioral recordings that matched with each of the intervals of DMI estimation (day 1, 75 and 120 corresponds to intervals I, II and III of DMI estimation, respectively) were used to calculate the total eating time of each heifer. The eating time of each day of behavioral sampling was estimated assuming that the activity (eating) persisted over the entire 10-min period after the observation.
Chemical analysis of total mixed ration
Composited TMR samples were dried in a forced-air oven at 65°C for 48 h, ground in a hammer mill through a 1-mm screen, and stored at −20°C until chemical analysis. Samples were analyzed for DM by drying at 105°C until achieving constant weight in a forced-air oven according to Association of Official Analytical Chemists (AOAC 1997; method 7.003). Ashes were determined by combusting at 600°C for 2 h (AOAC, 1997; methods 7.009). Total N was assayed by Kjeldahl method (AOAC, 1997; method 984.13); ether extract was determined in a reflux system with ethyl ether for 3 h (Goldfisch fat extractor; Labconco Corporation, Kansas City, MO, USA). Determination of NDF was done according to Mertens (Reference Mertens2002), using heat-stable-amylase and expressed without ash content correction. Concentrations of ADF were determined according to method 973.18 of AOAC (1997).
Statistical analysis
For each of the 7 days of behavioral recording, frequency of each behavior was calculated as the number of times each heifer was observed doing each activity/the total number of scans per day (n=73). Behavioral data of the first 5 h (30 first observations) and the last 6 h (last 36 observations) (related to the moment that the TMR was supplied) were grouped for each day to account for the effects of the moments of greater and lesser competition for feed.
Residuals were tested for a normal distribution using the PROC UNIVARIATE statement (SAS® University Edition; SAS Institute Inc., Cary, NC, USA). Behavioral data were not normally distributed, and were analyzed using the PROC GLIMMIX (SAS® University Edition) with the intercept random and the compound structure or the first-order autoregressive covariance structure, and binomial or Poisson distribution. The covariance structure used was decided according to the Bayesian information criteria, which allowed us to select the best fit covariance matrices for each behavior. For the first 5 h and the last 6 h, the model included the fixed effects of the social status (DOM or SUB), the day as the repeated measure, as well as the interaction between social status×day as main effects, and the dyad and animal (nested within the dyad) as random effects. The individual animal was considered the experimental unit. The heifer’ birth date was included as covariate, and maintained in the model if P<0.2.
Dry matter intake and intake rate were analyzed separately for each interval (interval I, II and III of DMI estimation) by PROC MIXED (SAS® University Edition) with the social status (DOM or SUB) as fixed effect and the dyad as random effect. Significant differences were considered when P⩽0.05 and tendencies as 0.05<P⩽0.10. The results are presented as means±SEM.
Results
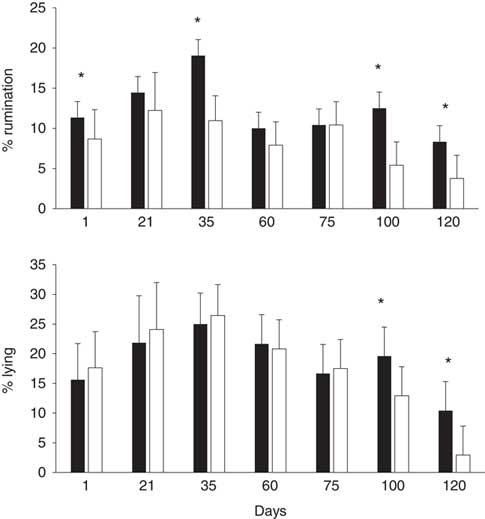
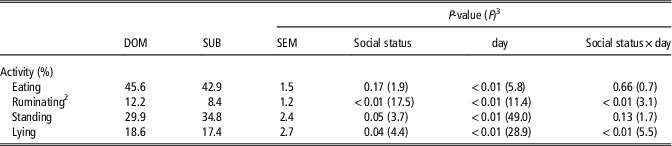
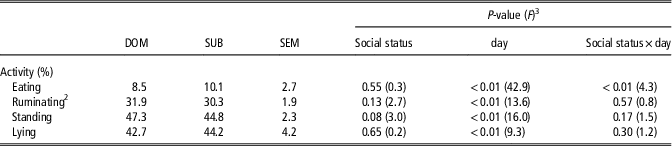
There were no social status effects or interactions between social status and day on the number of times that the heifers were observed eating during the first 5 h (Table 2). Dominant heifers spent more time ruminating (P<0.01) and lying (P=0.04) during the first 5 h than SUB, and there was an interaction between social status and day for both activities (P=0.01; Table 2). The times that the heifers were ruminating and lying were greater in DOM than in SUB heifers on days 1, 35, 100 and 120 and on days 100 and 120, respectively (Figure 1). The number of times that SUB heifers were standing during the first 5 h was greater than that of DOM heifers (P=0.05; Table 2). During the last 6 h no differences were found between social status on the number of times that heifers were observed eating (Table 3), but there was an interaction between social status and day (P=0.001): SUB spent more time eating than DOM heifers on days 21 and 100. Dominant heifers tended to spent more time standing (P=0.08) during the last 6 h than SUB heifers (Table 3). No differences were found in the frequencies of ruminating and lying during the last 6 h according to social status (Table 3).
Frequency of rumination and lying behaviors during the first 5 h of sampling (h0: feed delivery) during 7 days in dominant (n=8; black bars) and subordinate (n=8; white bars) pre-pubertal dairy heifers maintained in dyads during 120 days. A total of 7 days were defined, in which direct observation scan-sampling every 10 min during 12 h was done (total=73 observations per day). *P⩽0.05.

Frequency of general activities (%) during the first 5 h after feed delivery in dominant (DOM; n=8) and subordinate (SUB; n=8) pre-pubertal dairy heifers maintained in dyads during 120 daysFootnote 1

1 Heifers were allocated in dyads and received a total mixed ration daily. Behavior of each heifer was recorded on 7 days along the experiment by instantaneous scan sampling every 10-min for 12 h (total of 73 observations in each day). Hour 0=total mixed ration supply. Values are presented as the mean for the first 5 h ((no. of counted postural or behavioral activities/30 observations)×100) of scan sampling for each day.
2 Every time the heifer was recorded ruminating, it was noted if she was doing it standing or lying, therefore this activity was not mutually exclusive with the others.
3 Degrees of freedom for treatment and error were: 1 and 66 (social status) and 6 and 66 (day and social status×day).
Frequency of general activities (%) during the last 6 h after feed delivery in dominant (DOM; n=8) and subordinate (SUB; n=8) pre-pubertal dairy heifers maintained in dyads during 120 daysFootnote 1

1 Heifers were allocated in dyads and received a total mixed ration daily. Behavior of each heifer was recorded on seven Days along the experiment by instantaneous scan sampling every 10-min for 12 h (total of 73 observations in each Day). Hour 0=total mixed ration supply. Values are presented as the mean for the last 6 h [(No. of counted postural or behavioral activities/36 observations)×100] of scan sampling for each Day.
2 Every time the heifer was recorded ruminating, it was noted if she was doing it standing or lying, therefore this activity was not mutually exclusive with the others.
3 Degrees of freedom for treatment and error were: 1 and 66 (social status) and 6 and 66 (day and social status×day).
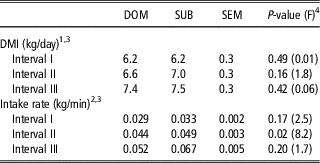
No differences in DMI were found between DOM and SUB heifers along the three intervals of DMI determination (Table 4). Subordinate heifers ate at a faster rate (P=0.02) compared with DOM during interval II (Table 4). No statistical differences were found for intake rate between heifers social status during interval I (P=0.17) or III (P=0.20) (Table 4).
Dry matter intake (DMI) and Intake rate in dominant (DOM; n=8) and subordinate (SUB; n=8) pre-pubertal dairy heifers maintained in dyads during 120 days. Heifers received a total mixed ration daily

1 Individual DMI of each heifer was estimated in three intervals using the double marker technique (Velásquez et al., Reference Velásquez, da Silva, Sousa, Oliveira, Martins, dos Santos, Balieiro, Rennó and Fukushima2018).
2 Intake rate was determined for each interval as: DMI/total eating time.
3 Intervals I, II and III corresponds to days 17-26, 78-87 and 112-120 of the experiment.
4 Degrees of freedom for treatment was 1 and for error: 10, 12 and 14 for DMI in intervals I, II and II, respectively, and 5, 6 and 14 for intake rate in intervals I, II and III, respectively.
Discussion
In this study, SUB heifers ate faster (greater intake rate), and displayed differences in feeding, lying and standing behaviors compared with DOM heifers when maintained under chronic competitive situations. We did not confirm one of our hypotheses, as no differences were found in DMI between DOM and SUB heifers, in agreement with other studies that evaluated feed intake in group of animals subjected to different levels of competition, either when feed was restricted (Keys et al., Reference Keys, Pearson and Thompson1978; Longenbach et al., Reference Longenbach, Heinrichs and Graves1999) or offered ad libitum (González et al., Reference González, Ferret, Manteca, Ruiz-de-la-Torre, Calsamiglia, Devant and Bach2008b; De Vries and von Keyserlingk, Reference De Vries and von Keyserlingk2009). In ruminants, intake rate is a good indicator of social constraints of feeding behavior, and can be modified under restricted feeding (Nielsen, Reference Nielsen1999). Thus, in this study, the greater intake rate could prevented a reduction in DMI in SUB heifers, as reported by De Vries (Reference De Vries2010) when competition at the feedbunk in heifers increased. Although we could not discriminate at which moment there was not more feed, studies have shown that cows consume 63% to 66% of their daily feed intake during the first 6 h after feed delivery (Nikkhah, Reference Nikkhah2011), which agrees with our observations of heifers’ intake. In this sense, differences in eating time were found in the periods of lesser competition for feed (last 6 h after feed delivery), but it is possible that during those last hours of sampling there was no more feed available and that the heifers were not really eating but rather nosing the feedbunk. Considering this, it is interesting to speculate that SUB heifers ate at a faster rate especially during those first hours after feed delivery, when DOM heifers may have monopolized the feedbunk and had more feed available. Thus, under continuous competitive situations, DOM and SUB heifers altered their feeding behavior in different ways.
In addition, differences in intake rate allow us to speculate that DOM heifers were more efficient in selecting small particles like ground corn grain from the TMR than SUB heifers (Greter et al., Reference Greter, De Vries and von Keyserlingk2008). Supporting this interpretation, DOM heifers had greater plasma glucose concentrations than SUB heifers, which can be a consequence of consuming a more energetic diet (containing more corn grain) (Fiol et al., Reference Fiol, Carriquiry and Ungerfeld2017). Finally, a day effect was found on eating time: DOM and SUB heifers decreased their eating frequency during the last 6 h from days 1 to 35 compared with days 60 to 120. This could be related to the fact that heifers became habituated to the handling conditions: they received the feed only once per day, so they had to eat quickly.
Behavioral deviations are sensitive indicators of the animal’s internal state (Friend, Reference Friend1991). Dominant heifers ruminated more than SUB heifers during the first hours after feed delivery, which may be explained by: (1) most SUB heifers started their eating session later than DOM heifers (increased eating time during the last hours after feed delivery in SUB), thus ruminating activity began sooner in DOM than in SUB heifers and (2) DOM coped better with a competitive environment than SUB heifers. In addition, during those first hours after feed delivery more SUB than DOM heifers were standing, while more DOM than SUB heifers were lying. Thus, SUB heifers probably displayed more time the behaviors that may be linked to stress than DOM ones. In accordance with these results, social stress has been shown to be linked to a decrease in the time spent ruminating (Grant and Albright, Reference Grant and Albright2001) and lying (Fregonesi et al., Reference Fregonesi, Tucker and Weary2007), and linked to increased standing time (Wilcox et al., Reference Wilcox, Schutz, Rostagno, Lay and Eicher2013). According to Gupta et al. (Reference Gupta, Earley, Nolan, Formentin and Crowe2008), animals in the standing posture may be less exposed to threats than when lying, or they may be exhibiting a greater active response. Thus, SUB heifers were probably more prepared for further changes – including threats – than DOM heifers. Moreover, social status appears to influence the individual’s ability to cope with situations involving social stress (Huzzey et al., Reference Huzzey, Grant and Overton2012; Proudfoot and Habing, Reference Proudfoot and Habing2015). In this sense, although no differences were found in DMI, DOM heifers increased faster their BW and were more precocious than SUB heifers, which may be also explained by a greater level of social stress in the latter or by different coping strategies according to their social status (Fiol et al., Reference Fiol, Carriquiry and Ungerfeld2017).
Environmental conditions, such as weather, management and housing facilities, influence ingestive behavior of ruminants (Alves et al., Reference Alves, Andrade, Assis, Gurjão, Melo and Souza2017). The duration of time that SUB and DOM heifers remained standing during the first 5 h increased while the duration of rumination decreased from days 1-35 to days 60-120 (standing) and 75-120 (ruminating). In this sense, it has been reported that animals under heat stress increase time standing (Allen et al., Reference Allen, Hall, Collier and Smith2015), and decrease time lying (Zähner et al., Reference Zähner, Schrader, Hauser, Keck, Langhans and Wechsler2004) and ruminating in an attempt to improve heat dissipation (Abeni and Galli, Reference Abeni and Galli2017). Thus, it is possible to speculate that changes in behavior of the heifers along the study were at least partially explained by the prevailing management and weather conditions.
In this study, we tried to maximize feed competition by reducing feedbunk space and restricting the amount of feed provided to let the DOM heifers eat as much as they could and SUB heifers eat what was left. However, according to Longenbach et al. (Reference Longenbach, Heinrichs and Graves1999) feedbunk space in this study was not so small. In addition, 5% restriction of potential DMI assigned to each pair of animals resulted in a low feed restriction because heifers of both social status maintained a very sustained and medium to high average daily gains (Fiol et al., Reference Fiol, Carriquiry and Ungerfeld2017). Previous studies reported no consistent relationship between social rank and stress response among different species (González et al., Reference González, Ferret, Manteca, Ruiz-de-la-Torre, Calsamiglia, Devant and Bach2008b; Miranda-de la Lama et al., 2013). Intensity of the competition may influence those controversial results: in this study the low level of competition imposed could determine that SUB heifers were the most stressed animals, probably because they were trying to increase their social position, while DOM heifers were probably less stressed due to the low intensive competition (Abbott et al., Reference Abbott, Keverne, Bercovitch, Shively, Mendoza, Snowdon, Ziegler, Saltzman, Banjevic, Garland and Sapolsky2003; Miranda-de la Lama et al., 2013). However, we cannot discard other interpretations as different strategies in DOM and SUB heifers to cope with social status.
In conclusion, SUB heifers increased their intake rate with no differences in DMI, spent less time ruminating and lying, and more time standing than DOM heifers during the first hours after feed delivery. Thus, it is expected that when heifers are maintained under a low but continuous competitive situation during the pre-pubertal period, feeding strategy and social behavior differ according to the social position of each heifer. Further studies are necessary to determine if differences are maintained in animals reared in larger groups under commercial conditions.
Acknowledgments
The authors are grateful to Ma. Noel Méndez, Augusto Lacava, Guillermo Matto, Francisco Triay, Annie dos Santos, Ana Maverino, Leticia Eustathiou, Verónica Sánchez, Ignacio Donadio, Stephani Bachini (veterinary students) and Federico de León, Maximiliano Pastorini, Gustavo Cazard, Damián Sosa and Elena de Torres (Campo Experimental), for their help with animal handling and sampling procedures. The authors also thank Dr Gilberto Vilmar Kozloski (UFSM) for his help on data analysis and chromium determination. Financial support: Comisión Sectorial de Investigación Científica (CSIC VUSP_45), Universidad de la República, Uruguay.
Declaration of interest
None.
Ethics committee
Animal care, handling and procedures were approved by the Comisión Honoraria de Experimentación Animal (CEUAFVET-465, CHEA, Universidad de la República, Uruguay).
Software and data repository resources
None.