Introduction
Anxiety disorders are the most common class of psychiatric illness and often start in early childhood (Kessler et al. Reference Kessler, Berglund, Demler, Jin, Merikangas and Walters2005; Merikangas et al. Reference Merikangas, He, Burstein, Swanson, Avenevoli, Cui, Benjet, Georgiades and Swendsen2010). Recent studies suggest that ‘threat bias’, defined as selective attention for threatening v. neutral stimuli, may be related to the etiology of anxiety disorders (MacLeod et al. Reference MacLeod, Rutherford, Campbell, Ebsworthy and Holker2002; Bar-Haim et al. Reference Bar-Haim, Lamy, Pergamin, Bakermans-Kranenburg and van IJzendoorn2007, Reference Bar-Haim2010; Eldar et al. Reference Eldar, Ricon and Bar-Haim2008, Reference Eldar, Apter, Lotan, Edgar, Naim, Fox, Pine and Bar-Haim2012; Shechner et al. Reference Shechner, Rimon-Chakir, Britton, Lotan, Apter, Bliese, Pine and Bar-Haim2014). Unfortunately, however, the neurobiology underlying threat bias remains poorly understood.
Threat bias in anxiety disorders manifests as a ‘vigilance-avoidance’ pattern of attention to threatening stimuli when threatening and neutral stimuli appear simultaneously (Mogg et al. Reference Mogg, Bradley, Miles and Dixon2004; Cisler & Koster, Reference Cisler and Koster2010; Shechner et al. Reference Shechner, Britton, Pérez-Edgar, Bar-Haim, Ernst, Fox, Leibenluft and Pine2012). Consistent with this hypothesis, studies of anxiety disorders generally report an attention bias towards threat (threat vigilance) when stimuli are presented for short durations (Mogg et al. Reference Mogg, Bradley, de Bono and Painter1997; Koster et al. Reference Koster, Crombez, Verschuere, Van Damme and Wiersema2006) and an attention bias away from threat (threat avoidance) at longer durations (Mogg et al. Reference Mogg, Bradley, Miles and Dixon2004; Koster et al. Reference Koster, Verschuere, Crombez and Van Damme2005, Reference Koster, Baert, Bockstaele and De Raedt2010). Functional magnetic resonance imaging (fMRI) studies have identified a number of brain regions, including the ventrolateral and dorsolateral prefrontal cortex, with activity that varies when a target ‘probe’ appears at the location previously occupied by the threatening v. neutral stimulus (Fani et al. Reference Fani, Jovanovic, Ely, Bradley, Gutman, Tone and Ressler2012; Price et al. Reference Price, Siegle, Silk, Ladouceur, McFarland, Dahl and Ryan2014). These activity differences may be related to attention shifts at the time when threatening and neutral stimuli appear and/or when the target appears (Britton et al. Reference Britton, Bar-Haim, Carver, Holroyd, Norcross, Detloff, Leibenluft, Ernst and Pine2012).
Stimulus-driven attention may contribute to the vigilance-avoidance pattern of threat bias (Williams et al. Reference Williams, Watts, MacLeod and Mathews1997; Cisler & Koster, Reference Cisler and Koster2010; Teachman et al. Reference Teachman, Joormann, Steinman and Gotlib2012; Sylvester et al. Reference Sylvester, Hudziak, Gaffrey, Barch and Luby2016). Stimulus-driven attention includes an initial, involuntary shift of attention towards a salient stimulus shortly after it appears, followed by a shift away from the stimulus, a phenomenon referred to as ‘inhibition of return’ (Klein, Reference Klein2000; Corbetta & Shulman, Reference Corbetta and Shulman2002). The initial rapid shift may contribute to early threat vigilance, while inhibition of return may contribute to later threat avoidance. It is less clear, however, how threatening stimuli selectively capture stimulus-driven attention when threatening and neutral stimuli appear simultaneously.
The biased competition model of attention proposes that simultaneously presented stimuli compete for cortical representation, and competition is resolved through bottom-up and top-down factors (Desimone & Duncan, Reference Desimone and Duncan1995; Desimone, Reference Desimone1998). While the short latency of threat bias suggests that bottom-up, rather than top-down factors, bias processing in favor of threatening stimuli in individuals with threat bias, the nature of this bottom-up factor is unclear. A ‘threat-specific’ hypothesis asserts that threatening stimuli inherently elicit more bottom-up, stimulus-driven attention in individuals with threat bias, even when stimuli are presented in isolation. When stimuli appear simultaneously, the threatening stimulus more strongly captures stimulus-driven attention relative to the neutral stimulus, resulting in initial orienting towards the threatening stimulus at short durations (early threat vigilance) followed by inhibition of return at longer durations (threat avoidance). According to an alternative ‘generalized’ hypothesis, stimulus-driven attention is increased for all stimuli, regardless of emotional valence, in individuals with threat bias. In this case, individuals with threat bias exhibit vigilance-avoidance to all stimuli when presented in isolation. The generalized hypothesis asserts that the same process (e.g. increased arousal) that results in increased stimulus-driven attention for all stimuli is also associated with an additional bottom-up factor (such as ascending projections from the amygdala) that biases stimulus-driven orienting towards the threatening stimulus when threatening and neutral stimuli are presented simultaneously.
The goal of this study was to examine whether threat bias is associated with threat-specific v. generalized changes in stimulus-driven attention and face processing. We utilized an existing longitudinal dataset (Luby et al. Reference Luby, Belden, Pautsch, Si and Spitznagel2009a , Reference Luby, Si, Belden, Tandon and Spitznagel b ) that included measures of threat bias in a group of children average age 12.9 years (Sylvester et al. Reference Sylvester, Hudziak, Gaffrey, Barch and Luby2016). The longitudinal dataset also includes neuroimaging during a face-processing task (including neutral, angry, sad, happy, or fearful faces) at three separate time-points spaced about a year apart from each other (Barch et al. Reference Barch, Gaffrey, Botteron, Belden and Luby2012). Importantly, this task presents faces individually, permitting separate measurement of responses to threatening (angry) and non-threatening (neutral) faces. The task measuring threat bias was performed in a behavioral session distinct from the neuroimaging sessions measuring neural responses to faces. We focus on neural response data collected during the third of three existing neuroimaging waves, because this was the wave closest in time to measurement of threat bias.
Prior work in this dataset indicates that our measure of threat bias captured the threat avoidance phase of the vigilance-avoidance pattern of attention (Sylvester et al. Reference Sylvester, Hudziak, Gaffrey, Barch and Luby2016). In our primary analysis, therefore, we compared activity across the brain for individually presented angry and neutral faces in subjects with and without threat avoidance. The ‘threat-specific’ hypothesis predicts that individuals with threat avoidance have increased activity in brain regions that direct stimulus-driven attention following the presentation of angry but not neutral faces relative to individuals without threat avoidance. The ‘generalized’ hypothesis, in contrast, predicts increased activity in regions that direct stimulus-driven attention for both angry and neutral faces in individuals with threat avoidance. Activity in visual processing regions varies with attention (Kastner & Ungerleider, Reference Kastner and Ungerleider2001; Corbetta & Shulman, Reference Corbetta and Shulman2002), and so the ‘threat-specific’ hypothesis predicts that activity in visual processing regions is higher for threatening relative to neutral stimuli at short durations, but lower for threatening relative to neutral stimuli at longer durations (because avoidance occurs at longer durations). As fMRI integrates brain activity over many seconds, and the avoidance phase would dominate over this time frame, the ‘threat-specific’ hypothesis predicts that fMRI activity in visual processing regions is lower for threatening but not neutral stimuli in subjects with threat avoidance. The generalized hypothesis, in contrast, predicts that brain activity is lower for both threatening and neutral stimuli in individuals with threat avoidance relative to controls, because stronger stimulus-driven attention (and hence stronger inhibition of return) is operating for all stimuli.
In follow-up analyses, we examined activity following the onset of sad, happy, and fearful faces. The generalized but not the threat-specific hypothesis predicts evoked activity changes for these additional face types in individuals with threat avoidance. We also examined activity in the second wave of neuroimaging to determine whether results were limited to the time near measurement of threat bias. Finally, we assessed activity in relation to psychiatric history and symptoms. Results inform whether novel treatments for anxiety disorders should target threat-specific v. generalized stimulus processing.
Method
Participants
The Institutional Review Board at Washington University School of Medicine approved all procedures. Informed consent was obtained from parents and assent was obtained from child participants. This study used data from the ongoing longitudinal Validation of Preschool Depression Study (Luby et al. Reference Luby, Belden, Pautsch, Si and Spitznagel2009a , Reference Luby, Si, Belden, Tandon and Spitznagel b ). Children were screened and oversampled for symptoms of depression at age 3–6 years; psychiatric and healthy controls were also obtained. The study sample was therefore enriched with children with preschool-onset depression but also included controls. Three waves of neuroimaging were collected, at mean ages 10.2, 11.7, and 12.9 years. At mean age 12.9 years, n = 77 participated in an additional visit to measure threat bias. Of this subset, n = 52 had high quality fMRI data from the third neuroimaging wave.
Annual diagnoses were determined by parent report on the Preschool-Age Psychiatric Assessment (Egger et al. Reference Egger, Ascher and Angold2003) for children aged ⩽8.0 years and by combined parent and child report (from separate interviews) (Bird et al. Reference Bird, Gould and Staghezza1992) on the Child and Adolescent Psychiatric Assessment (Angold & Costello, Reference Angold and Costello2000) for older children. Continuous measures of depression, anxiety (generalized, separation, social phobia), and externalizing symptoms (attention deficit hyperactivity disorder, conduct disorder, oppositional defiant disorder) were the proportion of symptoms endorsed at the assessment closest to scanning (current symptoms) or by averaging over all assessments up to the time of the scan (lifetime symptoms). IQ was assessed over the last 5 years using either the Wechsler Abbreviated Scale of Intelligence (WASI) or the Kaufman Brief Intelligence Test (K-BIT).
Dot probe task
A dot-probe task (DPT) measured threat bias. A previous study (Sylvester et al. Reference Sylvester, Hudziak, Gaffrey, Barch and Luby2016) used data from this task to extensively characterize threat bias in this cohort in relation to diagnostic categories, continuous measures of symptoms, measures of stimulus-driven attention, and measures of sad bias. The current study is the first, however, to relate threat bias to neuroimaging data. In each trial of the DPT, two faces from the same actor appeared to the left and right of a central fixation cross. One face was neutral while the other was (randomly) angry or sad. After 500 ms, a ‘target’ appeared randomly at the location of the neutral or emotional face, and subjects indicated the orientation (horizontal or vertical) of the target with a button press. After 1300 ms, the next trial began. Subjects completed four blocks of 48 trials. Subjects repeated blocks with accuracy less than 80%. Incorrect trials, trials with reaction time over 3000 ms, and trials with reaction time 2 s.d. from the subject's mean were removed. Threat bias was calculated as reaction time difference for targets at the location of neutral v. angry faces in trials with an angry/neutral pairing. We removed subjects with threat bias 2 s.d. from the sample mean. Subjects with negative threat bias comprised the threat avoidance group (n = 25); the remainder comprised the group without threat avoidance (n = 27).
fMRI task
Subjects performed a gender discrimination task while undergoing fMRI. Children viewed neutral, angry, fearful, sad, and happy faces from 10 individuals from the NimStim dataset (Tottenham et al. Reference Tottenham, Tanaka, Leon, McCarry, Nurse, Hare, Marcus, Westerlund, Casey and Nelson2009). Children also viewed faces that were intermediate, created by morphing the emotional face with a neutral face from the same actor (MorphAge software, Creaceed, Belgium). Responses to full- and half-emotional faces were combined because of no difference in responses (Barch et al. Reference Barch, Gaffrey, Botteron, Belden and Luby2012). Children performed two runs of 45 stimuli, with no stimulus repetition. Stimuli were presented for 2500 ms, followed by an inter-trial interval of 500–6500 ms. Prior to scan, all children went through a negative mood induction technique based on the work of Gotlib and colleagues (Gotlib et al. Reference Gotlib, Sivers, Gabrieli, Whitfield-Gabrieli, Goldin, Minor and Canli2005; Joormann et al. Reference Joormann, Talbot and Gotlib2007; Barch et al. Reference Barch, Gaffrey, Botteron, Belden and Luby2012).
fMRI Scanning
Scanning was performed with a 3 T Tim Trio (Siemens). T1 weighted, sagittal MP-RAGE (TR = 2400 ms, TE = 3.16 ms, flip = 8o, voxels 1 × 1 × 1 mm) and T2 structural images (TE = 96 ms, TR = 5s, 189 × 256 acquisition matrix, 36 slices, voxels 1 × 1 × 3 mm) were acquired. Blood oxygen-level dependent (BOLD) images were acquired with a T2*-weighted asymmetric spin-echo echo-planar sequence (TR = 2500 ms, TE = 27 ms, flip angle = 90°, FOV = 256 mm) in the axial plane paralleling the anterior-posterior commissure, with a 12-channel head coil. During each functional run, 99 sets of 36 contiguous axial images with isotropic voxels (4 × 4 × 4 mm) were acquired.
fMRI pre-processing
Standard pre-processing included: (1) correction for slice-dependent time shifts, (2) removal of the first five frames of data, (3) sinc interpolation to correct for intensity differences attributable to interleaved acquisition, (4) realignment within and across runs to compensate for rigid body motion (Ojemann et al. Reference Ojemann, Akbudak, Snyder, McKinstry, Raichle and Conturo1997), (5) intensity normalization to a whole brain mode (across all TRs and voxels) of 1000, (6) registration of the T1 to a Talairach atlas template (Talairach & Tournoux, Reference Talairach and Tournoux1988) using a 12-parameter affine transform, (7) co-registration of the 3D fMRI volume to the T1 via the T2, (8) transformation of the fMRI volumes to atlas space using a single affine 12-parameter transform that included re-sampling to a 3-mm cubic representation (Ojemann et al. Reference Ojemann, Akbudak, Snyder, McKinstry, Raichle and Conturo1997; Buckner et al. Reference Buckner, Head, Parker, Fotenos, Marcus, Morris and Snyder2004), and (9) spatial smoothing using a 6 mm full-width half-maximum Gaussian filter. Following these steps, to minimize effects of motion, we censored frames with a sum displacement greater than 0.9 mm (Siegel et al. Reference Siegel, Power, Dubis, Vogel, Church, Schlaggar and Petersen2014). Frame-wise displacement was calculated on the basis of the movement parameters used in pre-processing step (4). This measure represents head motion from the previous frame summing across linear and rotational displacements.
fMRI analysis
Data were subjected to a voxel-wise general linear model (GLM) using in-house software (http://www.nil.wustl.edu/~fidl). The GLM included regressors for linear trend and baseline shifts for each run. Separate delta function regressors coded each of the seven time-points following the onset of each face type (35 separate regressors: 5 event types × 7 time-points); no particular BOLD response shape was assumed. Incorrect trials were not included in the analysis.
The BOLD signal at each voxel was the dependent variable in a whole-brain repeated-measures analysis of variance (ANOVA). Time (seven time-points per trial) was the repeated measure, emotion (neutral and angry) was a within-subjects factor, and threat avoidance group was a between-subject factor. Monte Carlo simulations determined that clusters of 13 contiguous voxels with z values > 3.0 provided a whole-brain false-positive rate of 0.05; this same cluster-based threshold was used for all whole-brain analyses. Corrected maps were separated into regions of interest (ROIs). ROIs with poor data quality (<0.05% signal change at peak; activity that did not start and/or finish at baseline suggesting poor modeling) were rejected.
Post-hoc ROI-based analyses averaged BOLD activity across all voxels for each ROI. To test whether results generalized to other emotions, a follow-up ANOVA included time, emotion (sad, happy, fearful), and threat avoidance group as factors. An additional ANOVA included time, emotion (angry, neutral), and psychiatric history (prior history of depression and/or anxiety disorder v. no psychiatric history). Finally, a ROI-based ANOVA on data from a prior wave of neuroimaging (same protocol as above) included time, emotion (angry, neutral), and group as factors.
Ethical standards
The authors assert that all procedures contributing to this work comply with the ethical standards of the relevant national and institutional committees on human experimentation and with the Helsinki Declaration of 1975, as revised in 2008.
Results
Sample
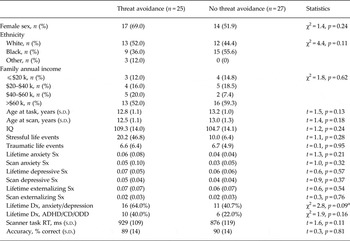
Subjects were divided into those with (n = 25) v. without (n = 27) threat avoidance. Previous work in this sample suggested that subjects with threat avoidance have the vigilance-avoidance pattern of attention to threat (Sylvester et al. Reference Sylvester, Hudziak, Gaffrey, Barch and Luby2016). Table 1 illustrates demographic, diagnostic, and symptom measures for each group. In this subset of subjects with imaging data, there was a non-significant trend for subjects with threat avoidance to have a greater likelihood of lifetime history of an anxiety disorder or depression relative to subjects without threat avoidance. There were no differences in gender, maternal education, family income, or age at behavioral or scanning assessment. There were also no group differences in reaction time or accuracy on the face discrimination task in the scanner. Identical analyses on the full sample with threat bias data (n = 75), including subjects without imaging data, obtained the same pattern of results. In this larger sample, however, subjects with threat avoidance had a significantly greater likelihood of lifetime history of an anxiety disorder or depression (χ2 = 4.8, p = 0.028).
Demographic, diagnostic, and symptom data for subjects with and without threat avoidance

Sx, Symptoms; Dx, diagnosis; ADHD, attention deficit hyperactivity disorder; CD, conduct disorder; ODD, oppositional defiant disorder; RT, reaction time.
a Effect was significant in the larger sample with threat bias data, which included subjects without high-quality imaging data.
Functional neuroanatomy of gender discrimination task
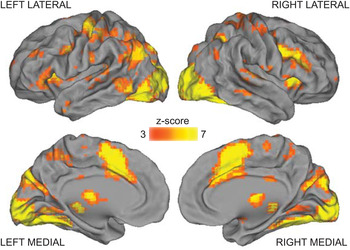
The main effect of time from the voxelwise, whole-brain, omnibus ANOVA (which includes facial emotion, threat avoidance group, and time as factors) detects portions of the brain with significant activity modulations following the onset of faces. As illustrated in Fig. 1, many brain regions displayed significant activity modulations.
Portions of the brain with significant activity modulations following the onset of faces, as determined by a main effect of time. Only results surviving correction for multiple comparisons across the brain are depicted.

Functional activity differences varying by group and facial emotion
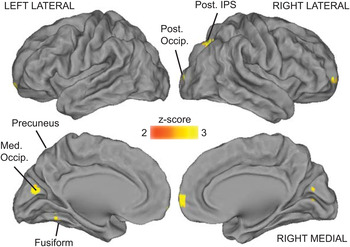
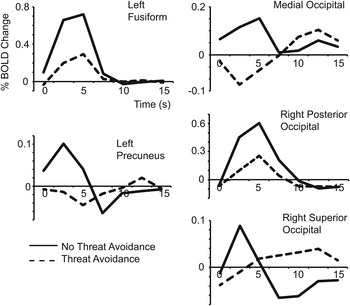
Fig. 2 depicts portions of the brain with differential activity in subjects with threat avoidance v. subjects without threat avoidance following the onset of faces (interaction between threat bias group and time), corrected for multiple comparisons. Significant brain regions derived from this voxelwise, whole-brain analysis are listed in Table 1 and include regions in occipital and posterior parietal and temporal cortices. For all five regions detected, activity was lower following the presentation of neutral and angry faces in subjects with threat avoidance relative to subjects without threat avoidance (see Fig. 3).
Portions of the brain with activity differences (for both angry and neutral faces) between subjects with threat avoidance v. subjects without threat avoidance, as determined by an interaction between threat bias group and time. Only results surviving correction for multiple comparisons across the brain are depicted. Post. IPS, Posterior intraparietal sulcus; Med. Occip., medial occipital lobe; Post. Occip., posterior occipital lobe.

Time-courses of activity following the onset of faces in subjects with threat avoidance and without threat avoidance within regions with activity that varied significantly with threat bias group. Activity is averaged all across trials regardless of facial emotion, as activity did not vary with the emotion of the face.

After correcting for multiple comparisons across the brain, no regions had activity that varied significantly with facial emotion. Specifically, there were no significant interactions between emotion and time; nor were there any significant three-way interactions between group, emotion, and time.
The analyses described above were performed voxelwise across the whole brain and defined five ROIs with activity that varied based on group. The remaining follow-up analyses were performed exclusively on these five ROIs derived from the whole-brain analysis.
Generalizability of results to sad, happy, and fearful faces
We examined activity in the five regions detected above following the onset of sad, happy, and fearful faces. In all five regions, there was a significant interaction between threat bias group and time (see Table 1). As above, activity was lower in each region following the onset of faces in subjects with threat avoidance relative to subjects without threat avoidance. Time-courses are presented in Fig. 3. There were no significant interactions between emotion and time or between group, emotion, and time.
Relationship of functional brain activity to psychiatric history
Additional analyses examined the relationship between activity in the regions detected above and prior history of an anxiety disorder or depression. Activity in the left fusiform (F 6300 = 3.1, p = 0.005) and medial occipital (F 6300 = 2.5, p = 0.021) regions was lower in children with a prior history of an anxiety disorder and/or depression relative to children with no psychiatric history (interaction between diagnostic group and time). When including both threat bias group and psychiatric history group in the same model, however, the effect of psychiatric group was not significant in either region. No three-way interactions (diagnostic group, threat bias group, time) were detected.
We also performed analyses examining relationships between activity in the regions detected above and average symptoms of anxiety over the course of the longitudinal study. Activity in the left fusiform (F 6300 = 2.6, p = 0.016) and medial occipital (F 6300 = 2.8, p = 0.012) regions varied depending on the magnitude of lifetime prior anxiety symptoms. As expected, higher lifetime average anxiety symptoms were associated with lower activity. When including both threat bias group and lifetime anxiety symptoms in the same model, activity in the left fusiform gyrus (F 6288 = 3.1, p = 0.005) remained significantly related to lifetime anxiety symptoms.
Relationship between threat bias and functional brain activity 1 year prior
We examined whether activity evoked by faces at a prior imaging wave (about 1 year prior to the current study) was related to threat bias group in the five regions detected above. Data were available in n = 47 subjects (mean age 11.6 years). Activity in the left fusiform region in this prior wave was significantly related to threat bias group (threat bias group × time interaction: F 61080 = 3.3, p = 0.004). A similar result was present in the medial occipital region at trend-level (F 61080 = 1.9, p = 0.076). As illustrated in Supplementary Fig. S1, in both cases, activity was lower in subjects with threat avoidance relative to subjects without threat avoidance.
Discussion
The goal of this study was to test whether variation in threat bias in adolescents is associated with threat-specific or generalized differences in face processing. Consistent with the generalized hypothesis, activity for both angry and neutral faces was significantly lower across brain regions in the occipital, parietal, and temporal cortices in adolescents with threat avoidance relative to adolescents without threat avoidance. In follow-up analyses, activity was lower in these same regions for happy, sad, and fearful faces in adolescents with threat avoidance. Activity in these regions also varied based on psychiatric diagnostic history and lifetime history of anxiety symptoms, with greater symptoms associated with lower activity. The effect of psychiatric history was eliminated after accounting for current threat bias, with the exception that activity in the left fusiform gyrus remained significantly related to lifetime history of anxiety symptoms. In this same left fusiform cortex region, an area important for face processing (Kanwisher & Yovel, Reference Kanwisher and Yovel2006), activity was also lower for all faces in subjects with threat avoidance in a separate experiment held approximately 1 year prior.
A feasible explanation for current results is that differential brain activity based on threat bias group reflects differential attention for all faces. Previous work suggests that subjects with threat avoidance in the current dataset exhibit the ‘vigilance-avoidance’ pattern of threat bias, and threat bias may be linked to a generalized increase in stimulus-driven attention (Sylvester et al. Reference Sylvester, Barch, Corbetta, Power, Schlaggar and Luby2013, Reference Sylvester, Hudziak, Gaffrey, Barch and Luby2016). One possibility, therefore, is that subjects with threat avoidance exhibited increased stimulus-driven attention to all singly presented faces in the scanner: rapid initial attention (vigilance) followed shortly thereafter by inhibition of return (avoidance). Because most of the time was dominated by the inhibition of return/avoidance phase, subjects with threat avoidance may have had decreased regional brain activity in regions that process visual information for all faces. Because attention was not explicitly manipulated in this experiment, however, we cannot rule out other explanations.
It is significant that subjects who exhibited the vigilance-avoidance pattern of attention selectively to angry faces when angry and neutral faces were presented simultaneously nevertheless demonstrated decreased activity in early visual processing regions for all individually presented faces, regardless of emotion. As detailed above, one possibility is that these individuals have increased stimulus-driven attention for all stimuli, such that they exhibit vigilance-avoidance to all suddenly appearing, individually presented stimuli. These same individuals exhibit threat bias when angry and neutral are presented simultaneously: rapid initial attention to the threatening face followed shortly thereafter by threat avoidance. Because there is no difference in response to individually presented angry v. neutral faces, threat bias must emerge as a result of interactions between the evoked responses to angry and neutral faces when both are presented simultaneously, rather than inherent differences in bottom-up drive. Future studies are required to clarify the nature of competitive interactions between angry and neutral faces in individuals with threat bias.
Brain regions with differential activity based on threat bias were concentrated in early visual processing regions in the occipital, parietal, and temporal cortices. The occipital regions localize to the first portions of cortex that process visual information, and the fusiform gyrus region is important for processing faces (Kanwisher & Yovel, Reference Kanwisher and Yovel2006). Activity in all of these regions is modulated by attention and has been correlated with accuracy of perception (Corbetta & Shulman, Reference Corbetta and Shulman2002; Sylvester et al. Reference Sylvester, Shulman, Jack and Corbetta2007; Hsieh et al. Reference Hsieh, Colas and Kanwisher2012). Notably, we did not detect differences in activity in portions of the brain involved in directing attention. This negative finding may be a result of faces being presented at the same location throughout the study (thus spatial attention was not manipulated). It is also important to note that although the face processing task was associated with significant activity modulations across much of the cerebral cortex (see Fig. 1), only a small subset of regions, all of which are involved in visual processing, showed activity that varied with threat bias. Regions involved in other processes such as goal maintenance, decision making, and the motor response did not exhibit group differences. Additionally, there were no group differences in behavioral performance metrics on the in-scanner face-processing task. Taken together, this pattern of findings strongly argues against a general explanation for group differences in activity in visual processing regions, such as overall decreased task engagement in the threat avoidance group.
If results are indeed driven by increased attentional avoidance of faces in the group with threat avoidance, the current data may elucidate the neurophysiological consequence of this avoidance. Avoidance behaviors are problematic in anxiety disorders, may predispose anxious youth to developing depression later in life (Price et al. Reference Price, Rosen, Siegle, Ladouceur, Tang, Allen, Ryan, Dahl, Forbes and Silk2016), and overcoming avoidance through exposure therapy is a mainstay of treatment (Barlow, Reference Barlow2002). Over time, consistently decreased activity for faces could result in decreased expertise in discriminating the nuances of emotional expression. Given that different facial expressions may communicate different types of threats (e.g. fear may signal an external threat while anger may signal a social threat), decreased activity for all facial emotions could result in general decrements in emotional and interpersonal functioning. Notably, activity was lower in the left fusiform gyrus for subjects with threat avoidance in two separate datasets. In addition to providing a within-study replication, these data suggest that activity may be altered over a prolonged period that is critical for social and emotional development.
It is important to consider results in light of limitations. Sample size was somewhat small, although this concern is mitigated by large effect sizes and a within-study replication. Threat bias measures tend to have poor reliability (Price et al. Reference Price, Kuckertz, Siegle, Ladouceur, Silk, Ryan, Dahl and Amir2015; Waechter et al. Reference Waechter, Nelson, Wright, Hyatt and Oakman2014), and so results should be interpreted as an average effect that can be detected in groups of subjects. Because there was no condition in the imaging task in which non-face objects were presented, it is unknown whether results are specific to faces or would hold for all visual stimuli. The temporal resolution of fMRI, furthermore, does not permit separate measurement of the ‘initial orienting’ and ‘inhibition-of-return’ phases of stimulus-driven attention; future studies could use modalities with faster temporal resolution, such as event-related potentials to make this dissociation. Finally, subjects in the current study had a prior history of depression and/or anxiety rather than ongoing diagnoses. Future studies should determine whether results reflect ongoing psychopathology or adaptive compensations.
The current study demonstrates that variation in threat bias in adolescents is associated with generalized rather than threat-specific variation in face processing. This result replicated in a prior neuroimaging wave from the same study, suggesting that this effect is robust and stable. Given the role of threat bias in risk and etiology of anxiety disorders, these results have important implications for the mechanism and treatment of anxiety disorders. Future studies should test whether targeting general stimulus-driven attention and face-processing mechanisms can serve as treatments for individuals with anxiety disorders.
Supplementary material
The supplementary material for this article can be found at https://doi.org/10.1017/S003329171600310X.
Acknowledgements
This work was supported by the National Institutes of Health (C.S., grant no. T32MH100019), (S.P., grant nos. R01NS32970, R01NS06424), (J.L. and D.B., grant no. R01MH090786); the McDonnell Center for Systems Neuroscience (C.S.); the Taylor Family Institute (C.S.); the Parker Fund for Young Investigators in Psychiatry (C.S.); the McDonnell Foundation Collaborative Activity Award (S.P.), and Blueprint (D.B.).
Declaration of Interest
Dr Barch has served as a consultant for Takeda, Roche, Pfizer, and Amgen for work outside the scope of the current manuscript. Dr Luby receives book royalties from Guilford Press for work outside the scope of the current manuscript.