


Introduction
The U.S. Department of Agriculture's landmark 1980 report on organic agriculture proposed a large number of policy and research recommendations, many of which have seen action (USDA, 1980). Policymakers have adopted national organic standards and certification requirements and, as a result, the market for organic food has grown to US$28 million in 2012 (Greene, Reference Greene2013), up from US$3.6 million in 1997 (Dimitri and Lohr, Reference Dimitri and Lohr2007). Agronomists and other agricultural scientists have evaluated organic cropping systems, sometimes in comparison to their non-organic counterparts, in terms of yield, soil health and environmental impacts (for example, see Mäder et al., Reference Mäder, Fliebbach, Dubois, Gunst, Fried and Niggli2002; Pimentel et al., Reference Pimentel, Hepperly, Hanson, Douds and Seidel2005; Crowder et al., Reference Crowder, Northfield, Strand and Snyder2010; and Seufert et al., Reference Seufert, Ramankutty and Foley2012). However, economists or other social scientists arguably have not followed through on recommendations to assess the socio-economic impacts from increased levels of organic agriculture. In particular, questions linger about the economic impact of organic agriculture on local economies because, while often small in scale, organic farming is argued to benefit local economies (more than non-organic farms) because money spent on generally higher amounts of labor may stay within the local economy (Lockeretz, Reference Lockeretz1989) and/or because organic farms may capture more added value or use a shorter supply chain (Banks and Marsden, Reference Banks and Marsden2001; Darnhofer, Reference Darnhofer2005). In general, the economic impact of organic agriculture on local economies has not been evaluated in a systematic, empirical study. This paper attempts to address this gap by assessing the impact of increased levels of organic agricultural activity, all else equal, on county-level economic indicators using a treatment effects empirical model.
Certainly, some studies attempt to link organic agriculture to regional economic development. Pugliese (Reference Pugliese2001) and Banks and Marsden (Reference Banks and Marsden2001) argue that organic farming (or agroecology) is linked to sustainable rural development, but do not analyze the hypothesized links empirically, except perhaps by case studies. Darnhofer (Reference Darnhofer2005, p 308) uses a case study to conclude that organic farming can support a ‘reconfiguration of on-farm activities’, which can itself lead to ‘greater involvement in the local economy.’ On the other hand, Lobley et al. (Reference Lobley, Butler and Reed2009, p. 733) say that data reveal no significant differences in the ‘economic connectivity’, at an aggregate level, between organic and non-organic farms. Despite these efforts from sociologists and other social scientists, we find that the impact of the organic activity on general economic indicators is not widely addressed in the existing empirical literature. Thus, we still do not know if increased levels of organic agriculture activity could be thought of as a rural economic development tool.
The first step toward a systematic investigation of economic impacts is to define what we mean by increased levels of organic activity. For this effort, we rely on spatial modeling tools and particularly focus on the Local Moran's I statistic to help identify organic hotspots or clusters. The Local Moran's I is a test statistic that is used to test the null hypothesis of no spatial autocorrelation across geographic neighbors. In this paper, we look for cases where we reject the null hypothesis and thus identify ‘hotspots’, areas that combine a high level of organic activity and a high value of positive correlation with neighbors. We also could consider ‘coldspots’, areas that combine a low level of organic activity and positively correlated neighboring values. For empirical reasons, we use a U.S. county as our geographic scale.
Once county-based hotspots are identified using spatial statistics, we then estimate the effect that being in a hotspot has on county-level economic indicators, thereby providing estimates of the impact of organic operation hotspots. In order to differentiate the effects of hotspots of organic operations from those of other types of establishments, we also analyze and compare the effects of hotspots of agricultural establishments in general. When estimating these effects, we take care to control for potential endogeneity regarding hotspot formation. In other words, we consider the strong possibility that some underlying factors may be responsible for both hotspot formation and positive economic impacts. After accounting for potential non-randomness in the formation of hotspots, we estimate the treatment effects due to being in a hotspot for two county-level economic indicators, the county's poverty rate and its median household income. In both cases, we find that organic hotspots have beneficial effects: We find that being in an organic hotspot lowers a county's poverty rate by as much as 1.6 percentage points and increases median household income by over US$1600. Our research, we believe, is the first to systematically estimate the economic impact of organic hotspots, and the first to consider organic hotspots as an endogenous treatment, thereby accommodating potential selection or systematic biases caused by confounding factors that have multiple effects.
Background on clustering and organic
Much of the research on hotspot formation, or clustering of firms and industries, generally find that clustering can be advantageous to economic development. Specifically, Morrison Paul and Seigel (Reference Morrison Paul and Seigel1999), Chevassus-Lozza and Galliano (Reference Chevassus-Lozza and Galliano2003), Cainelli (Reference Cainelli2008), Greenstone et al. (Reference Greenstone, Hornbeck and Moretti2010), Duranton and Puga (Reference Duranton and Puga2004) and Graham and Kim (Reference Graham and Kim2008) discuss the industry-level scale economies brought on by agglomeration externalities, while Glaeser et al. (Reference Glaeser, Kallal, Scheinkman and Shleifer1992), Greenstone et al. (Reference Greenstone, Hornbeck and Moretti2010), Gibbs and Bernat (Reference Gibbs and Bernat1997), Henderson (Reference Henderson1997), Gabe (Reference Gabe2009) and Feser et al. (Reference Feser, Renski and Goldstein2008) discuss the advantages of clustering for local growth (e.g., growth of employment/wages, industries and business activity within a city/county). Gabe (Reference Gabe2004) and Rocha and Sternberg (Reference Rocha and Sternberg2005) find that agglomeration encourages investment and entrepreneurship, respectively, in affected industries.
The economic intuition behind why clustering is beneficial to economic development is primarily centered on positive agglomeration externalities. For example, agglomeration implies a higher availability and specialization of inputs (e.g., workers and suppliers) and the opportunity for information sharing and knowledge spillovers, which can lead to cost reductions and advantages in competition (e.g., Barkley and Henry, Reference Barkley and Henry1997 and Duranton and Puga, Reference Duranton and Puga2004). It also implies a quicker flow of goods, which leads to more efficient industry organization (e.g., Barkley and Henry, Reference Barkley and Henry1997). Clustering may also promote local economic and business growth because manufacturers may want to take advantage of the existing agglomeration externalities. Additionally, agglomeration externalities (e.g., higher availability of inputs) may lead to fewer barriers to entry, which can promote innovation (e.g., Delgado et al, Reference Delgado, Porter and Stern2012 and Gabe, Reference Gabe2009).
Clustering is frequently investigated in the food and agriculture sectors. For example, Goetz (Reference Goetz1997) finds that state-level agglomeration economies are present in most of the food manufacturing industry, and Chevassus-Lozza and Galliano (Reference Chevassus-Lozza and Galliano2003) find that agglomeration economies encourage exportation and give firms advantages in competition in the French food industry. Although research on clustering in the food and agriculture industry, in general, is prevalent, it is important and interesting to address the organic food sector separately, as a special case of agriculture. First, Marasteanu and Jaenicke (Reference Marasteanu and Jaenicke2016) demonstrate that while hotspots are present in the organic sector, they are not consistent with those of agricultural operations in general. In addition, operations in the organic sector display different characteristics from those of the conventional food industry, including more restricted production methods (National Organic Program, 2016), need for more specialized labor (Klonsky and Tourte, Reference Klonsky and Tourte1998) and more frequent use of their own resources (Argiles and Brown, Reference Argilés-Bosch and Brown2007; and Schmidtner et al., Reference Schmidtner, Lippert, Engler, Haring, Aurbacher and Dabbert2012). The organic food industry is also growing at a quicker rate than the conventional food industry, with organic cropland more than doubling between 1997 and 2005 (Dimitri and Oberholzer, Reference Dimitri and Oberholzer2009). These factors imply that organic operations may see a more significant impact from clustering (e.g., they may have a greater need for or ability to take advantage of agglomeration externalities brought on by clustering).
Some research also suggests that the organic industry may impact local economies more strongly than the general agriculture industry. For example, Donald and Blay-Palmer (Reference Donald and Blay-Palmer2006) suggest that a rise in consumption of organic products may help local economies by boosting the demand for local products, as well as creating viable career paths by providing opportunities for more intensive labor involvement. They, along with Markusen et al. (Reference Markusen, Wassall, DeNatale and Cohen2008), also discuss the organic industry in the context of the ‘creative economy,’ which suggests that cultural amenities (including organic products) may attract individuals to an area due to their ‘high status,’ thereby promoting growth.
With a few exceptions, however, the specific impact of clustering on the organic sector has not, to our knowledge, been widely addressed. Two examples of the scarce literature on this topic are Naik and Nagadevara (Reference Naik and Nagadevara2010), who find economic benefits to clustering in organic farming in Karnataka, India; and Jaenicke et al. (Reference Jaenicke, Goetz, Wu and Dimitri2009), who find that clustering positively impacts the output (in sales per employee) of organic handling firms in the USA.
Hotspot identification
To identify organic hotspots, we follow Marasteanu and Jaenicke (Reference Marasteanu and Jaenicke2016), who use the Local Moran's I to identify statistically significant hotspots (positively correlated counties with high attribute values), cold spots (positively correlated counties with low attribute values) and outliers (negatively correlated counties) of organic and agricultural operations. The Local Moran's I test statistic, which is used to test the null hypothesis of no spatial autocorrelation, is defined as follows (Anselin, Reference Anselin1995; Lesage, Reference Lesage1998; and Anselin, Reference Anselin1999):
 $$I_i = (x_i - \bar X){\rm \Sigma} _{\,j \ne i} w_{ij} (x_j - \bar X)$$
 $$x_i = {\rm attribute\; level\; for\; section},\,\; i$$
 $$\bar X = {\rm mean\; attribute\; level\; for\; entire\; area}$$
 $$w_{ij} = {\rm weighting\; value\; between\; sections}\; i\; {\rm and}\; j,$$
where the sections are US counties, the entire area is the USA, the attribute level for county i is the count of organic operations, and the weighting matrix is a queen contiguity matrix (which assigns the weight between two counties as 1, if they have a shared border, adjacent or corner, and as 0 otherwise). We determine the statistical significance of the Local Moran's I using a permutation method implemented in GeoDa (GeoDa Center). In order to better interpret our results and facilitate a comparison, we also identify hotspots for general agricultural farms.
Figure 1 shows hotspots for all certified organic production (crops and livestock) operations and all certified organic handling operations, respectively, while Figure 2 combines those categories to show a map of hotspots for all certified organic operations. The maps include ‘coldspots’ as well; however, coldspot variables are not used in the estimation that follows. One reason for separating organic production operations from handling operations is for a cleaner comparison with general agriculture, where information is available only for agricultural production establishments and not handlers. Figure 3 shows hotspots for agricultural production establishments. All hotspots are obtained using the Local Moran's I statistic and a queen contiguity matrix.Footnote 1 Figure 1 shows three large areas of organic hotspots along the West coast, in parts of the Midwest and in the Northeast, and smaller area of hotspots in the West. There are large areas of organic coldspots that encompass almost the entire south, and some smaller areas in the West, Midwest, Alaska and Hawaii, and outliers are scattered throughout the country. With the exception of a few organic handling hotspots in Florida, the location of hotspots and coldspots are similar after dividing organic operations into production and handling, with some variation in the size of the clusters. Comparing Figures 1 and 2 with Figure 3 suggests that hotspots of agricultural farms do not necessarily match to hotspots of organic operations, with a larger area of agricultural hotspots in the South, hotspots of agricultural farms existing in Florida, and fewer hotspots of agricultural farms in the Northeast.
Hotspots, coldspots and outliers of all organic operations (based on operation counts)*. *Notes: gray = not significant; red = hotspot, blue = coldspot, purple = low–high, pink = high–low.

Hotspots, coldspots and outliers of organic operations: Production and Handling*. *Notes: gray = not significant; red = hotspot, blue = coldspot, purple = low–high, pink = high–low.

Hotspots, coldspots and outliers of all agricultural farms*. *Notes: Gray = not significant; red = hotspot, blue = coldspot, purple = low–high, pink = high–low.

Methods: Identification of treatment effects from hotspots
To analyze the effect of being in a hotspot on county-level economic indicators, we characterize a hotspot as a ‘treatment,’ and we measure the impact of the treatment on a county's economic indicators. Using the hotspots obtained through the Local Moran's I method described above, we create a county-level indicator variable (our treatment variable), which takes a value of 1 if the county is identified as being part of a statistically significant hotspot, and 0 otherwise. In order to identify causal effects, we calculate the average treatment effects (ATEs):
The ATE is given by Cameron and Trivedi (Reference Cameron and Trivedi2005):
 $${\rm ATE} = E[y_{\rm 1} \vert x,\,D = {\rm 1}]-E[y_0 \vert x,\,D = 0],$$
and the ATE on the treated is given by:
 $${\rm ATET} = E[y_{{\rm 1}i} \vert D_{\rm i} = {\rm 1}]-E[y_{0i} \vert D_i = {\rm 1}].$$
The indicator variable, D, represents the treatment which is represented by our hotspot indicator variable described above, x represents a matrix of characteristics that are associated with the outcome, y 1i represents the outcome when the treatment is applied, and y 0i represents the outcome when the treatment is not applied. Our outcome variable is a county-level economic indicator, and we estimate two different specifications of the model. Model 1 uses the county-level poverty rate and model 2 uses the county-level median household income as the outcome variables. The vector x is a matrix of county-level variables that are consistent with the literature on factors associated with economic growth.
We do not observe what the value of the outcome would be for treated individuals were they not treated, and vice versa; however, an important assumption in treatment evaluation models, the conditional independence assumption, states that the outcomes are independent of the treatment, conditional on the x matrix. Here, conditional independence means that we model a scenario in which the treatment is random (Cameron and Trivedi, Reference Cameron and Trivedi2005). We focus first on an econometric method of ensuring that the conditional independence assumption holds. Namely, we characterize the treatment variable i.e., the hotspot indicator, as a potentially endogenous binary variable and propose an auxiliary equation that explains any non-randomness in its selection. To adequately identify the selection condition, we must incorporate variables in this auxiliary equation that affect the hotspot variable but not the outcome variable. For example, characteristics of organic certification measured at the county-level may impact the presence of organic hotspots but not the county-level economic indicators. This instrumental-variable method, therefore, helps ensure that the estimated treatment effect is free from non-random selection bias.
Our treatment effects model becomes:
 $$y_{ti} = {\bi x^{\prime}}_i \beta _t + \mu _{ti} $$
where t indexes the treatment status (which takes a value of 1 if the observation is treated, and 0 otherwise), and i indexes the observation. To account for the potential endogeneity of the treatment variable, we also consider the following auxiliary equation:
 $$D_i^{^\ast} = {\bi z^{\prime}}_i \gamma + \varepsilon _i $$
 $$D_i = 1\; \;{\rm iff}\; D_i^{^\ast} \gt 0$$
 $$D_i = 0\;{\rm \; iff}\; D_i^{^\ast} \le 0$$
where  $D_i^* $ is a latent variable that may represent the actual level of organic activity, and D i is a dummy variable that takes a value of 1 if the treatment is implemented, and 0, otherwise. The matrix, z, represents variables that explain D i. To specify z, we generally follow Marasteanu and Jaenicke (Reference Marasteanu and Jaenicke2016), who model organic hotspot formation as a function of county-level factors. We take care to include at least one variable in z that is uncorrelated with y 1i and y 0i except through D i (Cameron and Trivedi, Reference Cameron and Trivedi2005).
Despite efforts to remove any non-random selection bias from the treatment effect results, at least two empirical problems may still hamper our estimation. First, because hotspots may affect their non-hotspot neighbors, we run the risk of violating the Stable Unit Treatment Value Assumption, which states that the treatment should not indirectly affect non-treated observations (Cameron and Trivedi, Reference Cameron and Trivedi2005). For example, a violation would occur if the treated counties (i.e., organic hotspots) benefit at the expense of neighboring counties that are not also hotspots. More specifically, a violation might occur if organic hotspot counties used labor from any neighboring, non-hotspot, counties, thereby diminishing the labor sources and/or diminishing the economic activity of these counties. To address this potential violation, we drop the observations for non-hotspot counties that are neighbors to hotspot counties.
Secondly, even after selection bias is accounted for, identification of the treatment effect can be compromised by potential simultaneity or endogeneity of regressors in x. To account for this possibility, we use time lags where the D i variables (i.e., the hotspot indicators) and x variables are from 2009 and earlier, while the economic outcomes represented by y (i.e., the county-level economic indicators) are from 2011 to 2012.
We also construct a comparison of estimated ATETs from hotspots of organic operations against hotspots found in general agricultural operations. More specifically, our specified model of ATETs for general agriculture hotspots is as close as possible to the model described above for organic hotspots. One difference, however, is that our auxiliary equation for general agricultural hotspots does not include variables reflecting county-level organic certification efforts.
Data
To obtain data on county-level factors affecting economic growth and development (i.e., the independent variables that comprise x), as well as on factors affecting the presence of clusters and organic and agricultural operations (the instrumental variables that comprise z), we use publicly available sources such as the U.S. Census, the Bureau of Labor Statistics, the USDA's Census of Agriculture and the USDA's Agricultural Resource Management Survey (ARMS).
Data on certified organic operations, the root source of the organic hotspot variables, come from the National Organic Program (National Organic Program, 2012) and are publicly available online. The NOP maintains a directory of all certified organic operations, including information such as operation's name, certifying agent, primary scope (i.e., handling, crops and livestock), address and products produced. Approximately 60% of the operations list crops as their primary scope, while 28.5% list handling. An additional 11.4% list livestock, and <1% list wild crops as their primary scopes. Data on county-level variables related to infrastructure, demographics, politics and economic activity come from the U.S. Census and the USDA's Census of Agriculture. We also examine publicly available information on certifying agents’ websites to construct additional county-level variables reflecting the prominence of outreach activities among the operations’ organic certifiers, and we construct a similar variable reflecting the prominence of government agency certifiers. Data on general agricultural operations come from the 2007 U.S. Census of Agriculture, which provides information on the number of agricultural farm operations in each U.S. county.
Table 1 lists the variables we use in our analysis (including description, summary statistics and source). Tables 2 and 3 offer explanations as to how the variables are expected to affect economic growth and hotspot formation, respectively, based on rationales found in the existing literature. Note that while there is overlap between Tables 2 and 3 variables, Table 3 has additional variables necessary to identify the selection equation.
Variable description and summary statistics

a Several counties are dropped in this analysis, as we do not include Alaska and Hawaii, and are also necessitated to drop a few counties in the continental USA due to missing data.
b Lower UIC means higher level of urban influence (USDA's Economic Research Service, 2003).
c Calculated as
 $$IE_i = - \sum\nolimits_j^n {\,p_{ij} \log _2 p_{ij}}, p_{ij} = \displaystyle{{RCA_{ij}} \over {\sum\nolimits_k^n {RCA_{ik}}}}, RCA_{ij} = \displaystyle{{EMP_{ij} \cdot \sum\nolimits_{s,t} {EMP_{st}}} \over {\sum\nolimits_s {EMP_{sj} \cdot \sum\nolimits_t {EMP_{it}}}}} $$
where EMP ij is the number of employees of industry j in the county i and n is the number of industrial sectors in US economy. High IE means higher diversity (Goetz et al., Reference Goetz, Han, Findeis and Brasier2010).
Factors affecting regional economic growth/development

Factors affecting the presence of hotspots

We choose the independent variables in the outcome equation (Table 2) based on how well they fit into the following rationales: (1) Human capital, which suggests that the amount and quality of human capital impacts regional wealth; (2) Resources, which suggests that the presence and efficient use of resources may impact regional development; (3) Market, which suggests that factors related to market size and access, as well as consumption ability may affect regional development; (4) Scale, which suggests that large scale agricultural production may negatively impact regional welfare; (5) Government and policy, which suggests that policy priorities and effectiveness may impact regional growth; and (6) Economic diversification, which suggests that there is significant relationship between things such as agrotourism, organic farming, conservation and landscape management, and regional development. The following variables account for the relationship the above six rationales may have with the economic outcome indicators.
Land_values_07 fits into the human capital rational as amenities and high values of land and buildings will aid a region in attracting and retaining human capital. This variable also fits into the resources rationale as rural areas that have more natural amenities can better manage their resources. Highschool09 fits into the human capital rational as education is an indicator of human capital. Pop_density_07, Dist_highway_km, and Urban_influence_code_03 fit into the resources rationale, as lower populations, larger distances from highways, and a lower level of urban influence may indicate protection from sprawling development, often detrimental to natural resources. These three variables also fall into the market rationale, as higher population densities, a smaller distance from a highway, and a higher level of urban influence may indicate a higher level of market access. Avg_farm_income_07 also falls into the market rationale, as higher levels of farm income may imply higher market access. This variable also fits into the agricultural scale rationale, as higher levels of farm income may imply larger scale agricultural operations. Finally, Indus_entropy_indx_00 fits into the economic diversification rationale, as it captures the diversity of industries in a region.
We choose the independent variables in the selection equation (Table 3) based on how well they fit into the following rationales: (1) Certifiers, which suggests that certain services provided by organic certifiers (e.g., outreach efforts) may be indicative of the level of communication between organic operations, which may encourage the formation of hotspots; (2) Policy, which suggests that state-level fiscal policies, including taxes, may impact the formation of organic clusters; (3) Work-force heterogeneity, which suggests that economic diversity may be related to organic activity; (4) Resources/supply, which suggests that natural amenities and labor supply may be associated with organic activity; (5) Demand conditions, which suggest that factors related to market size, access and receptiveness to organic are associated with organic activity; and (6) Opportunity cost, which suggests that having many amenities may imply a high opportunity costs for using them for organic farming. The following variables account for the relationship the above six rationales may have with the formation of hot spots.
Cert_outreach_30pct_09 and Cert_govt_30pct_09 fall into the certifiers rationale, as they capture outreach activities and diversity of activities, which may encourage organic hotspot formation. Property_tax_per_cap_02 falls into the policy rationale as it represents state-level fiscal policies. Indus_entropy_indx_00 falls into the workforce heterogeneity rationale, as it represents the diversity of industries. Land_values_07, pop_density_07, and natural_amenities_scale all fall into the resources/supply category, as they are indicative of the presence of resources, labor supply and the availability of natural amenities, respectively. Avg_farm_income_07, Urban_influence_code_03, Distance_to_interstate_07, Pop_density_07, and Politics_green_00 all fall into the demand conditions rationale, as they indicate demand for agricultural goods, proximity to urban areas and urban influence, and receptiveness to organic. Land_values_07 and Natural_amenities_scale fall into the opportunity cost rationale, as they indicate the value of land and amenities in a region.
To be confident in our specification, we check if our models satisfy the balancing hypothesis, which implies that the treatment is random for a given probability of treatment, conditional on the selection variables (the matrix, z). This means that the matrix x of treated and control units with the same probability of treatment should be identical (Becker and Ichino, Reference Becker and Ichino2002). More specifically, if the balancing conditions are met, we fail to reject the null hypothesis that the difference between the treated and non-treated counties in terms of the values of Land_values_07, Indus_entropy_indx_00, Pop_density_07, Urban_influence_code_03, and Distance_to_interstate_07, and Avg_farm_income_07 is 0. This implies that there is no significant difference between counties that are in organic hotspots, and counties that are not in organic hotspots in terms of these variables. To do this, we look at the standardized differences and variance ratios of Land_values_07, Indus_entropy_indx_00, Pop_density_07, Urban_influence_code_03, and Distance_to_interstate_07, and Avg_farm_income_07 between the treated and non-treated groups (Linden, Reference Linden2016). We first run a probit regression, using the treatment variable as the dependent variable, and the selection variables as the independent variables. From this, we calculate the predicted probability of treatment and use it to weight our data. We then calculate the standardized differences and variance ratios using the weighted data. While these comparisons do not yield a test statistic that can be deemed significant or not, we refer to Linden (Reference Linden2016), which suggests that a standardized difference >0.2 implies imbalance, and a variance ratio >2 and <0.5 implies imbalance. The balancing conditions are satisfied for all models presented (see Table 6).Footnote 2
Results: ATEs
Tables 4 and 5 show the results of instrumental variable treatment effects regression with the county-level poverty rate and with the county-level median household income, respectively, as the outcome variables. In both models, four types of hotspots: (i) organic hotspots, (ii) organic production hotspots, (iii) organic handling hotspots, and (iv) agricultural farm hotspots, are employed as the binary treatment variable. Shortly, we will discuss the full set of estimation results shown in these two tables, which are the two treatment effect models using the poverty rate and median household income as the outcomes and four types of hotspots as the treatments, as well as the auxiliary selections equations in each case. However, we first discuss the outcome of interest, the ATET estimates for all model combinations.
Instrumental variable treatment effects model 1: County poverty rate

Notes: *, ** and *** denote statistical significance at the 90, 95 and 99% levels.
Instrumental variable treatment effects model 2: County median household income

Notes: *, ** and *** denote statistical significance at the 90, 95 and 99% levels.
Balancing conditions: hotspots

Overall, the ATET estimates show that organic hotspots generally have beneficial effects on local economies. For model 1, Table 4 shows that the ATET is negative and significant when organic production hotspots or all organic hotspots are used as the treatment variable. These two treatments reduce the county-level poverty rate by about 1.6% each. The ATET for a treatment defined by organic handling hotspots is not significantly different from zero. The ATET for the fourth treatment variable, defined by general (non-organic) agriculture hotspots, is not significantly different from zero. For model 2, county-level median household income, Table 5 shows that ATET is positive and significant when all three types of organic hotspots define the treatment variable. Organic production hotspots raise county-level median household income by nearly US$820; hotspots based on all organic operations increase income by nearly $1615; and organic handling hotspots increase income by over US$2373. On the other hand, general agriculture hotspots do not lead to a statistically significant increase in the county-level median household income. The two tables also show that the ATE for the entire sample (both treated and untreated counties) has similar statistical significance to ATET, except for the negative and significant value for the effect of organic handling hotspots on the poverty rate. In general, the ATEs have a stronger effect (as in more positive or more negative), with the exception of the effects of organic handling and organic hotspots on median household income.
While the comparisons of the ATETs are the results of interest, we also discuss the covariates of the outcome and selection equations. The coefficient estimates in each outcome equation are, with few exceptions, consistent across the different organic hotspot treatments. In general, the coefficient estimates for the general agriculture hotspot treatment also yields similar results, at least in terms of the sign if not significance. We discuss these results separately for the two models, and then discuss the selection equation results.
Model 1: County-level poverty rate
For model 1 shown in Table 4, the positive and significant coefficients for Urban_influence_code_03 is consistent with the market access rationale, while the positive and significant coefficient for Pop_density_07 is consistent with the protection from urban sprawl rationale. The positive significant coefficient for Indus_entropy_indx_00 is consistent with the rationale that specialization benefits economic growth, while the negative and significant coefficient for Highschool09 is consistent with the human capital rationale. The negative significant coefficient for Land_values_07 and Avg_farm_income_07 (negative and significant at 10% for the agricultural farms treatment) are consistent with the resources and market access rationales, respectively.
Model 2: County-level median household incomeFootnote 3
Shown in Table 5, the results of model 2 are consistent with the same rationales as model 1, with the exception of Pop_density_07, which is no longer significant. Because, unlike the poverty rate, which is inversely related to economic growth, median household income is positively related to economic growth, and the directions of the coefficients in model 2 are opposite those in model 1.
Selection equation results
In terms of the hotspot selection, we see that prominence of outreach by certifiers or government-based certification is positively associated with all three types of organic hotspot formation. In model 1, looking at all hotspot selection (general agriculture hotspots included), we also see that the negative coefficients on Urban_influence_code_03 and Distance_to_interstate_07 (only significant for organic production or handling hotspots) are consistent with the proximity to urban centers rationale, while the negative coefficients on Pop_density_07 (only significant for general organic and organic production hotspots) are consistent with the rationale that organic farms fare better when they are away from sprawling development. The positive coefficients on Avg_farm_income_07 (not significant for general organic hotspots, and negative and significant for general agricultural hotspots), Natural_amenities_scale and Land_values_07 (not significant for general agricultural hotspots) are consistent with the resources rationale. The negative coefficients on Property_tax_per_cap_02 are consistent with the policy rationale, while the positive coefficients on Politics_green_00 are consistent with the receptiveness rationale. The selection equation results in model 2 fall into the same rationales as those in model 1, except for some discrepancies insignificance.
Robustness check: ATET estimation using propensity score matching
To provide a check on our main results, we employ an alternative method, namely the propensity score matching method, for estimating ATE and ATET.Footnote 4 A propensity score is simply the probability of an observation being treated, conditional on x. Based on this conditioning, observations with the same propensity score are assumed to have the same values as x. By matching treated and untreated observations that have the same propensity to be treated, we account for any non-randomness in which observations receive the treatment. In other words, the estimated treatment effect based on this matching should not be biased by selection effects. (Rosenbaum and Rubin, Reference Rosenbaum and Rubin1983; Cameron and Trivedi, Reference Cameron and Trivedi2005).
To estimate the ATE and ATET on the treated using propensity score matching, we first estimate a probit model with the hotspot treatment variable as the dependent variable, and characteristics that affect both the probability of treatment as the independent variables. This probit follows the same logic of the selection equation in Tables 4 and 5, with the identical covariates were chosen based on consistency with the literature on economic growth and hotspot formation/organic industry development (see Tables 2 and 3).Footnote 5 Using the probit results, we then predict the probability of being in a hotspot, and this probability becomes our propensity score (Grilli and Rampichini, Reference Grilli and Rampichini2011). Then, using a propensity score matching method based on the distance between vectors, referred to as Mahalanobis matching (Leuven and Sianesi, Reference Leuven and Sianesi2003), we estimate the ATE, ATET and the ATE on the untreated (ATU) for our two chosen economic indicators. The significance level is calculated using bootstrapped standard errors. To assess the balancing conditions, we test the null hypothesis that the difference is zero between the means (i.e., the bias) of the treated and control units for all independent variables given a propensity score, as well as the null hypothesis that all of the biases are equal to 0 (Leuven, Reference Leuven2003).
The top portion of Table 7 shows the treatment effects of being in an organic production hotspot, an organic handling hotspot, a general organic hotspot, and a general agricultural hotspot, as calculated via propensity score matching for the two models using the county-level poverty rate and the county-level median household income. For each model, it is informative to look at the difference column, which shows the difference between the mean outcome of the treated group (counties that are hotspots) and the mean outcome of the control group (counties that are not hotspots or within one county of a hotspot) for observations before matching (‘Unmatched’), after matching (ATE), treated observations (ATET) and untreated observations (ATU). We are particularly interested in ATET. For a county's 2012 poverty rate, we see negative and significant ATETs for organic production hotspots, as well as for all organic hotspots, which implies that being in a general organic hotspot or an organic production hotspot lowers the poverty rate. Organic handling hotspots follow the same pattern, but the ATET is not significant. These Table 7 results are consistent with those in Table 4 from the endogenous binary regressor approach.
Treatment effects model with propensity score matching

Notes: *, ** and *** denote statistical significance at the 90, 95 and 99% levels.
All three organic hotspot categories show a positive and significant ATET on median household income, which implies that being in one of the three types of organic hotspots increases median household income. The main conclusion that can be drawn from this is that being in some type of organic hotspot is significantly beneficial to poverty rate and median household income. Again, these Table 7 results are consistent with those in Table 5.Footnote 6 Shown in Table 7, the tests for the balancing condition all suggest that the bias (the difference between the mean of the treated and the mean of the control given a propensity score) is not significant in our models, and we can, therefore, be confident in the validity of our results.
When looking at the treatment effects of general agriculture hotspots, as calculated via propensity score matching, Table 7 shows that neither ATET is significant. Again, these results are consistent with those in Tables 4 and 5.Footnote 7 Comparing these general agriculture ATETs against those organic production hotspots, we see that organic production hotspots appear to be beneficial to poverty rate and median household income, while general agriculture hotspots do not have a significant effect on these indicators. Our tests of the balancing condition again suggest that we can be confident in our results.
Robustness check: Other treatments
While the previous analyses show that it is the organic part of organic agricultural hotspots that lead to county-level economic benefits (as opposed to the agricultural part), it is also possible that the same beneficial impacts might accrue from a treatment that is based on organic activity but not a true spatial measure.Footnote 8 In other words, we have yet to show that the hotspot part of our treatment is crucial to generating economic benefits (as opposed to the organic part). To determine how the effects of treatments based on hotspots of organic operations differ from those based solely on the magnitude of organic operations, we perform several additional analyses. We estimate additional treatment regressions using the number of general organic and organic production operations and the level of organic sales to define the treatment. Because, unlike with hotspots, there is no definitive way to determine what constitutes a ‘high’ number of organic operations or a ‘high’ value of organic sales, we arbitrarily define the treatment variables for general organic and organic production operations to be (1) two or more organic operationsFootnote 9, (2) ten or more organic operations and (3) 20 or more organic operations (for all organic operations, organic production operations and organic handling operations). For organic sales, we define the treatment to be (1) organic sales >US$500,000, (2) organic sales >US$1 million and (3) organic sales >US$5 million. All other variables in the models remain the same as in the main models to facilitate comparison. The results of these additional analyses are presented in Tables 7–19.
Instrumental variable treatment effects, all organic: County poverty rate

Notes: *, ** and *** denote statistical significance at the 90, 95 and 99% levels.
Instrumental variable treatment effects, all organic: County median household income
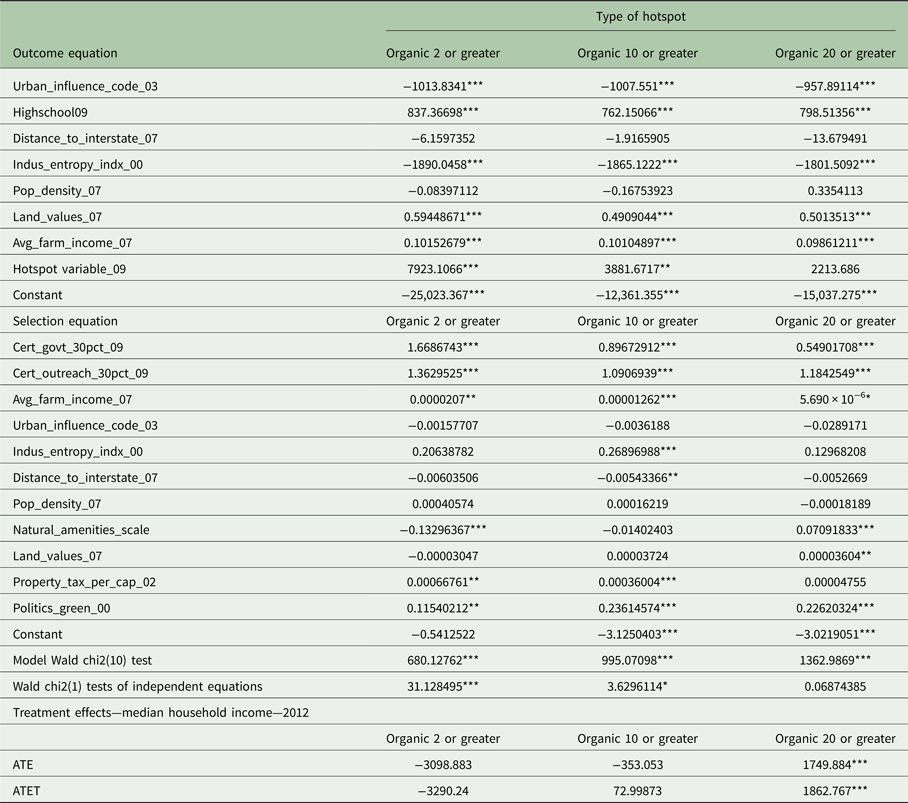
Notes: *, ** and *** denote statistical significance at the 90, 95 and 99% levels.
Balancing conditions, all organic

Treatment effects model with propensity score matching, all organic

Notes: *, ** and *** denote statistical significance at the 90, 95 and 99% levels.
Instrumental variable treatment effects, organic production: county poverty rate

Notes: *, ** and *** denote statistical significance at the 90, 95 and 99% levels.
Instrumental variable treatment effects, organic production: County median household income

Notes: *, ** and *** denote statistical significance at the 90, 95 and 99% levels.
Balancing conditions, organic production
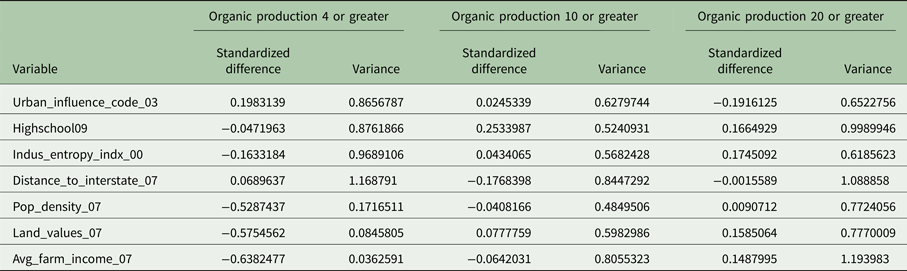
Treatment effects model with propensity score matching, organic production
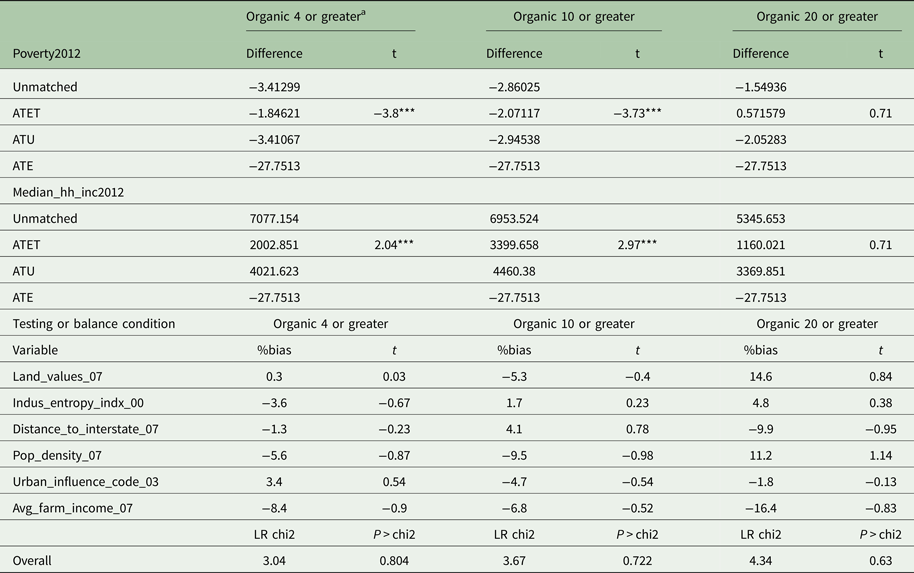
Notes: *, ** and *** denote statistical significance at the 90, 95 and 99% levels.
a We use greater than four operations for propensity score matching and greater than two operations for the instrumental variable treatment effects model because of balancing conditions.
Instrumental variable treatment effects, organic sales: County poverty rate

Notes: *, ** and *** denote statistical significance at the 90, 95 and 99% levels.
Instrumental variable treatment effects, organic sales: County median household income

Notes: *, ** and *** denote statistical significance at the 90, 95 and 99% levels.
Balancing conditions, organic sales

Treatment effects model with propensity score matching, organic sales
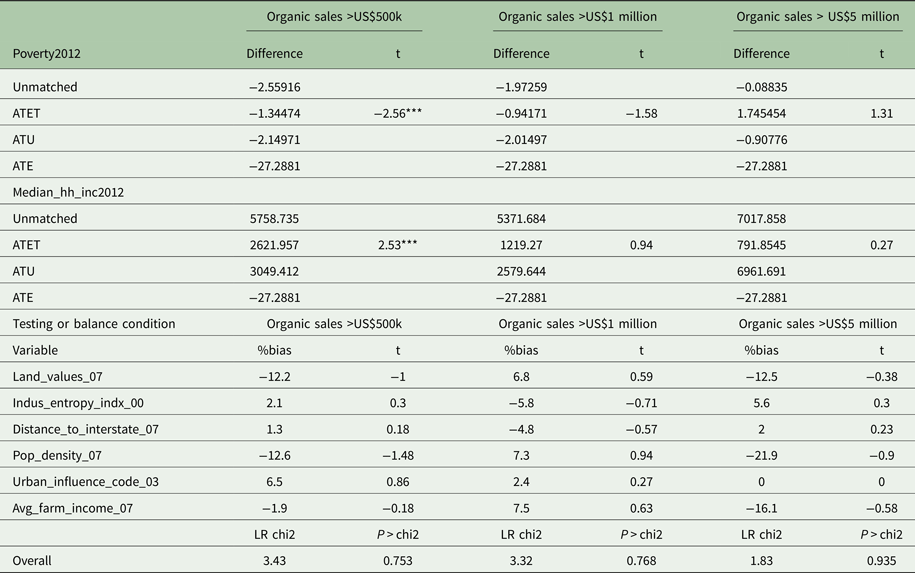
Notes: *, ** and *** denote statistical significance at the 90, 95 and 99% levels.
In the case of the treatments based on the number of general organic operations, ATETs of ten or more and 20 or more organic operations, and the ATE of ten or more organic operations on the poverty rate are negative and significant, but with lower magnitudes than the corresponding organic hotspot results. On the other hand, there are positive and significant ATE and ATETs of more than 20 organic operations on median household income, which have higher magnitudes than the corresponding organic hotspot results. When looking at the results of the propensity score matching method, we see negative and significant ATETs of more than four and more than ten organic operations on the poverty rate, and positive and significant ATETs of more than four and more than ten organic operations on median household income. The magnitudes of the significant ATETs are all higher than those of organic hotspots.
In the case of the treatments based on the number of organic production operations, the ATE and ATET of ten or more organic operations, and the ATE of 20 or more organic operations on poverty rate are negative and significant, but with lower magnitudes than the corresponding organic hotspot results. On the other hand, there are positive and significant ATE and ATETs of more than ten and more than 20 organic operations on median household income. These have higher magnitudes than the corresponding organic hotspot results. When looking at the results of the propensity score matching method, we see negative and significant ATETs of more than four and more than ten organic operations on the poverty rate, and positive and significant ATETs of more than four and more than ten organic operations on median household income. The magnitudes of the significant ATETs are all higher than those of organic production hotspots (with the exception of four or more organic production operations for median household income).Footnote 10
In the case of the treatment based on the value of organic sales, we see negative and significant ATEs for all three treatments, and a negative significant ATET for organic sales > US$500,000 on the poverty rate. We see positive significant effects on median household income of all of the treatments. In terms of the propensity score-matching method, we see a negative and significant effect of organic sales > US$500,000 on the poverty rate, and a positive and significant effect of that treatment on median household income.
These additional analyses suggest that the spatial concept of hotspots may be important when looking at county poverty rates, as the level of significance and the magnitudes of the treatments are generally lower when using non-hotspot treatments. The same cannot be said for the effects of organic operations on median household income, as the magnitudes of the treatments are generally higher when using non-hotspot treatments. The results of the propensity score-matching method yield more mixed results. The implication is that spatial autocorrelation appears to be more important for poverty rate than for household income. The results also suggest that the level of organic sales may be important and interesting to explore further when looking at both poverty rate and median household income.
Conclusions and further steps
The purpose of this paper is to assess whether or not organic agriculture has a positive impact on local economies. To answer this question, we establish a rigorous concept of what constitutes increased levels of organic agriculture at a local level by using spatial statistics to identify hotspots of organic operations. We then determine an appropriate analysis that accounts for non-random formation of hotspots and potentially endogenous formation of hotspots by using an endogenous regressor treatment effects model to quantify the impact of organic hotspots on two economic indicators: a county's poverty rate and median household income. We also perform the same analysis for general agricultural farm hotspots to confirm that the benefits associated with organic production hotspots were, in fact, due to the organic component. Our results consistently show that being in one of the three types of organic hotspots (general organic hotspots, hotspots of organic production or hotspots of organic handling) is beneficial to the county-level economic indicators. On the other hand, the impact of agricultural farm hotspots on county-level economic indicators appears not to be significant. These results provide strong motivation for considering hotspots of organic handling operations and hotspots of organic production to be local economic development tools.
Our results may be of interest to policymakers whose objective is to promote rural development. Our conclusion that organic hotspots have a positive and significant impact on local economic indicators, while hotspots of general agriculture show no such clear pattern, may incentivize these policymakers to specifically focus on organic development, rather than the more general development of agriculture, as a means to promote economic growth in rural areas. In addition, our specific focus on hotspots may point policy makers in the direction of not only encouraging the presence of organic operations, but of fostering the development of clusters or hotspots of these operations.
A few extensions may be addressed in the future. It may be interesting to study the role of the organic certifier on hotspot formation, as the certifier may play a pivotal role in policies that promote organic agriculture. Future research might also examine the impact of coldspots on economic indicators, as well as investigate the threshold level (i.e., somewhere in between the mere presence of organic agriculture in a county to a full-fledged hotspot) where positive economic impacts begin. The level of organic sales may also be interesting to investigate further. Finally, while our results suggest that organic hotspots benefit regional economies, it is difficult to predict whether or not these effects will continue as the organic industry grows, or if there is a diminishing impact as hotspots grow. It would be interesting to study if and how these effects change as organic production expands in the USA.
Acknowledgment
The views and opinions expressed here are those of the authors, and not necessarily those of the U.S. Food and Drug Administration. We thank the Associate Editor and two anonymous reviewers of RAFS for their constructive comments that greatly improved the paper.



