


INTRODUCTION
Detailed observational data on the deterioration of icebergs covering sufficiently long and continuous periods have been few and far betwen. During the month of June 1983, an ideal opportunity to make a detailed and yet reasonably inexpensive study of the deterioration of icebergs presented itself with the grounding of two icebergs outside St John’s harbour in Newfoundland (Figure 1). The mass of one of the bergs (#l) was about 1.6 million tonnes while that of the other (#2) was about 0.8 million tonnes. The aim of the field study carried out from 10-25 June 1983 was to document the deterioration adequately and to compare the observed iceberg decay with simulations from the model described in El-Tahan and others (1984).
REVIEW OF EARLIER FIELD AND LABORATORY STUDIES ON ICEBERG DETERIORATION
To place the present study in its proper perspective, it is instructive to review briefly other field and laboratory studies on iceberg deterioration.
Barnes (1912, 1913 and 1927), one of the early observers of icebergs, made water temperature measurements in the vicinity of icebergs and observed surface warming as an iceberg is approached. He further studied the role this warming played in the deterioration of icebergs. Citing observations made in bright sunlight, he concluded (1927) that the sun’s rays penetrating through the clear melt water on the berg’s surface set up expansion stresses resulting in calving of the berg. Zeusler (1926) and Ricketts (1930) conducted qualitative studies of the processes of melting and collected observational data to support their findings.
Kollmeyer (1965) studied the deterioration rate of a 636 000 tonne non-tabular iceberg during the period 27 April to 6 May 1965. Many environmental measurements were made, along with actual size measurements of the berg. Because air and water temperatures were low the iceberg lost only 12% of its mass in 8 days. Robe and others (1977) followed the deterioration of a tabular Arctic iceberg for 26 days. They noted that the wave-induced deterioration followed planes of weakness in the iceberg and was concentrated at indentations and embayments in the iceberg’s perimeter. Melting clearly did not extend far below the surface since the iceberg remained in one piece even after a channel was cut completely through the above-water portion. This concentration of wave turbulence and heat transfer is often observed in icebergs that remain stable and do not roll during deterioration.

Josberger (1977), in a cooperative study with the International Ice Patrol (based in the United States) investigated the melting processes of an iceberg in the Labrador Sea that rolled during the observational period. Comparison of ice masses above and below the old waterline indicated that the ice melted faster in water than in air.
Laboratory experiments described in the literature fall into two categories, viz. melting of ice by wave erosion and melting of vertical ice walls in saline water. Experiments carried out by Josberger (1977) and Josberger and Martin (1981) in unstratified salt waters have shown that convection adjacent to the ice walls could be either laminar or turbulent and was greatly dependent on the temperature, salinity and density structure of the ambient water. The influence of a stratified ocean on convection has been shown by Huppert and Josberger (1980).
Russell-Head (1980) conducted an experiment to model the melt process by placing blocks of ice of proportioned iceberg dimensions in an observation tank containing water of the same salinity as sea water. The sub-surface shape adopted by the blocks was found to be typically a ‘bath-tub’ one. The basal and mean side melt rates were of a similar value. Melt rates obtained in the laboratory for icebergs in water of a low temperature agreed with those inferred from iceberg population studies in the Antarctic.
Laboratory experiments on wave erosion of icebergs are few. Josberger (1977) examined the effect of small flapper-generated waves with a height of 5 cm and a period of 0.4 sec on a vertical ice sheet. Even though the
water temperature was only 4 C, the waves carved out a waterline notch 8 cm deep in 45 minutes. The notch had a vertical extent of about one wave height above the water line and about one sixth of that below the waterline. The wave erosion experiments of White and others (1980) were carried out in a circular wave tank. The test waves had an average height of 6 cm and a period of 0.4 sec. The eroded shapes of the ice blocks turned out to be similar to the pinched-in shape predicted by their theory, and melting times also agreed well with their theoretical estimates.
THE 1983 ST JOHN’S FIELD STUDY
Data collection and analysis
The data collection platform for the field study was a 10.6 metre fishing vessel fitted with a Koden radar, compass and depth sounder. For the purposes of the field study the vessel was equipped with a bathythermograph and winch, two Braystoke BFM008 MK3A direct-reading current meters and digital display units, a Stevenson screen with wet-bulb and dry-bulb thermometers, a sea temperature bucket and thermometer, a Fuess aneroid barometer, a hand held anemometer, two Polaroid EE-100 cameras, one Ricoh 35 mm camera, two hand held compasses, and recording logs and diary. During the latter part of the study, this vessel also contained a sidescan sonar fish, cable, winch, and a WESMAR 500SS deck unit for recording the data.
The data collected from the vessel and other sources can be broadly classified into three categories - berg related, meteorological and océanographie. A description and analysis of the data in these three categories is given below.
Berg-related data
The berg-related data included polaroid and 35 mm photographs of the bergs, depth soundings near the berg sites and side scan sonar profiles of the bergs, all taken from the study vessel, and aerial stereo photography. The polaroid photographs of the north, east, south and west facing sides of the two icebergs were taken once each day when possible, usually from a range of 1/16 to 1/8 nm (115 to 230 m) as determined by the vessel’s radar. The above water dimensions of the two icebergs were derived from the polaroid photos and aerial Stereophotos. For the polaroid photos the formula for obtaining berg measurements was

where D = the actual berg dimension (metres), R = the range to the berg (nm); d = the photo dimension (mm); and k = constant. The constant k is a function of the focal length of the camera and here has a value of 16.25. However, due to the problems with the accuracy of the vessel radar and with maintaining the vessel in position, the above water iceberg dimensions extracted from these photos were not reliable and fluctuated unacceptably. Comparisons with aerial stereophotos taken on the same days confirmed this. If the dimensions determined from the stereophotos are assumed to be 100% accurate, then the Polaroid photos yielded errors in mass estimation of up to 30% for berg #1 and up to 220% for berg #2. Hence, the results from the polaroid photos were not used in estimating berg dimensions.
Aerial stereophotos of each iceberg were taken on five days during the field study period and also on 25 June 1983, to make up for the lack of these photos in the early part of the study. More photos were not possible due to restrictions of weather and visibility offshore, which prevented flights from taking place on other days. As such, usable stereophotos span a 12-day period, starting on 10 June 1983. Some of these also had to be eliminated from the analysis due to problems created by air turbulence near shore causing photo tilt and thus distortions in the stereo pairs, and due to the presence of significant swell waves causing variations in the sea level datum between stereo pairs. Despite these problems, eight pairs (four for each iceberg) of stereophotos were acceptable for estimating berg dimensions and mass and their changes during the study period. More than the absolute mass of the berg, the change in mass is important from the point of view of comparison with model simulations.
The stereophotos were analyzed using a Mirror stereoscope with magnifying oculars and parallax bar. Waterline perimeter, maximum length, width and height of the berg were determined. In addition, a cross-sectional grid was established for each stereo pair. The grid was spaced to take into account major elevation changes on the iceberg. The parallax was measured at each point on this grid using the parallax bar. Sea level was used as the zero reference height for all parallax determinations. Using the relationship
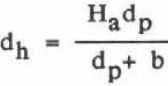
where dh = the height of a point on the iceberg above sea level; dp = the difference in parallax from sea level to this point on the iceberg; Ha = aircraft flying height; and b -measured photo distance between successive photos. The x and y co-ordinates were measured directly from each stereo pair for each point on the grid and manually recorded. The cross sectional data were then used to calculate iceberg mass with the assumption that 1/8 of the iceberg volume is above water. This assumption, strictly valid only for floating bergs, can also be used with bergs that are grounded and remain grounded. In the case of grounded bergs, the absolute mass would be overestimated using the above assumption. However, since all mass changes will be referred to this initial state, any differences between observed and model simulated deterioration will have to be attributed to factors other than grounding. Further details of the mass computations are given in Fenco (1983).
The few sidescan sonar profiles that were obtained of the underwater portions of the bergs were rendered unusable because of the problems with the stability of the measuring platform (the fishing vessel).
Meteorological data
In order to obtain a continuous set of data, meteorological observations were made at three locations in the vicinity of the bergs. These were the study vessel, Fort Amherst at the mouth of St John’s harbour (see Figure 1) and St John’s airport, Vessel-based meteorological data consisted of wet and dry bulb air temperatures, barometric pressure, wind speed (one minute average) and direction, sky condition and visibility. These were available for about eight hours during the day. The early morning (0600-0900 LDT) and late evening (1800-2100 LDT) data consisted of hourly observations of wind speed and air temperature at Fort Amherst. The Atmospheric Environment Service (AES) weather office at St John’s airport provided high quality, continuous records of meteorological parameters. These were used to fill the gaps when observations could not be made in the field near the bergs or at Fort Amherst. The final meteorological input data for simulations using the model of E1-Tahan and others (1984) consisted of wind speeds averaged from airport observations and those recorded near the icebergs, and dry bulb temperatures from the airport.
Océanographie data
Observations of oceanographie parameters relevant to iceberg deterioration consisted of sea surface temperature, sea temperature profiles, wave height and period and ocean currents. Hourly observations of sea surface temperature were made with a sea temperature bucket and thermometer at Fort Amherst and from the study vessel. A bathythermograph was used to obtain sea temperature profiles once a day near each iceberg. The surface temperature as obtained from the bathythermograph was checked against the value for the corresponding time obtained from the sea temperature bucket. Average values of sea surface temperature and sea temperature over each profile was calculated for each day and used as input to the iceberg deterioration model. It is to be noted that the averaging in the vertical of the sea temperature was limited to the depth where the water temperature attained a value of 0°C. Through the period of the experiment this depth ranged from 15 to 30 m below the surface (Fenco 1983).
Wave height and period data consisted of hourly visual estimates from the study vessel as well as three-hourly data from a waverider buoy moored approximately 16 kilometres northeast of the bergs’ location. Given the higher quality of the waverider data they were used in the model simulations. The visual estimates of wave action were useful for cross-referencing the waverider data with conditions in the study area.
Ocean current speed is a factor for consideration in iceberg deterioration for grounded, as opposed to drifting, icebergs. To properly record current speeds, the study vessel had to be anchored while the current meters were in use. As anchoring and deployment required some time, this aspect of the study was usally saved for the end of the day, if time and wave conditions allowed. In total, 57 current measurements were made at 40 m depth and 38 at 15 m. Fluctuation at either depth was minimal, with speeds ranging from 0.02 to 0.27 m/s at 40 m and from 0.02 to 0.14 m/s at 15 m. The mean current speeds at 40 m and at 15 m were 0.13 m/s and 0.07 m/s respectively. As a result, an overall average current speed of 0.1 m/s was deemed appropriate as input to the deterioration model for each day considered.
Model Simulations
In addition to documenting the deterioration of the two icebergs, a second objective of the study was to compare the observed decay with simulations from the model of E1-Tahan and others (1984). This comparison was aimed at further validating the model as a forecasting tool. The model predicts mass losses due to insolation, buoyant vertical convection, forced (air and water) convection, wave erosion and calving of the resulting overhanging ice slabs.
Table 1 lists the environmental data used as input for the model simulations over the period 10-22 June 1983. The insolation data used in this study are based on the work of DeJong (1973) as described in E1-Tahan and others (1984). Iceberg parameters needed as initial conditions were

obtained from the stereophotographs. Figures 2 and 3 depict the variations in the above water portions of icebergs #l and 12 as obtained from these aerial photographs. Table II lists the berg parameters estimated from these stereophotos


STEREOPHOTOS. TABLE ALSO LISTS THE DETERIORATION MODEL OF JUNE 1983.
as well as certain others required as inputs to the model. In this table the underwater surface area of the berg and its vertical component are required as initial values for the computation of forced water convection and buoyant convection respectively (see E1-Tahan and others 1984). These processes contribute to berg decay only in the water layer where the water temperature is above 0°C. This layer, for the two bergs in question, is fairly shallow. In this shallow layer the berg can be assumed to have vertical walls. With the draft of the berg being much greater than the depth of this layer there is no forced convection melting of the underside of the berg. Thus the underwater surface area of the berg and its vertical component have the same value for each berg. The underwater surface area is given by the product of the waterline perimeter and the mean depth of the 0°C water temperature isotherm.

Figure 4 shows the results of the model simulation for iceberg #l for the period 10-23 June 1983. Although stereophotos, and hence an estimate of the berg mass, were available for 25 June, the environmental data collection program was terminated on 22 June. Thus the model simulations were limited to that time period. Figure 4 indicates very good agreement between the predicted and actual mass loss over the 13 day period with the mass loss being underestimated by about 10%. The model simulations also indicated that wave action (wave erosion and calving of the resulting overhanging ice slab) was responsible for about 88% of the total mass loss. Forced water convection accounted for 9%, buoyant convection 2%, and wind convection and solar radiation accounted for 0.5% each.

For iceberg #2, it can be seen from Figure 3 that the orientation of the iceberg changed between 10 and 14 June. Thus the changes in the water line perimeter may not have been purely the result of berg melting. For the purposes of model simulations, 330 m was assumed as the initial value of the waterline perimeter. Other parameters remaining the same, this value produced the same computed mass loss over the period 10-17 June as the combined mass loss produced by model runs for the two periods 10-14 June and 14-17 June. The latter model runs used the observed waterline perimeters on 10 and 14 June as initial values.
Figure 5 gives a comparison of the model runs with observations for iceberg 12 for the period 10-17 June. It is***seen that during the period 10-14 June the difference between the predicted and observed mass loss rates is about 30%. However, between 14 and 17 June the difference in the mass loss rates is only about 10%, a value similar to that for iceberg #l. The model simulation for the period 14-17 June initialized with 14 June observations is also shown in Figure 5.

The most probable reason for the larger difference between observed and computed mass loss during the period 10-14 June is that the large pieces of ice that were observed to fall off the berg during this period probably caused the iceberg to change its orientation. Such a shift in the berg position would introduce errors in estimates of mass changes due to deterioration. Another possibility is that the observed calving of ice was caused by deterioration mechanisms not accounted for in the model (eg thermal cracking). This type of mass loss can only be accounted for by statistical data. It is therefore recommended that, in future field studies, careful documentation be made of the masses of ice pieces that fall off an iceberg.
For iceberg #2, the contributions to berg decay from the various mechanisms were similar in magnitude to those of berg #1.
CONCLUSIONS
The data collected in this field study have been a significant addition to the limited number of documented cases of iceberg deterioration. The study revealed the need for a stable observation platform to enable accurate measurements of iceberg profiles. Round-the-clock observations may be necessary if one is to document fully the deterioration of even grounded icebergs.
Comparison of the observed decay with simulations from the model of E1-Tahan and others (1984) shows good agreement with only a 10% difference, thus further confirming the validity of the modelling approach. It is once again seen that wave erosion and the resulting calving of the overhanging slabs account for a very significant portion of iceberg decay.
ACKNOWLEDGEMENTS
The authors thank Mobil Oil Canada, Ltd, for their assistance in obtaining the stereophotographs of the icebergs, and Mr Hussein E1-Tahan of Fenco Newfoundland Ltd for his advice and consultation during the preparation of this paper.



