Human colonic microbiota may comprise more than 500 bacterial species, and the bacterial concentration varies from 1011 to 1012 cells/g faeces. The most predominant bacteria in the colon are Clostridium spp., Bacteroides spp., Bifidobacterium (Bifid.) spp. and Eubacterium spp. Bifidobacteria are beneficial bacteria, whose increase in the colon is considered desirable. Probiotics are exogenous bacteria which beneficially affect intestinal microbial balance. The most commonly used probiotics belong to the Lactobacillus (Lb.) and Bifid. genera. Each probiotic strain, independent of its genus and species, is unique, and thus the health effects of each strain have to be assessed in a case-by-case manner. Prebiotics, on the other hand, are indigestible food ingredients that selectively stimulate the growth and activity of beneficial bacteria already available in the colon (Gibson & Roberfroid, Reference Gibson and Roberfroid1995). Inulin is an indigestible carbohydrate with a reported prebiotic, bifidogenic effect (Roberfroid, Reference Roberfroid1993; Langlands et al. Reference Langlands, Hopkins, Coleman and Cummings2004). It is a fructo-oligosaccharide (FOS) with a long chain length of up to 60 sugar molecules. In most European countries, inulin is legally considered a fibre, since it acts as a soluble fibre, being digested not in the small intestine but almost totally in the colon (McBain & Macfarlane, Reference McBain and Macfarlane2001). A boosting combination of probiotics and prebiotics, i.e. a synbiotic combination, may result in even better microbial balance in the colon (Roberfroid, Reference Roberfroid1998).
Changes in the composition and metabolic activity of the colonic microbiota are often detected as a change in the activities of harmful bacterial enzymes such as β-glucuronidase, β-glucosidase and urease which are thought to mediate the activation of procarcinogens in the colon (Gorbach & Goldin, Reference Gorbach and Goldin1990). Ammonia, produced by the action of urease, is a highly toxic compound which reduces mucosal cell viability, leading to mucosal damage (Tsujii et al. Reference Tsujii, Kawano, Tsuji, Takei, Tamura, Fusamoto and Kamada1995). Probiotics (Ogata et al. Reference Ogata, Nakamura, Anjitsu, Yaeshima, Takahashi and Fukuwatari1997; Rowland et al. Reference Rowland, Rumney, Coutts and Lievense1998) and inulin (Rowland et al. Reference Rowland, Rumney, Coutts and Lievense1998; McBain & Macfarlane, Reference McBain and Macfarlane2001) are associated with a decrease in these harmful enzymic activities. The suppressing effect of Bifid. longum BB536 (Reddy & Riverson, Reference Reddy and Riverson1993; Singh et al. Reference Singh, Rivenson, Tomita, Shimamura, Ishibashi and Reddy1997; Zsivkovits et al. Reference Zsivkovits, Fekadu, Sontag, Nabinger, Huber, Kundi, Chakraborty, Foissy and Knasmuller2003) and Bifid. sp. 420 (Nurmi et al. Reference Nurmi, Puolakkainen and Rautonen2005) on colonic carcinogenesis has been shown in several rat studies. A synbiotic combination of probiotics and inulin has shown promising results by reducing colorectal carsinogenesis in rats (Rowland et al. Reference Rowland, Rumney, Coutts and Lievense1998; Klinder et al. Reference Klinder, Forster, Caderni, Femia and Pool-Zobel2004), possibly by modulating the gut-associated lymphoid tissue (Roller et al. Reference Roller, Pietro Femia, Caderni, Rechkemmer and Watzl2004). The bifidogenic properties of inulin and other prebiotics are presumed to be the reason for their protective effect against colonic carcinogenesis.
The question of whether inulin combined with Bifid. longum BB536, Bifid. sp. 420 and Lb. acidophilus 145 favourably affects human colonic microbiota needs clarification. The aim of the study, therefore, was to examine the effect of fermented milk for everyday use with these bacteria on colonic health indicators, and to investigate whether a prebiotic, inulin, enhances these effects. Gastrointestinal symptoms, defaecation frequency, stool weight, intestinal transit time, the number and enzymic activities of faecal bacteria and the acidity of the faeces were compared between the groups receiving either fermented milk with probiotics, fermented milk with probiotics plus inulin or a control fermented milk.
Materials and Methods
Subjects
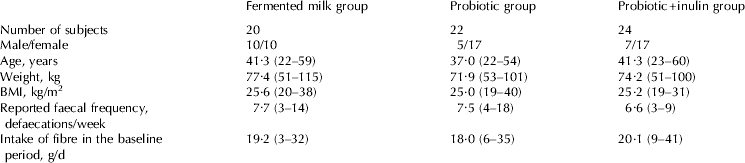
Sixty-six healthy subjects with normal bowel function (22 male, 44 female) whose mean age was 40 years (range, 22–60 years) took part to the study (Table 1). None of them had received antibiotic treatment for at least 2 months before the study, with the exception of three subjects whose time since antibiotic treatment varied from 5 d to 14 d. Thirty-nine subjects were randomized to give faecal samples for microbial analyses.
Characteristics of the study subjects (n=66) in the groups receiving control fermented milk, fermented milk with probiotics, or fermented milk with probiotics plus inulin, expressed as mean and range or number of subjects

All subjects gave their written informed consent. The study was approved by a local ethics committee.
Design
The study was randomized with three parallel groups and was performed double-blinded. It lasted for 33 d, including a baseline period of 12 d (days 1–12) and an intervention period of 3 weeks (days 13–33). During both baseline and intervention periods, fermented milk products other than the ones provided were not permitted. Any other food or preparation containing probiotics was also forbidden. For the 3-week intervention period, the study subjects were randomly assigned to three groups and consumed 3×200 ml daily of either (1) a fermented milk with probiotics (FP-milk), (2) a fermented milk with the same probiotics plus inulin (FPI-milk), or (3) a control fermented milk (FC-milk) with neither probiotics nor inulin.
FP-milk was fermented with a mesophilic culture, Lb. acidophilus 145, Bifid. longum BB 536 and Bifid. sp. 420, all from Danisco (Tonder, Denmark). The number of Lb. acidophilus 145 was 8×10⁵ cfu/g and stayed at the same level for 10 d, which was the maximum time for fermented milk consumption from production. The number of bifidobacteria was 3×10⁷ cfu/g immediately after production and 4×10⁶ cfu/g after 10 d. FPI-milk contained 4 g inulin (Raftiline HP, Orafti SA, Belgium) per 200-ml portion and intake was thus 12 g inulin daily. FC-milk was fermented only with a mesophilic starter culture.
Measurement of intestinal transit times
Intestinal transit times were measured during the last 5 d of the baseline period (days 8–12) and of the intervention period (days 29–33). A Sitzmarks capsule with 24 radiopaque markers was ingested at 7·00 on the first morning. Faeces were collected for the next 5 d, all in separate dishes labelled with the defaecation time and stored frozen at −20°C until analysis. Faeces were radiographed and the average transit times of the markers were counted according to the method of Hinton et al. (Reference Hinton, Lennard-Jones and Young1969). The stools were weighed.
Questionnaires for bowel function and fibre intake
During the last 7 d of both baseline period (days 6–12) and intervention period (days 27–33) subjects kept a daily record of defaecation frequency, the consistency of faeces (on a scale of 0=watery, 1=soft, 2=normal, 3=hard), the difficulty of defaecation (0=easy, 1=fairly easy, 2=rather difficult, 3=difficult), and gastrointestinal symptoms (flatulence, abdominal pain and abdominal distension, all on a scale of 0=no symptom, 1=mild, 2=moderate, 3=severe).
Special emphasis on diet was placed on the amount of dietary fibre in the diet: at the end of the baseline and intervention periods, subjects filled in a dietary fibre frequency questionnaire in which the intake of food containing fibre was assessed for the previous week (Jäkälä et al. Reference Jäkälä, Korpela and Mykkänen1994). Before and after the study, the subjects were weighed to confirm that energy intake had not changed.
Analysis of acidity and enzyme activity of faeces
Acidity (pH) and the activities of β-glucuronidase, β-glucosidase and urease were measured in one faecal sample from each subject during baseline and intervention periods. Faecal samples were stored at −20°C and analysed within 5 months. Samples were first thawed at +4°C for 1 d or until fully thawed. They were then homogenized 1:10 in 0·1 m-potassium phosphate buffer, pH 7·0. Finally, the samples were sonicated in an ice bath (4×15 s, medium capacity) and centrifuged at 500 g at 2–4°C for 10 min. The supernatant fraction was used for analysis.
Activities of β-glucuronidase (substrate phenolphthalein mono-β-D-glucuronic acid; Sigma Diagnostics Inc, St. Louis MO, USA; in 0·1 m-potassium phosphate buffer, pH 6·8) and β-glucosidase (substrate p-nitrophenyl-β-D-glucopyranoside; Sigma; in 0·1 m-potassium phosphate buffer, pH 7·4) were determined as described by Freeman (Reference Freeman1986). Activities were measured in duplicate after 10 min and 20 min.
Faecal urease activity was determined by incubating the faecal supernatant fluid for 10 min and 20 min in 0·02 m-potassium phosphate buffer (pH 7·4) containing urea as substrate (Ling et al. Reference Ling, Korpela, Mykkänen, Salminen and Hänninen1994) using an ammonia electrode (Model no. 95-12, Orion Research Inc, Boston MA, USA). To express enzyme activities as nmol substrate metabolized/min per mg protein, protein in the faecal supernatant fluid was determined in duplicate by a Lowry method using BSA as standard.
Acidity was measured with a pH meter and glass electrode after diluting the homogenized faecal sample in deionized water.
Microbial analyses
Faecal samples during the baseline period between day 8 and day 10 and one during the intervention period between day 29 and day 31 were obtained for microbial analysis from 14 subjects (FP-milk group), 14 subjects (FPI-milk group) and from 12 subjects (FC-milk group). Immediately after defaecation the subjects placed a sample from the middle part of the faeces in a plastic container which was sealed in an anaerobic bag (Anaerocult A mini, Merck, Darmstadt, Germany) and transported to the laboratory. All the samples for microbiological analysis were processed in an anaerobic chamber (Don Whitley Scientific Ltd., West Yorkshire, UK) within 5 h after the sample collection. Culturing was performed as described by Alander et al. (Reference Alander, Mättö, Kneifel, Johansson, Kögler, Crittenden, Mattila-Sandholm and Saarela2001). The sample was mixed and an aliquot of 0·5 g was homogenized in a dilution buffer (peptone–saline with 0·5 g cysteine–HCl/l) by vortexing with glass beads. Samples were serially diluted and plated on several selective media to investigate the viability of specific target microbial groups. The dilution buffer and media used for cultivation of the anaerobic bacteria were pre-reduced in an anaerobic chamber before use.
Bifidobacteria were determined on Beerens agar (Beerens, Reference Beerens1991), Clostridium perfringens on Tryptose sulphite cycloserine agar (Merck), Bacteroides on Bacteroides bile aesculin agar (Alles et al. Reference Alles, Hautvast, Nagengast, Hartemink, van Laere and Jansen1996), Lactobacilli on Rogosa agar (Oxoid, Hampshire, England), and coliforms and Escherichia coli on MacConkey agar (Difco, Detroit MI, USA). Plates for anaerobes were incubated in anaerobic jars filled with mixed gas (85% N2, 5% CO2 and 10% H2) by the evacuation-replacement method (Anoxomat, Mart Microbiology, Lichtenvoorde, The Netherlands) at 37°C for 4 d (Beerens and Tryptose sulphite cycloserine agars) or for 5 d (Bacteroides bile aesculin agar). Rogosa plates were incubated at 37°C for 3 d in jars containing gas generators (Anaerocult A, Merck), and MacConkey plates, aerobically at 37°C for 1–2 d.
Statistics
Gastrointestinal symptoms (flatulence, abdominal pain and abdominal distension) were dichotomized according to symptoms of at least mild intensity (the mean daily score ⩾1·0) during baseline and intervention periods. Study groups were compared using logistic regression analysis, where the corresponding baseline symptom was included as a categorical covariate. Group comparisons are given as baseline-adjusted odds ratios (OR) with 95% confidence intervals (CI). The Chi-squared test was used for abdominal pain due to prevalences of 0%.
The variables describing the intensity of gastrointestinal symptoms, gastrointestinal function, faecal pH, microbial counts and enzyme activities were analysed using the analysis of covariance (ANCOVA), where the baseline was included as a continuous covariate.
Because of skewed distributions, the faecal microbial counts were logarithmically transformed before analysis, and therefore the group comparisons are given as ratios, e.g. FP/FC, with 95% CI. Multiple comparisons after ANCOVA were Bonferroni-adjusted. Changes in microbial counts within study groups were analysed using paired samples t test (before – after analysis).
Baseline adjustment was needed for both ANCOVA and logistic regression analysis because there was some imbalance between the study groups at the baseline. Data were analysed using SPSS (Version 13.0).
Results
Gastrointestinal function and diet
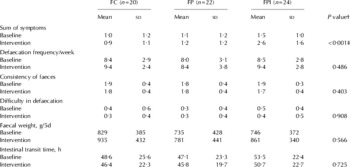
During the intervention, gastrointestinal symptoms were significantly more pronounced in the FPI-milk group than in the other two groups: baseline-adjusted means for the sum of symptoms were 1·1 in the FC-milk group, 1·3 in the FP-milk group and 2·4 in the FPI-milk group (P<0·001, ANCOVA, Table 2). Flatulence in particular was affected (baseline-adjusted means 0·6, 0·7 and 1·2, respectively, P<0·001, ANCOVA). In the FPI-milk group, 79% of subjects experienced at least mild flatulence during the intervention compared with 20% (OR=30·0, 95% CI 4·2–216, P=0·001) in the FC-milk group and 36% (8·7, 1·80 to 41·7, P=0·007) in the FP-milk group. In the FPI-milk group, 33% experienced at least mild abdominal pain during the intervention compared with 0% in the other two groups (P<0·001, Chi-squared test). Variables describing defaecation, faeces and transit time were not significantly different between the groups.
Gastrointestinal symptoms (including flatulence, abdominal pain, abdominal distension, all on a scale from 0=no symptoms to 3=severe symptoms) and defaecation functions (consistency from 0=liquid to 3=hard, and difficulty from 0=easy to 3=difficult) in the baseline period and in the intervention period in the groups receiving control fermented milk (FC), fermented milk with probiotics (FP), or fermented milk with probiotics plus inulin (FPI)

† Analysis of covariance, baseline included as a covariate
‡ Baseline-adjusted means 1·1 for FC, 1·3 for FP and 2·4 for FPI. FPI vs. FC P=0·001 (mean difference 1·3, 95% CI 0·5–2·1), and FPI v. FP P=0·003 (1·1, 0·3–2·0) as Bonferroni-adjusted for multiple comparisons
During the study the mean intake of fibre decreased from 19·1 to 17·3 g/d (P=0·004), and the weight increased from 74·4 to 74·8 (P=0·054). Changes in fibre intake and the weight of the subjects were not significantly different between the study groups (P=0·684 and P=0·808 respectively).
Faecal bacteria
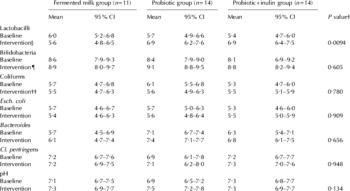
In the groups receiving FP-milk or FPI-milk, the number of lactobacilli increased during the intervention compared with the FC-milk group (Table 3). Baseline-adjusted means were 6·9, 7·0 and 5·6 log cfu/g wet weight respectively. In comparison with the FC-milk group, the FP-milk group had 21 times more (95% CI 1·5–289·5, P=0·021), and the FPI-milk group, 23 times more lactobacilli after the intervention (95% CI 1·6–343·6, P=0·017). There was no difference between the two groups receiving probiotics (P=1·000).
Faecal microbial counts (log cfu/g wet weight) and pH in the baseline period and in the intervention period in the groups receiving control fermented milk (FC), fermented milk with probiotics (FP), or fermented milk with probiotics plus inulin (FPI)

† Analysis of covariance, baseline included as a covariate
‡ Baseline-adjusted means 5·6 for FC, 6·9 for FP and 7·0 for FCI. FP v. FC P=0·021, FPI v. FC P=0·017 and FPI v. FP P=1·000 as Bonferroni-adjusted for multiple comparisons
§ Intervention compared with baseline: FP P=0·009, FPI P=0·003
¶ Intervention compared with baseline: FP P=0·046, FPI P=0·038
†† Intervention compared with baseline: FP P=0·032, FPI P=0·657
Compared with the baseline level, the intervention with FP-milk or FPI-milk increased the number of faecal lactobacilli (P=0·009 and P=0·003) and bifidobacteria (P=0·046 and P=0·038). The number of Enterobacteriaceae decreased in the group receiving FP-milk (P=0·032).
Acidity and enzyme activities of faeces
In the FPI-milk group faecal pH stayed constant during the study (change from 7·27 to 7·26), while it seemed to increase in the other two groups (from 7·14 to 7·28 for FC, and from 6·88 to 7·48 for FP group, P=0·040, ANOVA). However, when the different baseline levels were taken into account, the differences between the groups during the intervention period were non-significant (baseline-adjusted mean 7·3 in the FC, 7·6 in the FP and 7·2 in the FPI group, P=0·134, ANCOVA). Activities of β-glucuronidase (baseline-adjusted mean 5·0 in the FC, 4·9 in the FP and 4·4 in the FPI group, P=0·570, ANCOVA), β-glucosidase (8·3, 8·8 and 8·8, P=0·816) and urease (25·7, 24·3 and 31·3, P=0·211) did not differ between the groups after the intervention period.
Discussion
In the present study 66 healthy adults ingested either fermented milk with probiotics, i.e. Bifid. longum BB536, Bifid. sp. 420 and Lb. acidophilus 145, the same fermented milk with probiotics plus inulin, or a control fermented milk for 3 weeks. FP-milk had a positive effect on the colon microbiota by increasing the number of bifidobacteria and lactobacilli. Inulin did not alter this effect but it increased gastrointestinal symptoms.
An inulin intake of 7·5 g/d has been found to be bifidogenic (Langlands et al. Reference Langlands, Hopkins, Coleman and Cummings2004), but in our study 12 g/d dose caused no additional effect on numbers of faecal bifidobacteria. This accords with a previous clinical study where ingestion of bifidobacteria increased faecal bifidobacteria but additional inulin (Bouhnik et al. Reference Bouhnik, Flourie, Anderieux, Bisetti, Briet and Ranbaud1996) failed to enhance this effect. The colonic microbiota is normally very stable and is not easily affected. In this study, the effect of probiotics seems to have been sufficiently strong to cause some increase in the number of bifidobacteria, such that inulin could not have any stronger effect.
The increase in the number of lactobacilli was the clearest change in the intestinal microbiota observed during the ingestion of FP-milk or FPI-milk possibly owing to the Lb. acidophilus 145 that those drinks contained. It has also been shown that Bifid. longum BB536 (Ogata et al. Reference Ogata, Kingaku, Yaeshima, Teraguchi, Fukuwataru, Ishibashi, Hayasawa, Fujisawa and Iino1999) and inulin (Langlands et al. Reference Langlands, Hopkins, Coleman and Cummings2004) increase the number of lactobacilli in the colon. The number of lactobacilli did not increase in the FC-milk group (milk fermented with a mesophilic starter culture), which confirms that the increase of lactobacilli and bifidobacteria in the other two groups was not due to the mesophilic culture or to the milk components. Our finding of the stimulating effect of Bifid. longum BB 536 on the bifidobacteria has also been shown earlier (Yaeshima et al. Reference Yaeshima, Takahashi, Matsumoto, Ishibashi, Hayasawa and Iino1997; Ogata et al. Reference Ogata, Kingaku, Yaeshima, Teraguchi, Fukuwataru, Ishibashi, Hayasawa, Fujisawa and Iino1999).
In an in-vitro model, bifidobacteria have been shown to suppress the growth of harmful bacteria such as Esch. coli and Cl. perfrigens (Gibson & Wang, Reference Gibson and Wang1994). This effect is especially clear with inulin and other FOS as a growth substrate (Wang & Gibson, Reference Wang and Gibson1993). In our study, the intervention with FP-milk suppressed coliforms compared with baseline. However, the effect was not significant between the FP-milk group and the FC-milk group, and growth of Cl. perfringens was not suppressed, although the number of bifidobacteria and lactobacilli increased. We found no additional effect of inulin, as also found earlier in clinical studies (Gibson et al. Reference Gibson, Beatty, Wang and Cummings1995; Kleessen et al. Reference Kleessen, Sykura, Zunft and Blaut1997).
All the fermented milk products had a tendency to increase defaecation frequency, so that no additional effect of probiotics or inulin was found. The normal faecal frequency was an inclusion criterion of the subjects, and it was desirable that inulin did not show a laxative effect in subjects with normal bowel function, although this effect has been shown in subjects with constipation (Gibson et al. Reference Gibson, Beatty, Wang and Cummings1995; Kleessen et al. Reference Kleessen, Sykura, Zunft and Blaut1997). In the present study the gastrointestinal symptoms were significantly pronounced in a group receiving inulin, and some subjects showed clear intolerance to the considerably high amount of inulin, 12 g daily, which accords with a study with similar inulin consumption (Pedersen et al. Reference Pedersen, Sandström and van Amelsvoort1997), indicating efficient fermentation of inulin in the colon. Large amounts (>30 g) of inulin daily can lead to increased flatulence and other gastrointestinal side-effects (Sobotka et al. Reference Sobotka, Bratova, Slemrova, Manak, Vizda and Zadak1997; Kruse et al. Reference Kruse, Kleessen and Blaut1999). Tolerance seems to vary greatly among people, and subjects may become accustomed to a high intake of inulin, as only ‘mild discomfort’ was reported by elderly constipated subjects when inulin consumption was gradually increased to as high as 40 g/d (Kleessen et al. Reference Kleessen, Sykura, Zunft and Blaut1997).
The faecal pH stayed at the same level in the group receiving inulin as it was at the beginning, whereas in the group receiving FP-milk, the faecal pH tended to increase. Inulin serves as a substrate for the bacteria producing short-chain fatty acids in the colon, which may have helped to retain the pH at the initial level. Inulin has been reported to lower faecal pH in one clinical study (Welters et al. Reference Welters, Heineman, Thunnissen, van den Bogaard, Soeters and Baeten2002) but in most clinical studies no effects have been found (Bouhnik et al. Reference Bouhnik, Flourie, Anderieux, Bisetti, Briet and Ranbaud1996; Kleessen et al. Reference Kleessen, Sykura, Zunft and Blaut1997; Brighenti et al. Reference Brighenti, Casiraghi, Canzi and Ferrari1999). Bifidobacteria produce strong acids such as acetate and lactate in the colon, which would predict a drop in faecal pH, but in clinical studies, no effect on faecal pH has been found after consumption of Bifid. longum BB536 (Yaeshima et al. Reference Yaeshima, Takahashi, Matsumoto, Ishibashi, Hayasawa and Iino1997; Ogata et al. Reference Ogata, Kingaku, Yaeshima, Teraguchi, Fukuwataru, Ishibashi, Hayasawa, Fujisawa and Iino1999).
In the present study the activities of β-glucuronidase, β-glucosidase and urease did not differ between the groups, as has also been reported in some previous clinical studies with probiotics (Goossens et al. Reference Goossens, Jonkers, Russel, Stobberingh, Van Den Bogaard and Stockbrugger2003), inulin (Kleessen et al. Reference Kleessen, Sykura, Zunft and Blaut1997) or synbiotic combinations (Bouhnik et al. Reference Bouhnik, Flourie, Anderieux, Bisetti, Briet and Ranbaud1996). However, many studies have shown the effective suppression of enzyme activities by probiotics (Bouhnik et al. Reference Bouhnik, Flourie, Anderieux, Bisetti, Briet and Ranbaud1996; Ogata et al. Reference Ogata, Nakamura, Anjitsu, Yaeshima, Takahashi and Fukuwatari1997; Rowland et al. Reference Rowland, Rumney, Coutts and Lievense1998) and inulin (Rowland et al. Reference Rowland, Rumney, Coutts and Lievense1998; McBain & Macfarlane, Reference McBain and Macfarlane2001), often related to decreased pH. In our study, we found no decrease in faecal pH and perhaps for this reason no decrease in harmful enzyme activities either.
In conclusion, fermented milk with probiotics had beneficial effects on the microecology of the colon of healthy adult volunteers by increasing the number of bifidobacteria and lactobacilli, but it did not otherwise affect the function of the intestine. Combination of probiotics and inulin did not alter this effect but it did increase gastrointestinal symptoms.
The authors express their thanks to Tuija Poussa, MSc, for statistical advice, and to Mimi Ponsonby MA, for editing the English.