1. Introduction
Geographic, meteorological and oceanographic conditions, high vessel traffic volume and even strategic positions make transit vessel scheduling an important problem, especially for narrow and risky waterways. In the literature, there are several studies regarding transit vessel scheduling.
Golkar et al. (Reference Golkar, Shekhar and Buddhavarapu1998) built the Panama Canal Simulation Model (PCSM) by SABRE to assess pilot working conditions and elaborate on different capacity issues, which draws upon operational and environmental factors such as vessel transit, lock operation, culvert assignment, tugboat operations, and tide and fog conditions. PCSM is an inland waterway transportation model that estimates delays at locks by comparing numerical and simulation results. Merrick et al. (Reference Merrick, Van Dorp, Mazzuchi, Harrald, Spahn and Grabowski2002, Reference Merrick, Van Dorp, Blackford, Shaw, Harrald and Mazzuchi2003) designed a simulation model for operations in the Port of Seville, such as freight transport throughout the estuary, vessel arrivals, dock assignments, vessel departures, lorry arrivals and container terminals. Filipowicz (Reference Filipowicz2004) worked through vessel traffic controlling methods with the help of a traffic scheme and vessel traffic system (VTS), and proposed a multi-objective approach for the vessel route allocation problem. Some of the objectives were: minimising cost, minimising maximal sector load which is a function of safety factor and minimising the number of ship meetings to reduce the accident risk. The study also touched on solution methods for the multi-objective problem for this kind of allocation problem. Almaz and Altiok (Reference Almaz and Altiok2012) established a port simulation model to mimic operations in the Delaware River. Qu and Meng (Reference Qu and Meng2012) developed a simulation model for the Singapore Straits to mimic vessel movements. through cellular automata models. Chen et al. (Reference Chen, Zhang, Liu, Lin and Yao2015) used a particle swarm optimisation algorithm to minimise waiting times, which starts with random particles (vessel orders) and improves the waiting times in proceeding generations of the algorithm. Cheraghchi et al. (Reference Cheraghchi, Abualhaol, Falcon, Abielmona, Raahemi and Petriu2017) analysed vessel speed data from the automatic identification system (AIS) and studied the methods to decrease scheduling disruptions based on the speed data. They tackled this problem as a multi-objective modelling approach with the objectives of minimising delays between ports, and minimising monetary loss while maximising speed compliancy when compared with past velocity limits. Sluiman (Reference Sluiman2017) designed a transit vessel scheduling algorithm that finds the best allocation for two-way ship traffic and applied this algorithm in various waterways. The study compared the proposed schedule with the schedules formerly applied and presented notable similarities. Rahimikelarijani et al. (Reference Rahimikelarijani2018) considered the effects of closing the Houston Channel (to construct a bridge) for several alternative time slots. The study used statistical tools such as ANOVA and determined the best slot that minimised vessel waiting times. Lalla-Ruis et al. (Reference Lalla-Ruis, Shi and Voß2018) built a scheduling model to minimise the waiting time of vessels arriving and leaving waterways as well as minimising emissions of vessels in berthing areas.
The studies referred to above provide valuable results with simulation models to mimic vessel traffic patterns, with optimisation models to find the best route allocations and minimum waiting times and statistical models to find best vessel traffic slots. They incorporate both simulation analysis with the scheduling of maritime traffic decisions in specific waterways. However, none of them put emphasis on the entrance allowance system for vessels, especially for when transiting in narrow, congested waterways. Transit vessel entrance and allocation decisions make up the backbone of potential risk reduction methods applied by the authorities. Therefore, it is essential to make a systematic passage plan regarding rules and regulations and also expert decisions. The literature review shows that analysis of long-term traffic patterns with regard to past years’ vessel arrival-entrance data and comparisons based on various vessel traffic density conditions are missing.
Considering the gaps in the literature, the aim of this study is to schedule transit vessel traffic on a mathematical ground by taking into account the allowance regulations and expert opinion together. The results provide a systematic vessel entrance approach for the decision makers. The study creates a model that combines simulation analysis with decision factors for transit vessel scheduling, specific to narrow waterways. The Strait of Istanbul is chosen as the case study for this specific risky, narrow waterway transit vessel scheduling problem.
All maritime transportation of the states around the Black Sea and the connected states must pass through the Strait of Istanbul. In 1936, in order to better define the legal status of the strait, the Montreux Convention was signed by Turkey, the United Kingdom, France, the Soviet Union, Japan, Greece and Yugoslavia. This agreement, while delegating all maritime traffic control decisions in the strait to the covernment of the Turkish Republic, also stipulates that all vessels have complete freedom to navigate in the strait both day and night during peacetime. The VTS was established in order to provide service regarding necessary maritime traffic and meteorological information, technical and navigational guidance for vessels transiting the strait, and to organise vessel traffic before allowing vessels into the strait. The VTS also helps vessel operators in case of emergent risky situations. The main technical components of the VTS are radars, cameras, Doppler current sensors, salinity and temperature profiles, automatic weather stations, record and replay units, and AIS base stations. The VTS serves in full accordance with national laws and special regulations, which will be referred to as the Rules and Regulations (R&R).
The Strait of Istanbul is one the narrowest and most strategic natural channels in the world. It unites the Sea of Marmara and the Black Sea while also separating the European and Asian continents. The strait is 31 km (16⋅8 nm) in length. The narrowest point is a mere 660 m in width. The depth varies from 30 to 120 m. This makes the strait one of the narrowest waterways in the world. The strait also features many sharp turns, at times up to 80 degrees. This means that vessels transiting the strait are forced to change course more than 10 times. There are also a number of currents peculiar to the strait. These currents have a substantial impact on navigational difficulty, thus increasing the risk of maritime accidents. Moreover, other meteorological conditions, such as fog, rain and wind, also affect vessel traffic in the strait. In dense fog or adverse weather conditions, the VTS may slow down vessel traffic or even suspend it until meteorological conditions improve (Ece, Reference Ece2007). Another distinctive feature of the strait is the extremely high level of local vessel traffic, averaging more than 2,500 trips per day (Viran, Reference Viran2014). This traffic includes dry cargo carrying vessels, passenger ships, hazardous material carrying vessels and tankers. Transit traffic density is also a major concern regarding accident risk in the strait. Reaching a peak in 2008, more than 54,000 transit vessels passed through the strait. However, in the seven years to 2015 there was a nearly 16% decrease in transit traffic (Boğazlardan geçen gemi sayısı azaldı, no date). A more detailed analysis of the maritime traffic in the strait is given in Altan and Otay (Reference Altan and Otay2017).
Every day in the strait, VTS operators decide on the transit traffic direction (one-way traffic) and sequence the waiting and approaching vessels in that direction. While scheduling the transit vessel traffic in the strait, the VTS needs to abide by the strait transit R&R while also considering the waiting and arrival times of individual vessels. In accomplishing this important duty, VTS operators do not have a precise quantifiable scheduling methodology; rather, they make scheduling and sequencing decisions primarily based on their experience and general understanding of the R&R.
A number of studies have been conducted which are specific to the Strait of Istanbul. Or and Kahraman (Reference Or and Kahraman2002) designed a simulation model which takes vessel entrance rules into consideration and investigates the impact of transit and local vessel arrivals and environmental conditions regarding the number of vessel accidents in the strait. Köse et al. (Reference Köse, Başar, Demirci, Güneroğlu and Erkebay2003) designed a discrete event simulation model that takes vessel traffic rules and weather conditions in the strait into account. In addition, Ulusçu et al. (Reference Ulusçu, Özbas, Altiok, Or and Yilmaz2009) focused on scheduling transit vessel traffic in the strait by using a mathematical model which first decides how many large-sized hazardous vessels are planned to enter the strait and then sequences them according to daytime and nighttime plans. After that, other vessels are ordered in between those vessels and the vessels waiting in their queues are allowed into the strait in a predetermined order, as long as meteorological conditions are satisfied. In another study, Almaz (Reference Almaz2006) developed a model to investigate the effect of meteorological conditions on vessel flows in the strait. The study also involves scenario analysis to reveal the effects of the vessel arrival process, resource (pilot and tugboat) usage, regulations, and meteorological changes. Furthermore, Özlem (Reference Özlem2011) developed a simulation model that mimics actual transit vessel traffic in the Strait of Istanbul for daytime and nighttime. The study considers interarrival distributions for various vessel classes. The model sequences ready-to-enter vessels based on minimum pursuit distance R&R, pilot and tugboat availability, meteorological conditions and the active traffic direction. Moreover, the effects of some of the principal parameters, such as arrival rates, number of available pilots and minimum pursuit distances, on performance measures are investigated. In addition, Candanoglu (Reference Candanoglu2013) developed an optimisation model that minimises vessel waiting times, while scheduling arrived vessels which are ready to enter the strait. The study also conducts scenario analysis by investigating the effects of parameters such as minimum pursuit distances, number of available pilots, and arrival distribution of vessels on performance measures including total and average waiting times and number of vessels entering the strait. It should be noted that in almost all of the past studies regarding vessel traffic behaviour in the Strait of Istanbul, it is assumed that vessel entrance policies and the R&R are continually applied at all times. However, what happens in actuality is that vessel arrivals are random and vessel entrances are somewhat haphazard. Entrance decisions are primarily made according to the experience and subjective evaluations of VTS operators, rather than according to precise rules.
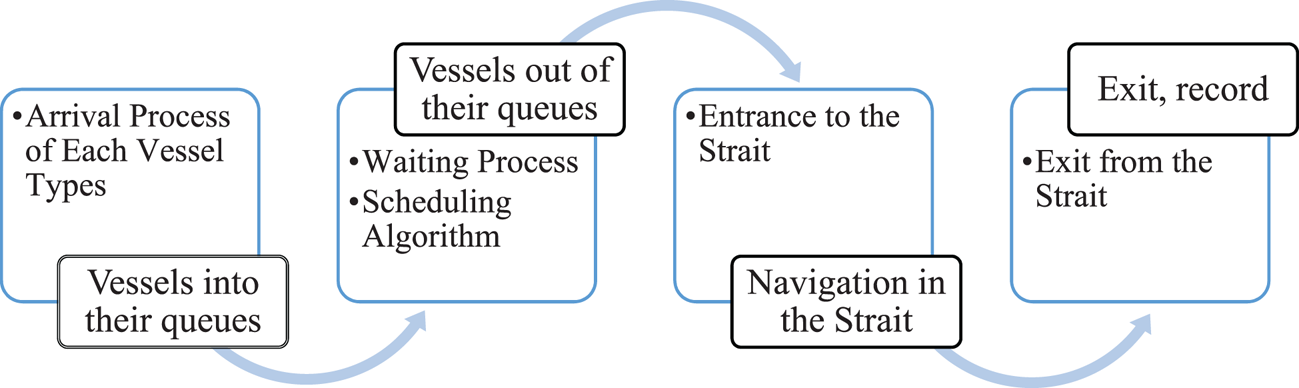
These studies especially imposed discrete event simulation models and mathematical models to show the transit vessel patterns of the Strait of Istanbul. However, the study periods were of short and limited durations. This study aims to systematise transit vessel scheduling in the strait based on written regulations (R&R) and past scheduling behaviour of the transit vessel entrance planning operators. To do this, first, a simulation model is built which mimics the actual transit vessel flow in the Strait of Istanbul. In this framework, between the years 2008 and 2014, interarrival times of each vessel class, in both northbound and southbound directions, are fitted to the most appropriate probability distributions. Then, a scheduling algorithm is designed to determine which is the most appropriate vessel (among the waiting vessels) to enter the strait in the active direction, while taking the R&R into account and while also allowing for some randomness in interentrance times. The algorithm also determines the consecutive vessel type and its entrance time as well as flow-direction-time window lengths until the end of daytime and nighttime traffic in both traffic directions. Figure 1 below shows the interactions of the sub-models in the simulation model.
Relationship between sub-models in the proposed simulation model

2. Methodology
In this study, a simulation model is built which mimics the actual transit vessel flow in the Strait of Istanbul. In this framework, interarrival times of each vessel class in both northbound and southbound directions, between 2008 and 2014, are fitted into the most appropriate probability distributions. Then a scheduling algorithm is designed to determine the most appropriate type of vessel (among the waiting vessels) to enter the strait in the active direction, according to some randomness in interentrance times, while taking the R&R into account. The algorithm also assigns the consecutive vessel type and its entrance time, until the end of the daytime and nighttime traffic for both traffic directions for seven years.
2.1. Characteristics of vessels transiting the strait
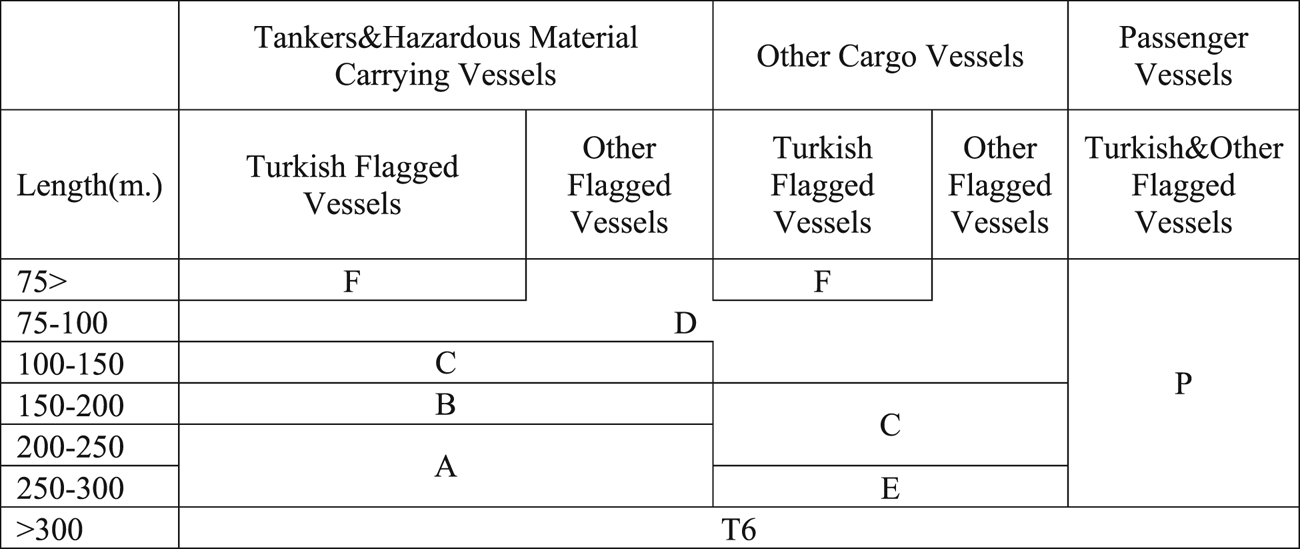
Vessels navigating the Strait of Istanbul are categorised according to their lengths, flags, and cargo types, as displayed in Figure 2.
Vessel classification (Candanoglu, Reference Candanoglu2013)

However, only uni-directional transit for all other types of vessel has been allowed by the R&R since 2005. Class A vessels are the most important regarding perceived risk and, accordingly, they make up the backbone of the strait vessel scheduling system. These vessels carry hazardous materials; hence, in order to minimise the risk, they may only enter the strait during daytime and with wide time/distance separation between two consecutive class A vessels. T6 vessels are the rarest class transiting the strait, with a regularity of, at most, five times per year. Therefore, in this study, they are embedded in class A vessels, as they have similar entrance rules. Class B vessels also carry hazardous materials. However, since they are shorter than class A vessels, they are allowed to make nighttime transits. Class C vessels carry both hazardous and non-hazardous cargo which varies in relation to their lengths. Class E vessels are the largest vessels carrying non-hazardous material. Class D vessels, comprising 59% of all entrances, are the most numerous and therefore have the lowest entrance priority. This is the same for class F vessels – small Turkish-flagged vessels. Lastly, class P vessels are passenger vessels.
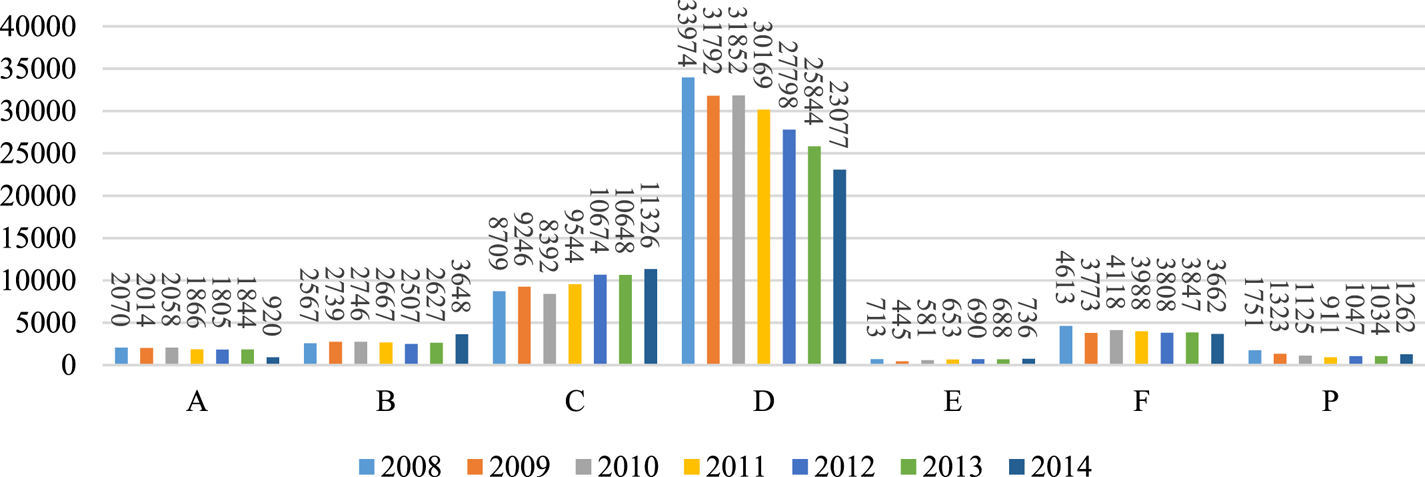
This study considers all transit vessel traffic data compiled by the VTS system between 2008 to 2014. Taking an overall look at these years, it can be seen that there was an increasing trend for class C vessels, whereas the number of class A and D vessels decreased dramatically (Figure 3).
Number of vessels, by class, entering the Strait of Istanbul

Each vessel approaching the Strait of Istanbul submits an SP-2 report. This report supplies the relevant information about the vessel and must be submitted at least two hours, or 20 nautical miles, before arrival. Vessels providing their SP-2 reports and arriving at the strait have to comply with the R&R. Some of the important R&R regarding entrance and sailing through the strait are:
• There should be at least 0⋅920 mile pursuit distance between two successive vessels entering the strait from the same direction.
• Class A vessels should enter the strait only during daytime.
• Class A and class E vessels should not come up against any type of vessel except passenger vessels during their passage through the strait.
• Overtaking is discouraged unless vessel and environmental conditions are very favourable. Nevertheless, at the narrowest region between (Kanlıca and Vaniköy) overtaking is prohibited under any circumstance.
• Class A vessels should not come across with dry cargo carrying vessels longer than 150 m (class C vessels) and vice versa.
• Vessels carrying LNG-LPG or dangerous cargo should not come across with any other dangerous cargo or LNG-LPG carrying vessels regardless of their lengths.
• While transiting in the strait, vessel speed should not exceed 10 nautical miles (except under extreme conditions).
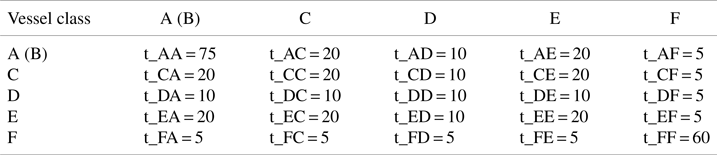
VTS officers schedule vessel traffic based on the R&R for day and night according to priority rules and minimum pursuit distances (converted to time in minutes) between consecutive vessels (Table 1). Although minimum time intervals for class A vessels are 90 min for northbound pairs and 75 min for southbound ones, since pursuit time intervals for other vessels do not differ, in this study the effect of traffic direction on minimum pursuit distances is ignored.
Minimum pursuit time intervals indicated in R&R (in minutes)

However, these R&R rules are not rigidly followed at all times. Actual transits feature some deviations from the declared rules. For instance, small vessels (class D and F) and (rarely) passenger vessels (class P) may enter the strait against the active direction. The main reasons for these deviations are, among other considerations, the VTS operators’ evaluations and decisions that are affected by meteorological conditions, the number of vessels in the queue and vessel density in the strait. Therefore, a true mimicking of the scheduling in the strait cannot be achieved regarding constant and fixed arrivals and entrances for vessels.
In this study, the realised time intervals for all consecutive vessel pairs that have entered the strait in the past are acquired from actual VTS data. It is assumed that this data set is the product of the past scheduling policies deployed.
2.2. Arrival process for the simulation model
In the context of this study, actual arrival data for 300,000 vessels between 2008 and 2014 are investigated. To analyse the arrival process of vessels, a further classification was conducted according to vessel travel directions. Vessels entering the Strait of Istanbul from the south and travelling north are called northbound vessels, and vessels entering from the north and travelling south are called southbound vessels. For example, NB_A means a class A vessel entering the strait from the south and transiting to the north, and SB_AA means two consecutive class A vessels entering the strait from the north and transiting to the south.
The simulation model starts by estimating the arrival distribution of each vessel class in each direction and building a vessel arrival model for transit vessel traffic in the strait. Time of submission of SP-2 reports is used to determine interarrival distributions of vessel classes. Statistical software, EasyFit©, is used to find the best fitting interarrival time probability distributions, based on vessel classifications and directions. In the simulation model, Kolmogorov–Smirnov tests are deployed to measure whether the interarrival data of vessel classes obtained for each year (from 2008 to 2014) follow a specified distribution or not. According to the results of the Kolmogorov–Smirnov tests, P-values of interarrival distributions for most vessel classes are higher than 0⋅05, which may be interpreted as not rejecting the hypothesis that the specified interarrival distribution for the specified vessel class is an acceptable fitting distribution.
2.3. Scheduling algorithm to determine vessel entrances
Vessels arriving at the Strait of Istanbul from either direction must wait until they are allowed to enter. Every morning, VTS planning specialists determine the starting traffic direction as ‘the active direction’ and sequence all vessels throughout that day's day and night time windows. The duration of the daytime traffic time window displayed in Table 2 differs according to the season (Ulusçu et al., Reference Ulusçu, Özbas, Altiok, Or and Yilmaz2009).
Seasonal changes in daytime traffic duration (Ulusçu et al., 2009)

The daily vessel scheduling accomplished by the VTS planners is expected to abide by the R&R. However, as explained in section 3.1, the R&R are not rigidly applied, as some flexibility is allowed for expert judgement. In this study, the following algorithm is developed to mimic and represent the randomisation in the actual scheduling of vessels originating from the ‘expert judgement’ and ‘flexible’ actions of the VTS planners. The steps of the developed scheduling algorithm are as follows:

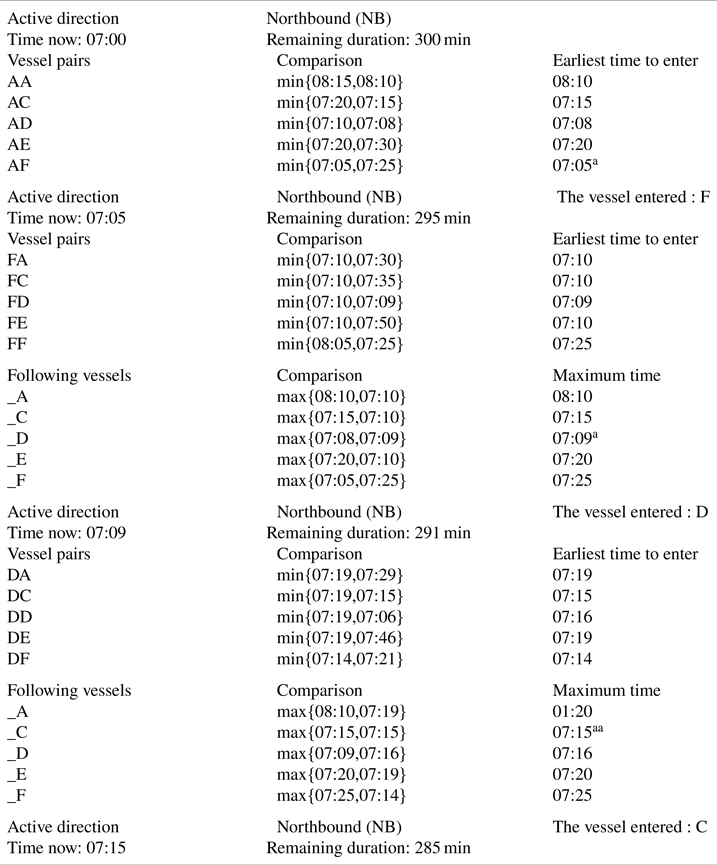
The proposed scheduling algorithm starts by randomly assigning the daily start time active direction (northbound or southbound). If the current time is in the daytime vessel traffic time window, the algorithm searches for the class A vessel with the maximum waiting time in that direction. If the current time is in the nighttime vessel traffic time window, the algorithm searches for the class B vessel with the maximum waiting time in that direction (Step 1). Next, the consecutive entering vessel and its entrance time is determined. To determine the next vessel to enter, the minimum duration for each successive vessel pair candidates (e.g. AA, AC, AD, AE, AF) is found. Here, minimum duration  ${x_{ijd}}$ is computed as follows: the minimum of two values
 $\; rn{d_{ijd}}$ (the random number generated by the entrance distribution of class i and j vessels which are successively entering the strait from direction d) and
 ${t_{ij}}$ (the minimum pursuit time interval between vessel class i and j, determined by R&R, given in Table 1) is computed for each vessel j. The vessel j with such a value is assigned as the next vessel after the initial class A vessel (Step 2). Current time is assigned as the previous time (Step 3). Time is incremented as much as the minimum duration computed in Step 2 (Step 4). To determine the following consecutive vessels, minimum duration for maximum of minimum duration for each vessel pair is determined. For instance, if the most recent vessel to enter the strait is class C, the next vessel is determined by taking the minimum of maximum of minimum duration for vessel pairs, ‘AA and CA’, ‘AC and CC’, ‘AD and CD’, ‘AE and CE’ and ‘AF and CF’ (Steps 5 and 6). The sequencing process for the active traffic direction ends when the preset time window for that direction expires (Step 7). Next, the opposite direction is designated as the active direction (Step 1). In a similar manner, the algorithm primarily searches for the class A vessel with the maximum waiting time in that direction and the same steps are applied until the end of that direction's time window (and end of daytime) (Steps 1 to 7). Nighttime traffic resumes with the latest daytime active direction. However, this time, instead of a class A vessel, the algorithm searches for class B vessels first and then the same procedure is followed until the morning of the following day.
2.4. Vessel transit in the strait
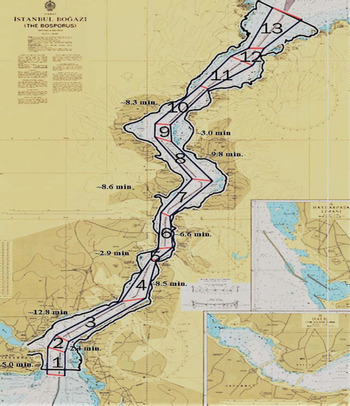
The scheduling algorithm determines the vessel types in the active direction and sequences the vessels based on the estimated interentrance durations. Duration of closure of the Strait of Istanbul to transit traffic due to adverse meteorological conditions is implicitly considered in this study. The random numbers provided from each interentrance time of successive vessels also include the closed times. Northbound vessels enter the strait at sector 1, proceed consecutively through sectors 2, 3, 4, 5, 6, 7, 8, 9, 10, 11 and 12 and leave the strait from sector 13. Similarly, southbound vessels enter the strait at sector 13, proceed consecutively through sectors 12, 11, 10, 9, 8, 7, 6, 5, 4, 3 and 2 and leave the strait from sector 1. For each northbound (southbound) vessel, the simulation clock is initiated at sector 1 (13), then incremented at the vessel's passage to sector 2 (12), and so on, based on the average transit times displayed in Figure 4.
Average transit time for each sector (Altan and Otay, Reference Altan and Otay2017)

3. Results, validation and discussion
The simulation model is run in Matlab package through the years 2008 to 2014, in one-year increments. Each year is replicated 20 times. Although the study covers a seven-year vessel traffic analysis, in order to highlight the effect of transit traffic density, three different years are chosen for scenarios:
(i) 2011 as the ‘average transit traffic density’ scenario;
(ii) 2008 as the ‘higher transit traffic density’ scenario;
(iii) 2014 as the ‘lower transit traffic density’ scenario.
The primary statistics tracked in the simulation runs are average interarrival times for each vessel type in either direction, the number of vessels transiting the strait, and the interentrance time of vessels in either direction. This section shows the results for the statistics and the validation of the model results with the actual ones.
3.1. Average interarrival times of vessels
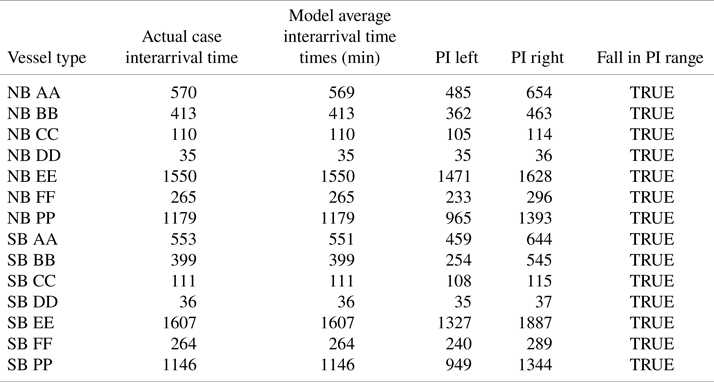
The first statistics are the interarrival times for each vessel type in northbound and southbound directions. The actual interarrival time for each vessel type is obtained through VTS SP-2 reports. The actual average interarrival times for all vessel types in either direction are compared with average interarrival times for all vessel types obtained from the simulation model (based on the 2011 data) by means of the prediction interval. The results show that actual interarrival times for all vessel classes fall in the prediction interval of t distribution with α = 0⋅1 (Table 3). In this table vessel type NB_AA stands for two consecutive northbound class A vessels arriving at the strait. PI stands for prediction interval, PI left stands for left (lower) bound for prediction interval, whereas PI right stands for right (upper) bound for prediction interval.
Average interarrival times (minutes) comparison

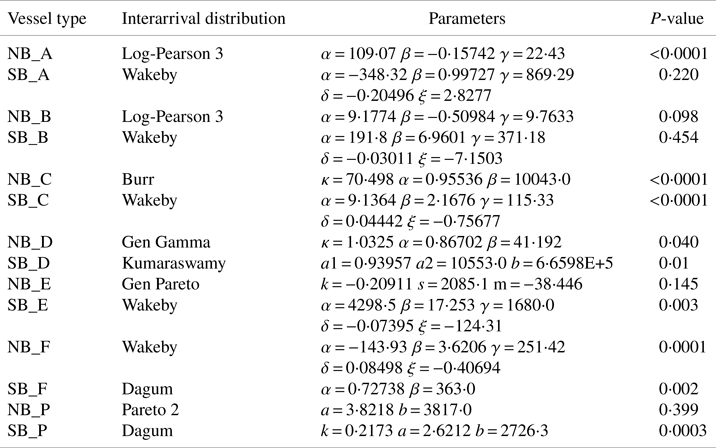
In order to test the goodness of fitting for the specified distributions generated through EasyFit, instead of fitting whole year interarrival time data to the specified distributions for each vessel class, 50% of the one-year interarrival time data is chosen as the training data set and the remaining part is chosen as the test data set. Afterwards, the best fitting distributions of the training data set for each vessel class are found and the random numbers generated from the fitted distributions are compared with the test data set using two sample Kolmogorov–Smirnov tests. The results show that, apart from the specified distributions of NB_A, NB_C and SB_C vessels, all remaining specified distributions are distributions with a good fit at α = 0⋅0001 (Table 4).
Average interarrival times comparison

3.2. Number of vessels transiting the strait
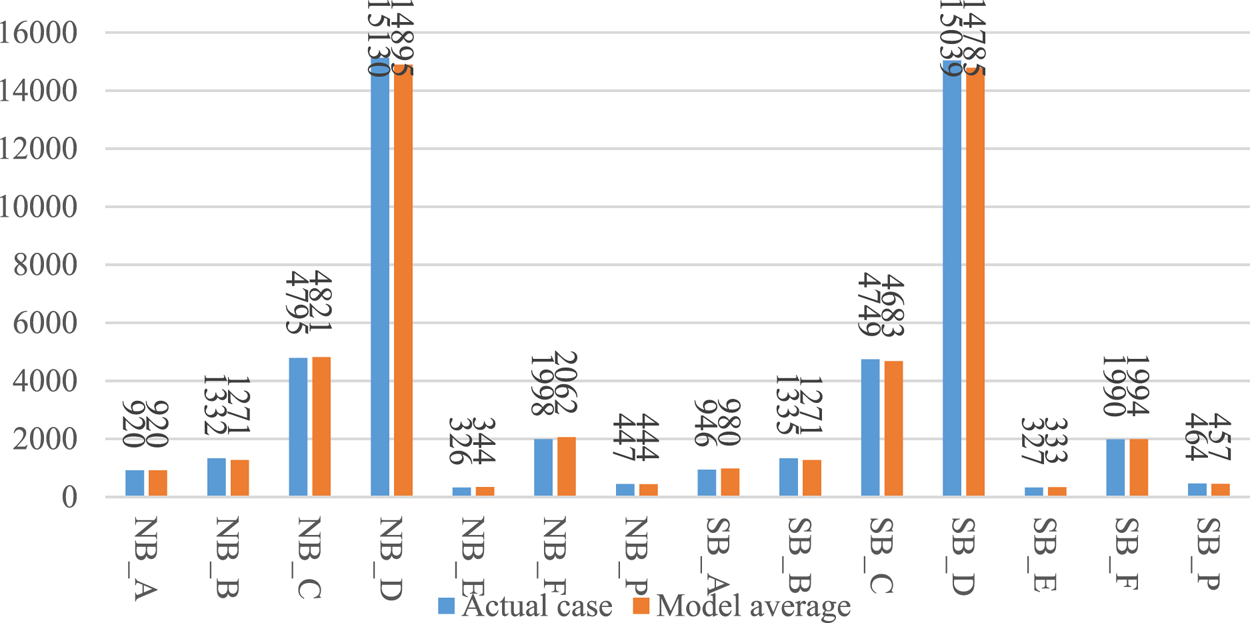
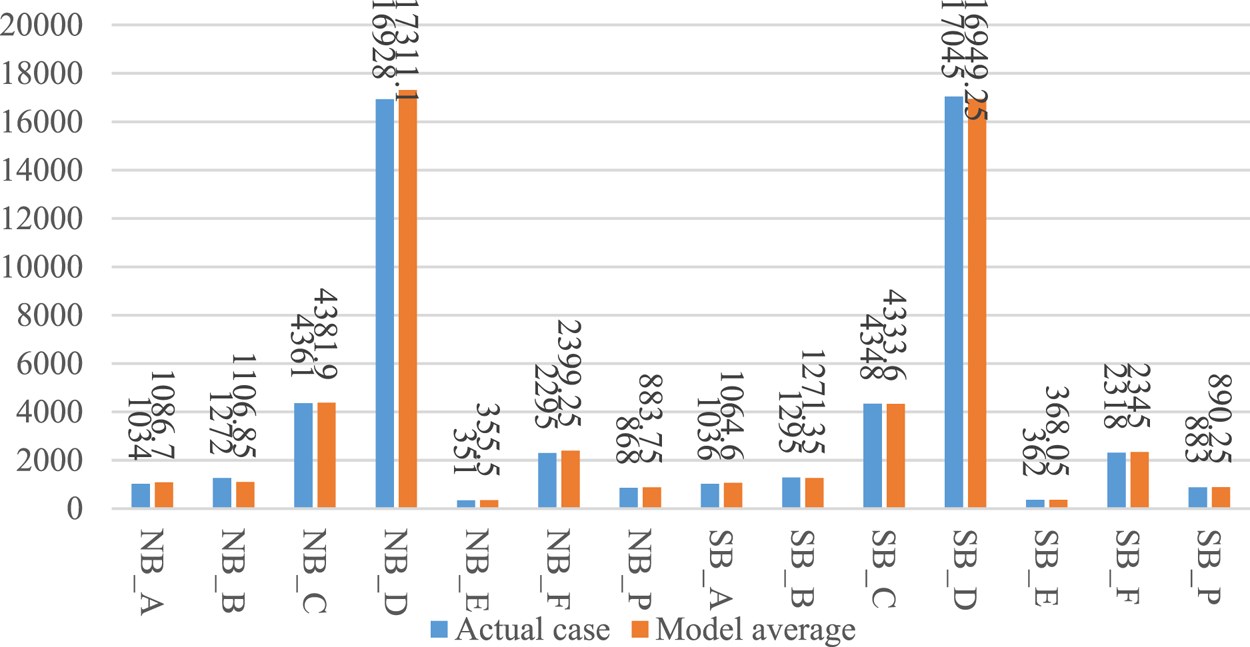
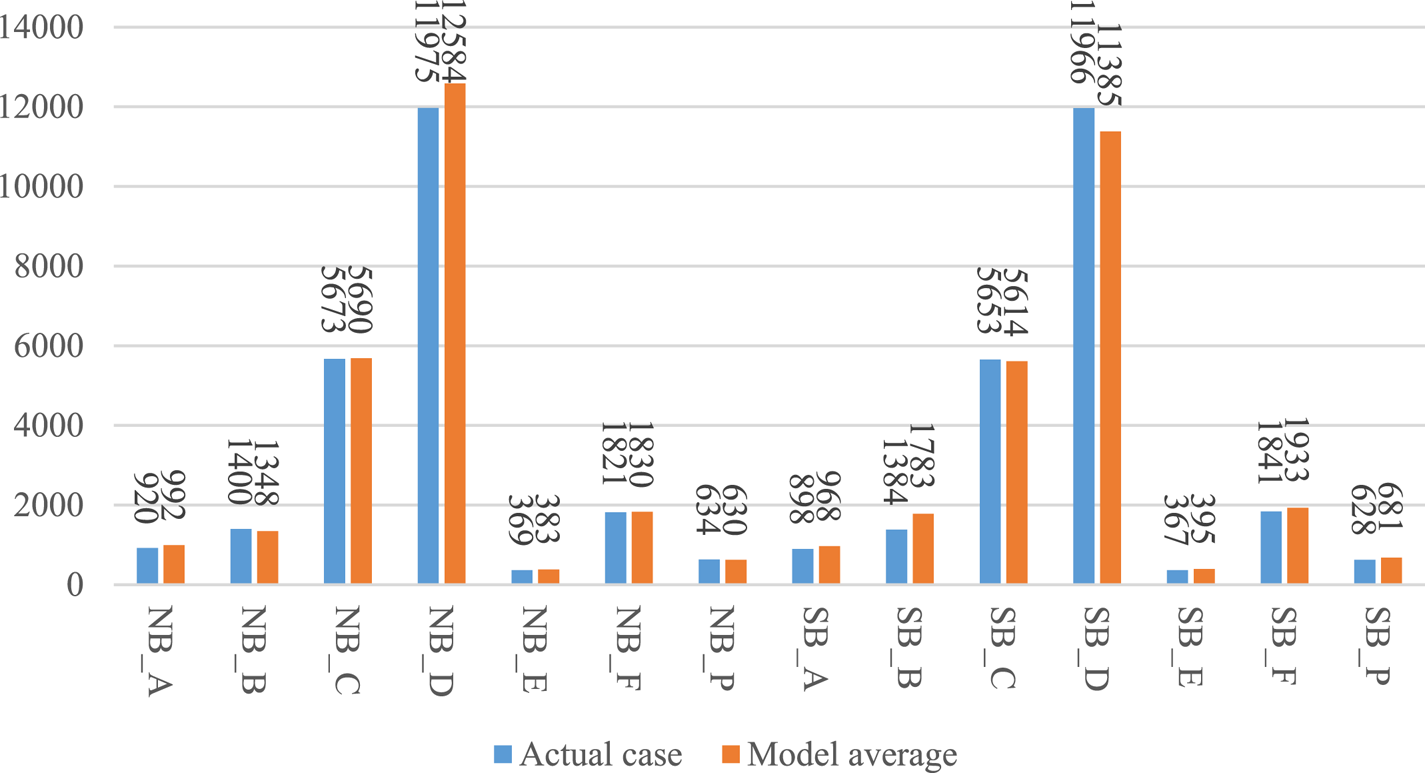
The number of vessels transiting the Strait of Istanbul in each simulation run and the actual number of vessels transiting the strait for 2011 (the ‘average transit traffic density’ scenario) are displayed in Figure 5. The actual number of transits for each vessel type in either direction is compared with the total number of transits for each vessel type in either direction obtained from the simulation model (based on data from 2011) by means of prediction intervals. The results show that actual transits for all vessel classes fall in the prediction interval of t distribution with α =0⋅1. This indicates that the predictions for the average transit traffic density are satisfyingly close to the actual transits. The average number of vessels transiting the strait in the simulation runs with 20 random replications and the actual number of vessels transiting the strait at ‘the higher transit traffic density’ scenario (year 2008) are displayed in Figure 6. The results show that actual transits for all vessel classes (except southbound class A and class F) fall in the prediction interval of t distribution with α = 0⋅1, which means that under high transit traffic, the transits from the model are close to the actual transits.
Vessel transit comparison for the average transit traffic density scenario

Vessel transit comparison for the higher transit traffic density scenario

The average number of vessels transiting the strait in the simulation runs with 20 random replications and the actual number of vessels transiting the strait at ‘the lower transit traffic density’ scenario (year 2014) are displayed in Figure 7. The results are sufficiently close to deduce that the scheduling algorithm sufficiently represents the real transit traffic pattern in 2014. The results show that actual transits for most of the vessel classes (except northbound class D, and southbound class B and D) fall in the prediction interval of t distribution with α = 0⋅1.
Vessel transit comparison for the lower transit traffic density scenario

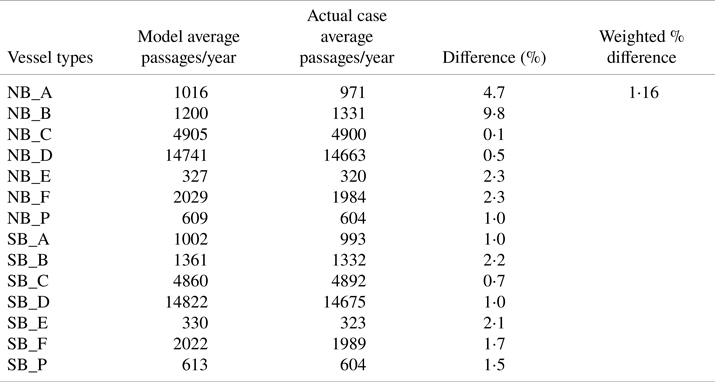
The average number of vessels transiting the strait in the general simulation run for all considered years closely follow the average number of real vessel transits in the same overall period. The deviation for the total number of vessels is 1⋅16%. This shows that average transits per year in the model is not very different from the actual passages. Table 5 displays the percentage deviation for each vessel class.
Average number of vessel transits

3.3. Average interentrance times of vessels
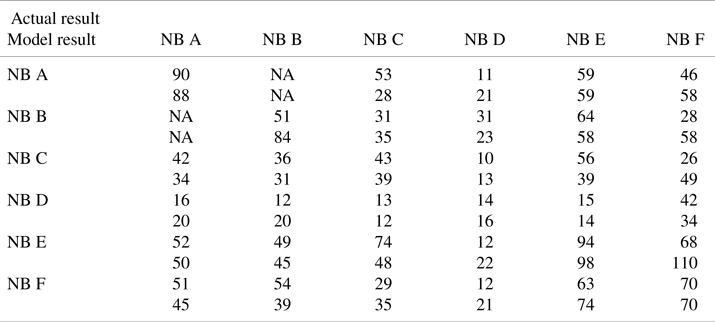
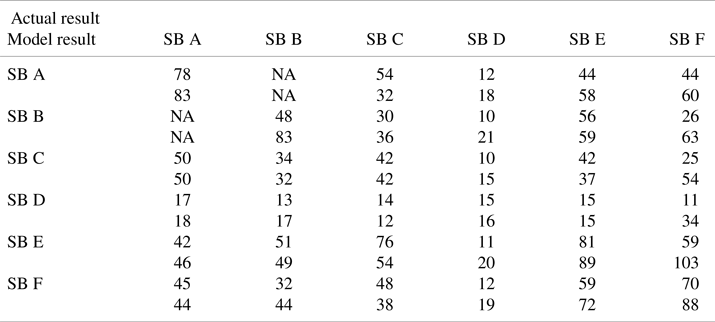
Average interentrance time intervals for consecutive vessels in each direction resulting in the simulation which was run with 20 replications regarding the average transit traffic density scenario (with 2011 data) and the actual results for 2011 are presented in Tables 6 and 7. For instance, for northbound class A vessels, the actual permitted interentrance time is 90 min whereas this duration is 88 min from the model results. The results are close to each other except: (i) the average interentrance time between two consecutive northbound class B vessels, (ii) the average interentrance time between class B followed by class F vessels in both directions and (iii) the average interentrance time between class E followed by class F vessels in both directions. These results show that the stochastic scheduling model well mimics the interentrance patterns of each vessel type in each direction.
Average interentrance times for northbound vessels

Average interentrance times for southbound vessels

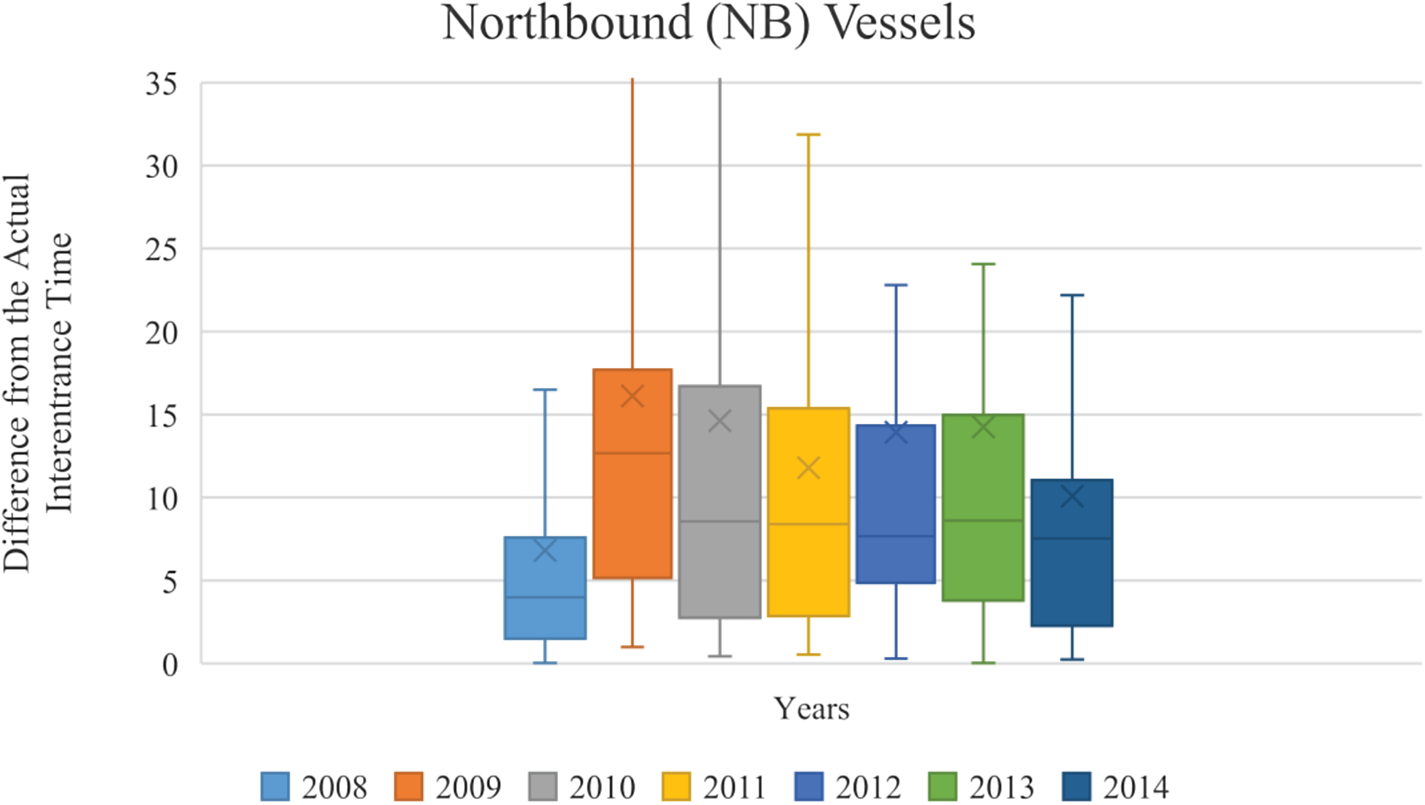
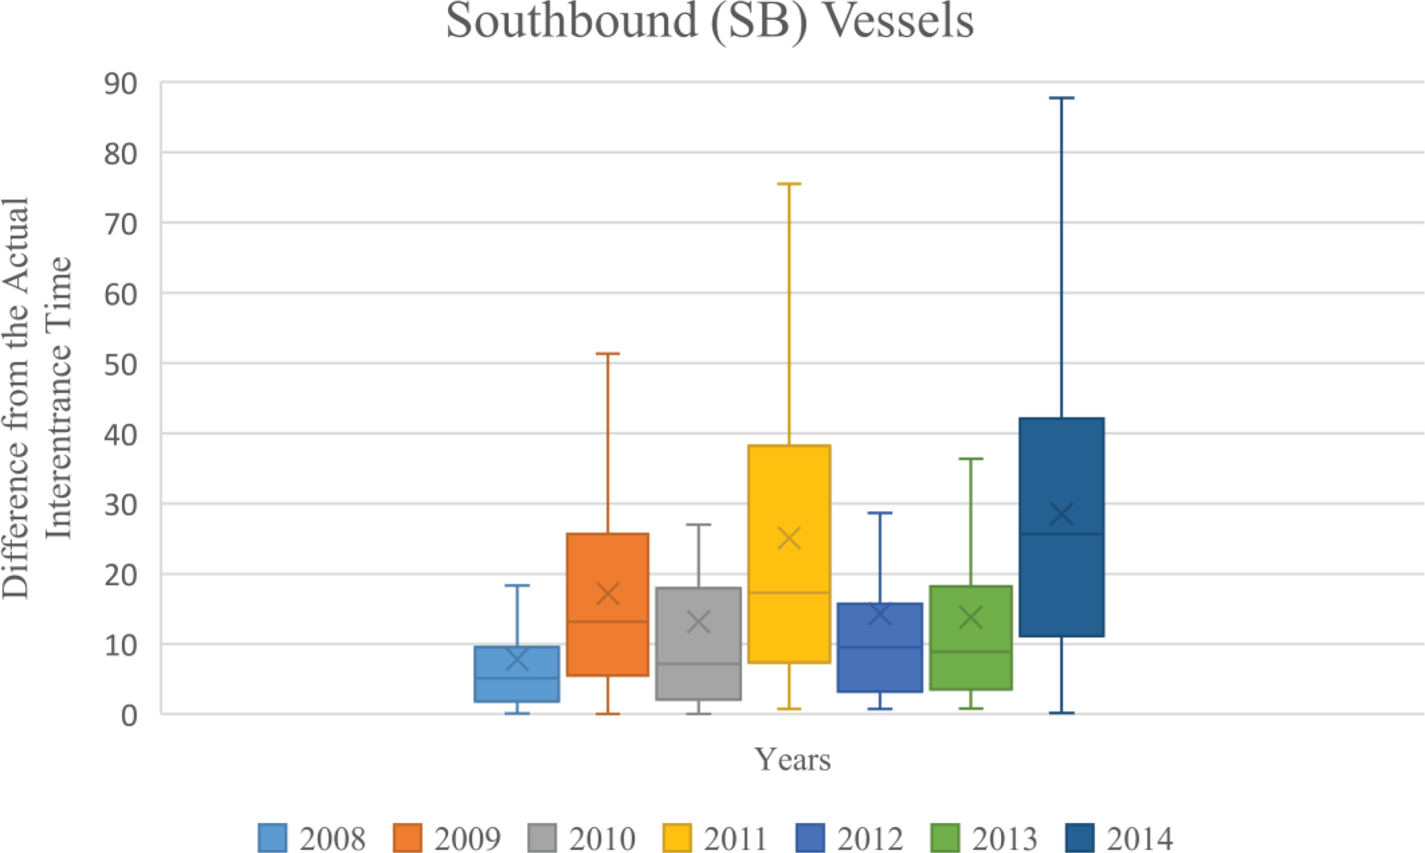
The absolute difference between the average interentrance times for consecutive vessels in each direction resulting in the simulation runs regarding each of the seven years and the actual average interentrance times for the studied years are displayed in Figures 8 and 9. The box and whisker plot results reveal that the model interentrance times are closer to the actual interentrance times for northbound and southbound vessels. Moreover, the average difference is higher in 2009 for northbound vessels, whereas the average difference is higher in 2011 and 2014 for southbound vessels.
Interentrance time differences between model results and actual cases for northbound vessels in different years

Interentrance time differences between model results and actual cases for southbound vessels in different years

For validation, in addition to comparing the model results with the actual traffic results, several models related to transit vessel scheduling in the Strait of Istanbul (Ulusçu et al., Reference Ulusçu, Özbas, Altiok, Or and Yilmaz2009; Özlem, Reference Özlem2011; Candanoglu, Reference Candanoglu2013; Sluiman, Reference Sluiman2017) are considered. However, the results of these studies do not match based on time and/or performance measures. Therefore, the validation process was conducted using actual traffic patterns in the strait from 2008 to 2014.
4. Conclusion
In this study, a simulation model with an embedded scheduling algorithm is developed in order to decide the type and entrance time of vessels arriving at the Strait of Istanbul. The model is based on both the R&R and past interentrance time statistics (incorporating subjective judgements of VTS operators) of the strait.
In the simulation model, interarrival times for each vessel type in either direction are generated from specific interarrival time distributions of vessel classes estimated and fitted based on actual interarrival times in the seven-year vessel transit data for the strait. When the generated interarrival times are compared with the real interarrival times for each vessel type, generated interarrival times for each vessel class in each direction are adequately representative of the real interarrival times over the seven years.
In the simulation model, interentrance times for each vessel type in northbound and southbound directions are determined through a proposed heuristic scheduling algorithm. Based on this algorithm, first, a class A vessel in an active direction and its entrance time is determined. Then, to identify the entrance time for the next entering vessel, random numbers (generated from the fitted distributions of actual interentrance times for each vessel pair in northbound and southbound directions) and the minimum pursuit time for each successive vessel pair gathered from R&R are used. Instead of just relying on vessel traffic experts, the scheduling algorithm finds the most appropriate vessels to enter and their time of entrance to the strait for both daytime and nighttime transit vessel traffic. Then, the model average interentrance times for each vessel type (determined by 20 simulation runs for each year from 2008 to 2014) are compared with the actual interentrance times for each vessel type (for each year from 2008 to 2014). The average interentrance times for successive northbound (southbound) class A vessel (determined by 20 simulation runs for each year from 2008 to 2014) are compared with the actual interentrance times of successive northbound (southbound) class A vessel (the most important vessel class in the daytime scheduling policy of the transit traffic in the strait). The two results are found to be close to each other. Moreover, the average interentrance times (determined by 20 simulation runs for each year from 2008 to 2014) of successive northbound (southbound) class B, C, D, E and F vessels are compared with the real interentrance times. Once again, the result is very close.
The average number of vessels transited in northbound and southbound directions for seven years, according to the scheduling algorithm, are compared with the actual average number of vessels that have transited the strait. The results are quite close to each other for all vessel classes.
Although the proposed model does not pursue the goal of improving the vessel traffic in the Strait of Istanbul, it reflects the actual traffic patterns well even in high and low transit traffic cases. The vessel density under these various traffic volumes may be predicted for planning concerns. The model may also provide a basis for future studies that aim to improve the performance measurements such as waiting time, number of vessels waiting in queue and number of vessels entered.
In summary, this proposed scheduling algorithm may help the decision-making process, especially for VTS vessel traffic planners, to systematise transit vessel entrance times and entrance orders from both directions. VTS authorities might use the interentrance times for several transit traffic densities and by automatising the schedule may observe expert entrance decisions under various conditions. This would also be an important decision support tool for transit vessel accident risk.
The scheduling algorithm provides quite a representative flow regarding the number of transit vessels entering the Strait of Istanbul and their interentrance time behaviour, however, there are still some significant differences in interentrance times for some vessel pairs (especially for class F vessels) compared with the realised interentrance times. Thus, the scheduling algorithm may be revised to decrease those variations by adding some calibration factors. Moreover, a detailed extra study with different daytime duration for each season may be conducted to see the effects of season on transit vessel scheduling. After this, the technique may be applied to other crowded waterways which require vessel passage planning.
Funding statement
This work was supported by the Scientific and Technological Research Council of Turkey, TÜBİTAK BİDEB [2211-A].
Appendix A
Example of the proposed scheduling algorithm