1. Introduction
Sprays are a collection of droplets dispersed in a moving gaseous phase. They have wide-ranging engineering applications, almost always to inexpensively increase the interfacial area by several orders of magnitude to enhance transport of mass, momentum and energy. Several modern diagnostic techniques have allowed the research community to probe sprays, the most popular among them being the phase Doppler particle analyser (PDPA). This instrument is a single particle counter which records drop size and velocity as well as the time of arrival of every drop that crosses a probe volume. Given the wealth of high quality data generated by these diagnostic tools, it is attractive to systematically apply time-series methods to obtain deeper physical insights – an exploration that the fluid mechanics community stands to benefit from. Time-series analysis (TSA) is a branch of modern data science with a long history of excellent contributions from the broad fields of statistics, econometrics, meteorology and engineering (Brockwell & Davis Reference Brockwell and Davis2002; Shumway & Stoffer Reference Shumway and Stoffer2017). TSA offers a rich repertoire of tools that show great promise in extracting valuable information from fluid dynamic data. As Brunton, Noack & Koumoutsakos (Reference Brunton, Noack and Koumoutsakos2020) point out in a recent review article, the use of these tools coupled with domain expertise is likely to yield insights into the governing processes that are translatable into application knowledge. In the closely related but relatively modern world of machine learning, several modelling paradigms and algorithms such as recurrent neural networks, genetic algorithms, dynamic mode decomposition and Koopman analysis have been applied to a variety of fields to understand complex processes from data. Emerging applications of these tools for dynamical (time- or space-correlated) data largely borrow ideas from TSA. Therefore, the techniques of TSA occupy a prominent place in the world of data science and yet their application to fluid dynamic data has been absent in the literature. On the other hand, most fluid dynamic simulations and experiments of any complexity yield a time series of data, which is usually discarded after estimating a probability density function (p.d.f.) of the data. Therefore, it is only natural to believe that employing formal TSA techniques to understand fluid dynamics data potentially holds higher value than the mere construction of a p.d.f. of the raw variable(s), as has been the standard practice.
We begin with a brief description of the motivation for this work. Droplets in a spray experience two kinds of forces – a drag force due to its interaction with the surrounding gaseous phase and an effective collision force due to collisions between neighbouring droplets. These forces are generally stochastic in nature and, as a result, spray evolution can be modelled as a random process. Since the spray is embedded in a continuous gas phase, coherent structures in the gas phase could induce correlated motion among the droplets. Therefore, as observed from a frame of reference fixed to the instrument probe volume, droplets arrive in a partly correlated and partly random sequence. A core motivation of this work is to understand the nature of this underlying correlation structure and to explore applications of the inferences from this knowledge. As an example, consider successive droplets arriving in the probe volume in a PDPA. They can be completely uncorrelated in properties – size and volume – which would make the spray transport a random process. If the properties exhibit any form of a correlation, then the process is no longer an ideal random process. Real sprays, as we will show later, fall in the latter category and the temporal microstructure differs across sprays and is rich in physics.
It is well known that sprays from different types of atomizers are characterized by droplets whose diameters and velocities vary over several orders of magnitude. The corresponding p.d.f. may be non-Gaussian, but qualitatively similar. Furthermore, it is only natural to assume that the droplets are possibly influencing each other in time rather than not, due to the nature of forces governing their motion. Therefore, using moments of such distributions to describe the entire process would not yield the complete picture. A p.d.f. representation of the data also pays no regard to the time sequence in which the drops crossed the probe volume. Therefore, a more appropriate framework would treat the spray as a time-unsteady process and apply TSA to discover the physics hidden in the time sequence. These arguments constitute the core motivation of the current work, which is to study the spatio-temporal microstructure by analysing the data as a time series using modern data science tools. While this work will be restricted to spray data analysis, we believe that the inferences have import for the broader area of fluid mechanics.
Earliest attempts to characterize sprays as a statistical process were due to Edwards and Marx. In a sequence of four ground-breaking papers, Edwards & Marx (Reference Edwards and Marx1995a,Reference Edwards and Marxb, Reference Edwards and Marx1996a,Reference Edwards and Marxb) relied on single and multi-point statistical descriptions of sprays to provide a framework in which sprays can be analysed as a random process. They posed a set of assumptions that would characterize an ideal spray. They are: (i) droplets are non-interacting point particles, (ii) each droplet contains a set of marks that represent droplet characteristics, (iii) the droplet field is not highly ordered and (iv) the statistics of the droplet field are not affected by the events in the past or future but only by the present. They considered a spray to be a superposition of several Poisson processes, one for each of the classes that make up the spray. In continuation, Widmann et al. (Reference Widmann, Charagundla, Presser, Yang and Leigh2000), studied PDPA data from methanol sprays and concluded that spray arrival times can be adequately modelled by a Poisson process. Gupta et al. (Reference Gupta, Presser, Hodges and Avedisian1996) examined the effect of combustion on a spray and found that it suppresses recirculation. Presser et al. (Reference Presser, Avedisian, Hodges and Gupta1997) found that larger droplets migrated to the edge of a swirling spray in comparison to a non-swirling spray. In both cases, the active role of the fluid dynamics of the background air on droplet transport was emphasized. Edwards & Marx (Reference Edwards and Marx1995b) evaluated the idea of steadiness of the spray using inter-particle arrival times. First, they classified sprays based on a governing intensity function  $\lambda (t)$. A constant
 $\lambda (t)$ would imply a steady spray. Non-steady sprays were further classified as either deterministic or stochastic based on whether
 $\lambda (t)$ is a deterministic function of time or not. Stochastic sprays can be further classified based on the order of stationarity as strictly stationary, weakly stationary or non-stationary. They showed criteria based on the inter-particle arrival times to classify sprays based on the degree of stationarity. However, this characterization of stationarity is only limited to the inter-particle arrival time distribution. It is of interest to expand the definition to other properties of the spray where a prior distribution is not known.
As elegant as the work of Edwards & Marx (Reference Edwards and Marx1995a,Reference Edwards and Marxb, Reference Edwards and Marx1996a,Reference Edwards and Marxb) was, it has not been applied to real experimental data to test the validity of the underlying assumptions as well as to analyse a spray in their framework. Noymer (Reference Noymer2000) and Hodges et al. (Reference Hodges, Presser, Gupta and Avedisian1994) used single point measurements from PDPA to characterize the dynamical behaviour in sprays, especially from the point of view of cluster formation. They defined a framework to identify groups of droplets that are in close proximity to each other and obtained a characteristic frequency of that group using Fourier transform. Kolakaluri, Subramaniam & Panchagnula (Reference Kolakaluri, Subramaniam and Panchagnula2014) recognized the principal challenges in spray modelling, studied various modelling approaches and presented a comparative assessment. They compared two flow modelling approaches, the random field approach, where both carrier and dispersed phases are random in the Eulerian frame, and the point process approach, where the dispersed phase is stochastic in a Lagrangian frame while the carrier phase is random in the Eulerian frame. Subramaniam (Reference Subramaniam2000, Reference Subramaniam2001) modelled sprays using the droplet distribution function and showed the relationship between the droplet distribution function and the p.d.f. associated with the droplets themselves. Heinlein & Fritsching (Reference Heinlein and Fritsching2006) analysed inter-particle arrival times to identify unsteady characteristics in the flow, namely droplet clustering. They concluded that clustering occurs at the centre of the spray in a pressure atomizer and, for the air-blast atomizer, at the outside spray area. More recently, Godavarthi et al. (Reference Godavarthi, Dhivyaraja, Sujith and Panchagnula2019) analysed the same spray data as are analysed in this work, but using multifractal techniques. From their analysis, they demonstrated a way to classify different sprays using the Hurst exponents and the width of the multifractal distributions. While these approaches attempted to study the dynamical behaviour in sprays, each from their own motivations, they do not provide a generalized and rigorous time-series and modern data analytics approach to multiphase flows.
1.1. Conditional probability matrix
We reinforce our motivation by presenting a conditional probability analysis of two sprays. The PDPA generates a data set as a time series recording the time of arrival, drop size and velocity sequentially. Considering one such data set, we divide the diameters (d) of all the sampled drops into three classes sorted by drop size – tiny ( $T$), intermediate (
 $I$) and big (
 $B$) – such that each set contains an equal number of drops and where the set
 $T$ contains the smallest
 $\frac {1}{3}$ of all the droplets and so on. Now if one were to identify from the time series that the
 $i\textrm {th}$ drop was tiny (
 $d_i \in T$), a question of interest is: Can one make a predictive claim about the next
 $(i+1)\textrm {th}$ drop? If each of the droplet size classes were independent, then the conditional probability P given by the expression
 $P(d_{i+1} \in X| d_i \in Y)\text{ would be equal to }\frac{1}{3}$, since each of the three drop classes contains equal counts. Here,
 $X$ and
 $Y$ are either
 $T$,
 $I$ or
 $B$. Therefore, these conditioned probabilities can be presented as a
 $3 \times 3$ matrix. We now ask the question whether any of the elements of this matrix are significantly different from
 $\frac {1}{3}$. The droplet diameter time series is classified into three bins – tiny, intermediate and big, based on percentile. Similarly, the droplet velocity is classified into slow, medium and fast, while the droplet inter-particle arrival time is classified as quick, normal or delayed.
Consider the case of droplet diameter. Given that a particular droplet is small, the probability that the following drop is small, intermediate or big is calculated from the time series. This gives us a  $3 \times 3$ matrix of values. If the spray were to be perfectly random, all the entries of this matrix will be
 $1/3$ when scaled with the total number of entries in each row. This would mean that there is an equal probability for the droplet following a tiny drop to be tiny, intermediate or big. Surprisingly, the experimental measurements show that this is not the case, indicating that the spray is not a pure or ideal random process, but rather one with some element of predictability. Table 1(a) shows the conditional probability matrix for the droplet diameter at the edge of the spray (AL3,
 $r = -25$ mm). The entries of this matrix are significantly different from
 $1/3$. Statistically significant values are shown in boldface text, and it can be seen that all the terms are significant at the edge of the spray. Also, the diagonal terms show high values, indicating that the probability of droplets of similar size following one another is significant. A similar matrix computed at the centre of the spray (AL3,
 $r = 5$ mm) is shown in table 1(b). The diagonal terms are still significant, with a higher probability of tiny droplets following tiny droplets and big droplets following big droplets.
Conditional probability matrices for droplet diameter.

The foregoing analysis clearly shows that the clustering characteristics at the edge of the spray and near the centre are fundamentally different. The differences in their behaviour, as we will show later, can be studied rigorously using tools from time-series analysis.
In an effort to highlight a shortcoming of standard practices in spray data analysis, we present two aspects here. The first one is concerned with the probability distribution of the data from two spatial locations – one near the edge of the spray (AL3,  $r = -25$ mm) and another near the centreline of the spray (AL3,
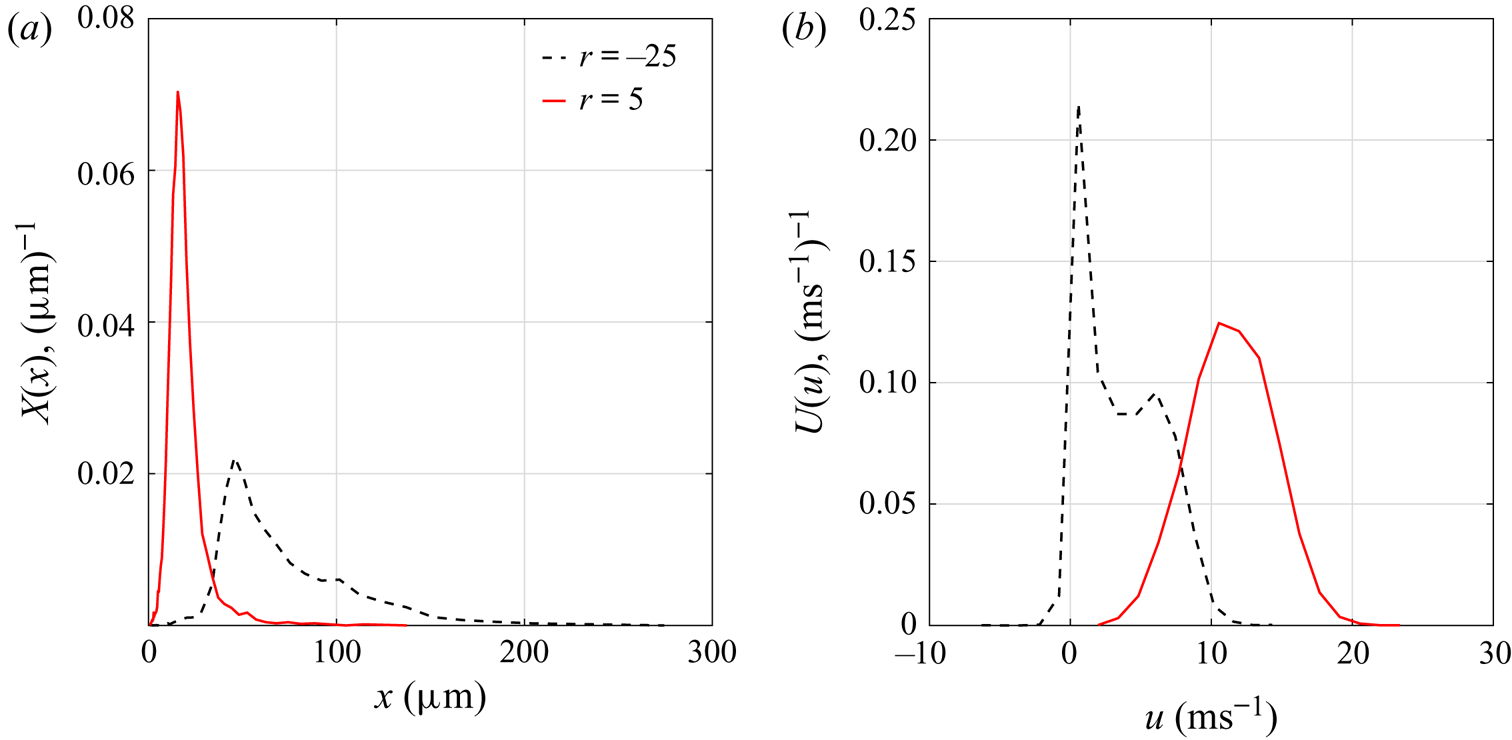
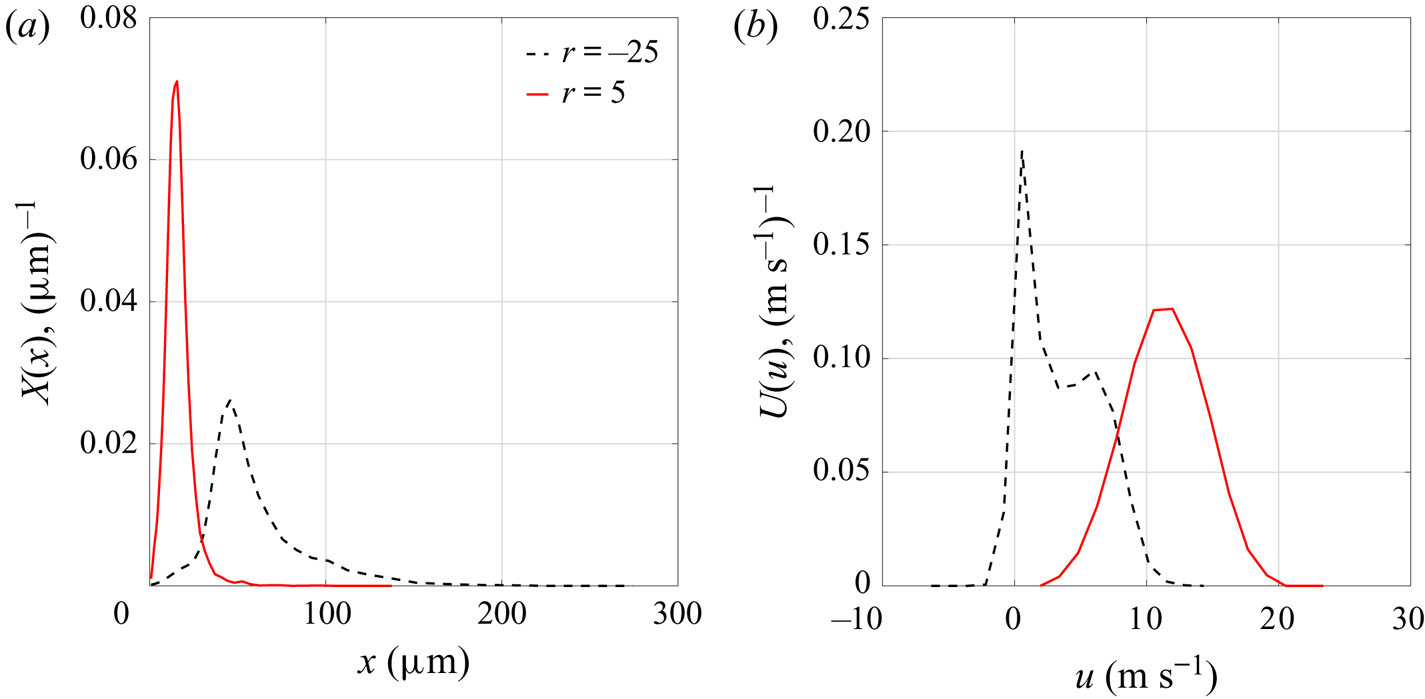
 $r = 5$ mm). Figure 1(a) shows the droplet diameter p.d.f. at these two locations. The p.d.f. shows a significant variation at the centre of the spray in comparison to the edge of the spray, where it can be seen that diameter varies over two orders of magnitude. In contrast, the axial velocity p.d.f. shown in figure 1(b) appears to be normally distributed near the centre of the spray, while it is distinctly non-Gaussian near the edge of the spray. While these standard inferences from this type of data presentation are quite common in the spray literature, such a presentation discards all information pertaining to the temporal correlation in the data. Unfortunately, the distribution plots in figures 1(a) and 1(b) provide very little to no meaning of the distributional characteristics of the underlying stochastic process in the presence of correlations since p.d.f.s provide meaningful inferences only when the data constitute a random sample, i.e. independent and identically distributed (i.i.d) data. In fact, this naive presentation of fluid mechanic data as a p.d.f., which is common in the multiphase flow and turbulence literature, is technically incorrect. We will later on suggest a correct method for constructing a fluid mechanic data p.d.f. when the data exhibit temporal correlation.
Droplet distributional properties at the edge ( $r = -25\ \textrm {mm}$) and centre of the spray (
 $r = 5\ \textrm {mm}$) for (a) diameter and (b) velocity in an air-blast spray for
 $z=25\ \textrm {mm}$.

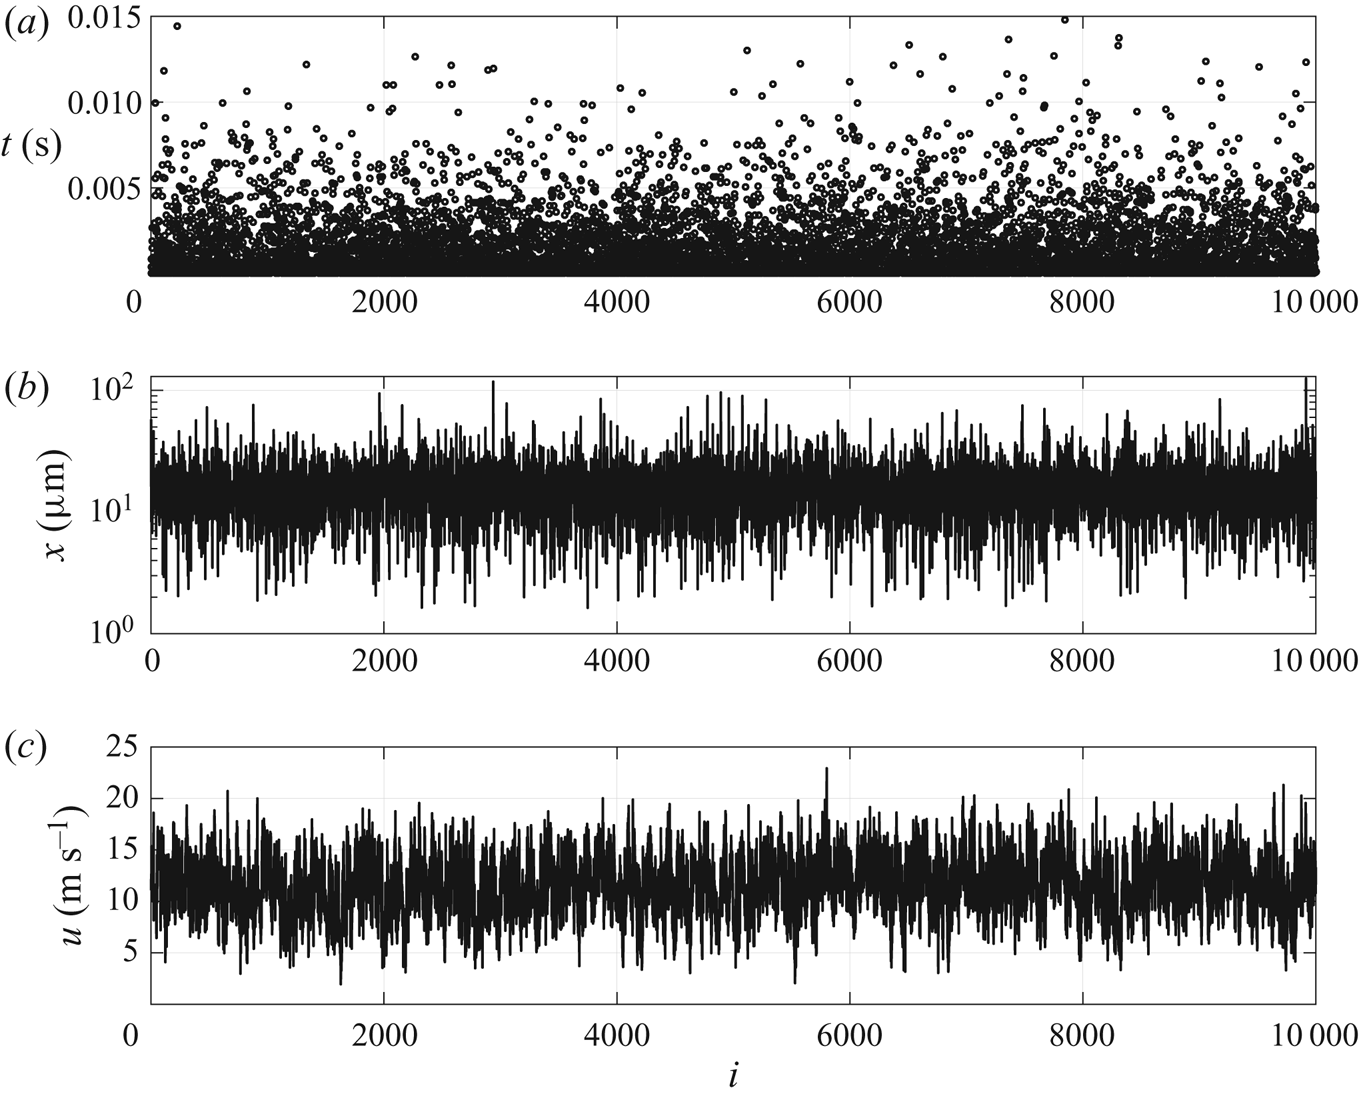
To illustrate the second aspect, consider figure 2, which shows the time series of the arrival time, diameter and velocity of typical data obtained from an air-blast spray. The abscissa in these figures is the droplet index  $i$, which indicates a sequential index number associated with each measured drop. Figure 2(a) shows the inter-particle arrival time, which is the difference between the actual arrival times of successive droplets. One can qualitatively observe clusters where drops are likely to arrive in the probe volume closely spaced in time. This could be due to the dynamics of the underlying gas phase flow, including that associated with vortices. Figure 2(b) is a plot of the time series of droplet diameter. It can be seen that the drop size data indicate that small drops in the time series are likely but occur in clusters. Figure 2(c) is the time series of the droplet streamwise velocity, which is closely distributed around a mean value between
 $10$ and
 $15\ \textrm {m}\ \textrm {s}^{-1}$. In conclusion, as can be seen, a time-series model which predicts an entire time series including the p.d.f. would present a more accurate model of the droplet transport than the p.d.f. alone. From these figures, especially from figure 2(c), one can observe qualitatively that the mean shows correlated behaviour on short time scales. Such a correlation contains information that cannot be discovered without a formal TSA of the data and will be the subject of investigation.
Time series of droplet (a) inter-particle arrival time, (b) droplet diameter and (c) velocity on the edge  $(r = -25\ \textrm {mm})$ of an air-blast spray at
 $z = 25\ \textrm {mm}$.

With the above motivation, we ask the following specific questions:
(i) Are time series of droplet inter-particle times, diameters and velocities stationary in the sense discussed above? If not, what are the physical causes of non-stationarity?
(ii) Does there exist an internal spatio-temporal correlation in the droplet property space viz., inter-particle time, diameter and velocity?
Answers to these questions are important to two specific modelling directions that are generally pursued in the literature. Firstly, typical discrete particle modelling of multiphase transport currently relies on particle injection from a spatial location, where the particle size and velocity are obtained from a joint size–velocity p.d.f. in a time-uncorrelated fashion. In contrast, it would be realistic to include any temporal correlation inherent in the injector characteristics. Secondly, the physical phenomenon determining the strength of the temporal correlation could be different in different injectors. Therefore, the strength of the temporal correlation could be used as a marker to identify a class of injectors. More importantly, the strength of this temporal correlation could bear an effect on several engineering applications. For example, designing the ignition system in a spray combustor will rely on the fact that a cloud of small (readily volatile) drops is beneficial for good ignition.
The overall strategy for the proposed work is as follows. Time-series data of droplet diameter and velocity are measured at various radial locations. At a given radial location, the conditional probability matrix of drop size and velocity is evaluated. A scalar measure is used to quantify the distance of this matrix from a perfectly random state. The variation of this scalar measure indicates the change in ordering/predictability of the spray. Subsequently, a systematic TSA of the data with the aid of auto- and partial-correlation functions is carried out. This is also supplemented by conducting statistical tests of integrating effects (random walk behaviour) and changing variability in the acquired data. The latter is termed unconditional heteroskedasticity in the time-series literature. After pre-treating the data for these special characteristics, whenever required, optimized linear time-series models, namely, auto-regressive moving average (ARMA) models, are developed for variables at different spatial locations as deemed appropriate by the correlation analysis.
Time-series (ARMA) models optimally predict the mean values of the respective variables using endogenous driving forces that have constant variance. However, several processes (e.g. econometric series) do not lend themselves to this model and are likely to be self-driven by a randomness that has changing variance that is additionally stochastic. This is statistically known as conditional heteroskedasticity (CH), a term that was popularized due to a pioneering work by Engle (Reference Engle1982a). A simpler perspective of CH is that there exists a correlation among squared prediction errors, giving the process a flavour of nonlinearity. An appropriate test to determine the presence of these characteristics is carried out on the prediction errors. Subsequently, generalized autoregressive conditional heteroskedasticity (GARCH) models are developed for all those measurements at spatial locations that test positive for CH.
2. Data acquisition and pre-processing
Two classes of experimental data are analysed in this paper – (i) air-blast spray data and (ii) pressure swirl spray data. The air-blast spray data were obtained from a swirling axisymmetric free jet spraying calibration fluid MIL-PRF-7024 type 2. Details of the experimental set-up and atomizer configuration are available in Rayapati et al. (Reference Rayapati, Panchagnula, Peddieson, Short and Smith2011). The pressure swirl spray data were obtained using water as a working fluid and have been reported by Dhivyaraja et al. (Reference Dhivyaraja, Gaddes, Freeman, Tadigadapa and Panchagnula2019). The pressure swirl atomizer data were obtained on a series of specially manufactured micro-electro-mechanical-system (MEMS) atomizers. These sprays were of a very low Reynolds number and high Weber numbers, causing small droplet sizes comparable with air-blast sprays, which makes these two sprays comparable from a drop size p.d.f. perspective. In both cases, a PDPA was used to acquire the data from several downstream locations of air-blast atomizer sprays and pressure swirl sprays (see Bachalo & Houser (Reference Bachalo and Houser1984) for details). The information pertaining to optical settings of the PDPA transmitter and receiver are given in Dhivyaraja et al. (Reference Dhivyaraja, Gaddes, Freeman, Tadigadapa and Panchagnula2019).
The air-blast atomizer was mounted on a traverse system and a full radial scan was performed in order to obtain PDPA data at regularly spaced radial locations 1 mm apart, ranging from the centreline to the edge of the spray. Measurements were made at three axial locations from the atomizer,  $z=9.5$,
 $12.5$ and
 $25\ \textrm {mm}$. At each axial location, PDPA measurements of droplet arrival time, diameter, streamwise velocity and radial velocity were made at a number of radial locations – 36 radial locations (
 $-17$ mm to
 $18$ mm) at
 $z=9.5\ \textrm {mm}$, 40 radial locations (
 $-19$ mm to
 $20$ mm) at
 $z=12.5\ \textrm {mm}$ and 71 radial locations (
 $-35$ mm to
 $35$ mm) at
 $z=25\ \textrm {mm}$. Similarly the pressure swirl atomizer data were captured at four axial locations: 11, 21, 33 and 44 mm. A radial scan was performed at regularly spaced locations 2 mm apart spanning the entire spray. The validation rates in all cases were greater than
 $95\,\%$, ensuring that the time-series data of successively sampled drops are preserved to a high degree of fidelity.
From the analysis of figure 1 we know that the density distributions of several of the spray parameters are not normally distributed. It is well known that linear time series give optimal results when the underlying density function is Gaussian. Hence, a transformation is required to transform the variables in such a way that their density is Gaussian distributed. We have employed a two-step transformation procedure to accomplish this objective: (i) a probability integral transform (PIT) to map a variable (say diameter, velocity or inter-particle times) to a variable that is uniformly distributed, (ii) inverse mapping of the uniform distributed variable to a standard normal distribution, i.e. zero mean and unity variance, using its corresponding quantile value assuming normal distribution. PIT uses a variable's empirical cumulative distribution function as an algebraic map to a new variable, which is expected to be uniformly distributed. This transformation conserves both the original density distribution as well as the time serial nature of the data, since both steps (i) and (ii) are strictly monotonically increasing algebraic transformations.
3. Results and analysis
The presentation in this section is arranged as follows. In § 3.1, we present the results from a requisite first-stage analysis of process characteristics, specifically investigating the time invariance of statistical properties (known as stationarity) and other non-idealities. Detailed results from the conditional probability matrix analysis discussed earlier in § 1.1 are presented. Then, the main results from time-series modelling including the requisite temporal correlation analysis are presented in § 3.2.
3.1. Investigating non-idealities in the spray data
We investigate two forms of idealities (or the lack thereof) in spray data, namely, stationarity and the Poisson process assumption. A first step in statistical modelling would be to understand the nature of the data we are working with, especially their fundamental characteristics such as stationarity. It is widely assumed that fluid mechanic data are stationary. It is under this assumption that most turbulence models (for example) are constructed. In general, a time series, or more strictly, the generating random process, can either be stationary or non-stationary. Stationarity, as is well known, refers to the time invariance of the statistical properties of the associated random process. In the most restricted sense, stationarity requires time invariance of the joint p.d.f. of observations of all sizes. This is usually an idealism that is rarely satisfied. Fortunately, for linear Gaussian processes, it suffices to require the time invariance of first- and second-order properties – this is known as wide-sense stationarity (WSS), weak stationarity or second-order stationarity. The three requirements are essentially mean invariance, finite variance and that the auto-correlation (internal correlation) function be dependent only on the lag (observation distance) and not on time. We shall only concern ourselves with WSS.
Deviations from stationarities (non-stationarities), are of many different types. However, it suffices to discuss the three most commonly observed forms of non-stationarity, viz., trend (where the mean shows a smooth deterministic trend), integrating effects and changing variance (also known as unconditional heteroskedasticity). Trend-type non-stationarity is observed when stochasticity is superposed on a mean that varies deterministically (usually a polynomial function) with time. For example, it is expected that an unsteady turbulent velocity field (where the mean velocity is a slower function of time) would show this form of non-stationarity. The integrating effect, also known as unit root non-stationarity from a time-series modelling perspective, belongs to a class of random walks with persistent memory of the past (initial conditions). Changing variability, i.e. heteroskedasticity, are of two classes; unconditional and conditional. The former, which we shall refer to simply as heteroskedasticity (without the prefix), is associated with a non-constant variance as a function of time, while the latter refers to non-constant variance of conditioned time series, which are essentially prediction errors. While a trend-type non-stationarity arises out of the time-varying behaviour of the mean (first moment of the instantaneous p.d.f.), unconditional heteroskedasticity arises out of the time-varying nature of the variance (second moment of the instantaneous p.d.f.). CH is primarily due to the inherent nonlinearities, which unfortunately cannot be determined through either a visual or statistical analysis of the data. It can only be determined through a test on the prediction errors. It is therefore necessary to construct predictions or a model before a test of CH can be conducted. The CH characteristics were initially observed in econometric series and intrigued many an econometrician, until a successful model in the name of ARCH was proposed by Engle (Reference Engle1982b). Interestingly, our study reveals the presence of CH in the spray data, bringing up certain curious similarities among the characteristics of these two completely different phenomena. In passing, it may be noted that a process could be trend stationary while still being heteroskedastic. We show evidence of this behaviour in the spray data of interest.
The presence of trends, integrating effects and unconditional heteroskedasticity can be ascertained with the help of statistical hypothesis tests. The augmented Dickey–Fuller (ADF) test is used to check for unit roots (integrating effects), while the Kwiatkowski–Phillips–Schmidt–Shin (KPSS) test is used to check for trend stationarity. The Mcleod–Li and Priestley–Subba Rao (PSR) tests are used to check for unconditional heteroskedasticity. See appendix A.1 for details pertaining to these tests. The results of these tests are presented graphically in figures 3 and 4 for air-blast and pressure swirl spray data, respectively. CH tests can be conducted only after a time-series model is developed. Therefore, it shall be discussed in § 3.2.
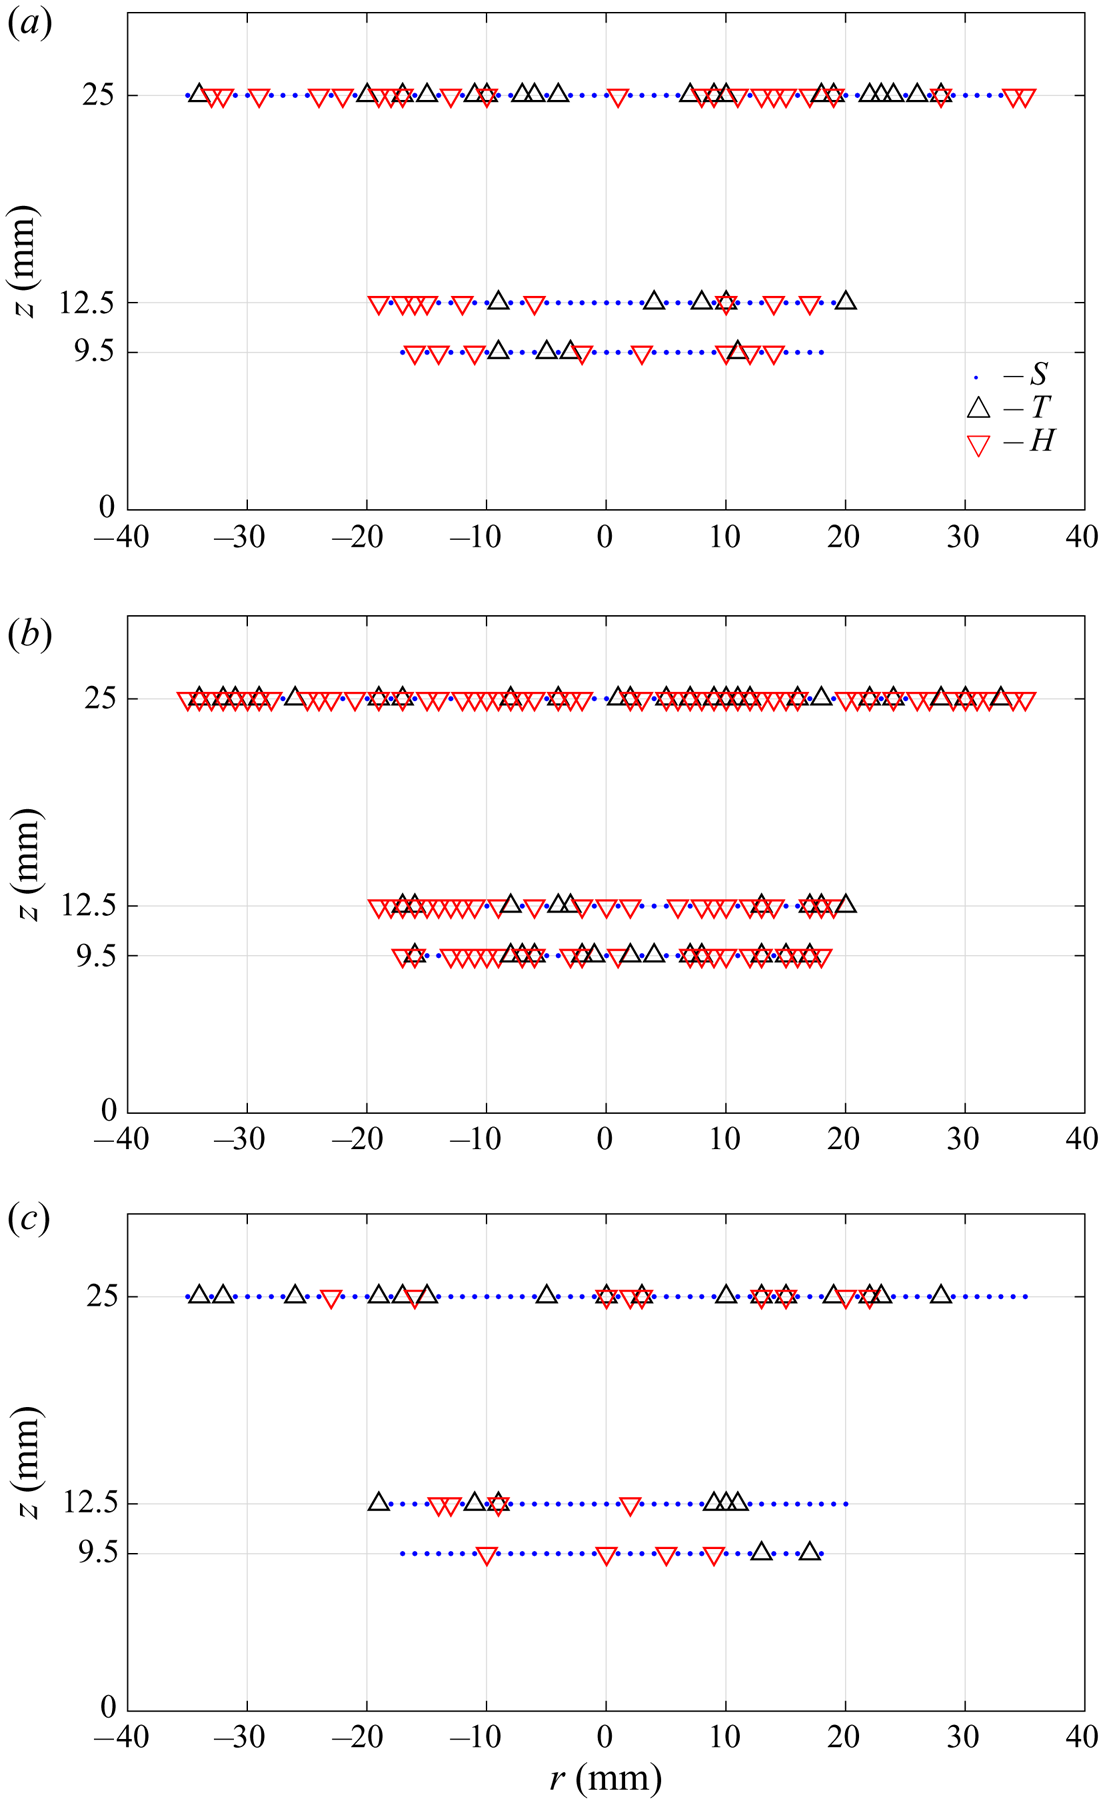
Plot indicating locations where non-stationary behaviour is observed in an air-blast spray for (a) diameter, (b) axial velocity and (c) inter-particle time. Here,  $T$ indicates trend-type non-stationarity,
 $H$ indicates heteroskedasticity and
 $S$ indicates stationary behaviour (or lack of
 $T$- or H-type non-stationarity). Although we tested the data for integrating (
 $I$) type non-stationary behaviour, it was not observed in any of our data sets. Diameter and inter-particle time distributions show non-stationary behaviour at fewer locations in the spray than velocity distributions.

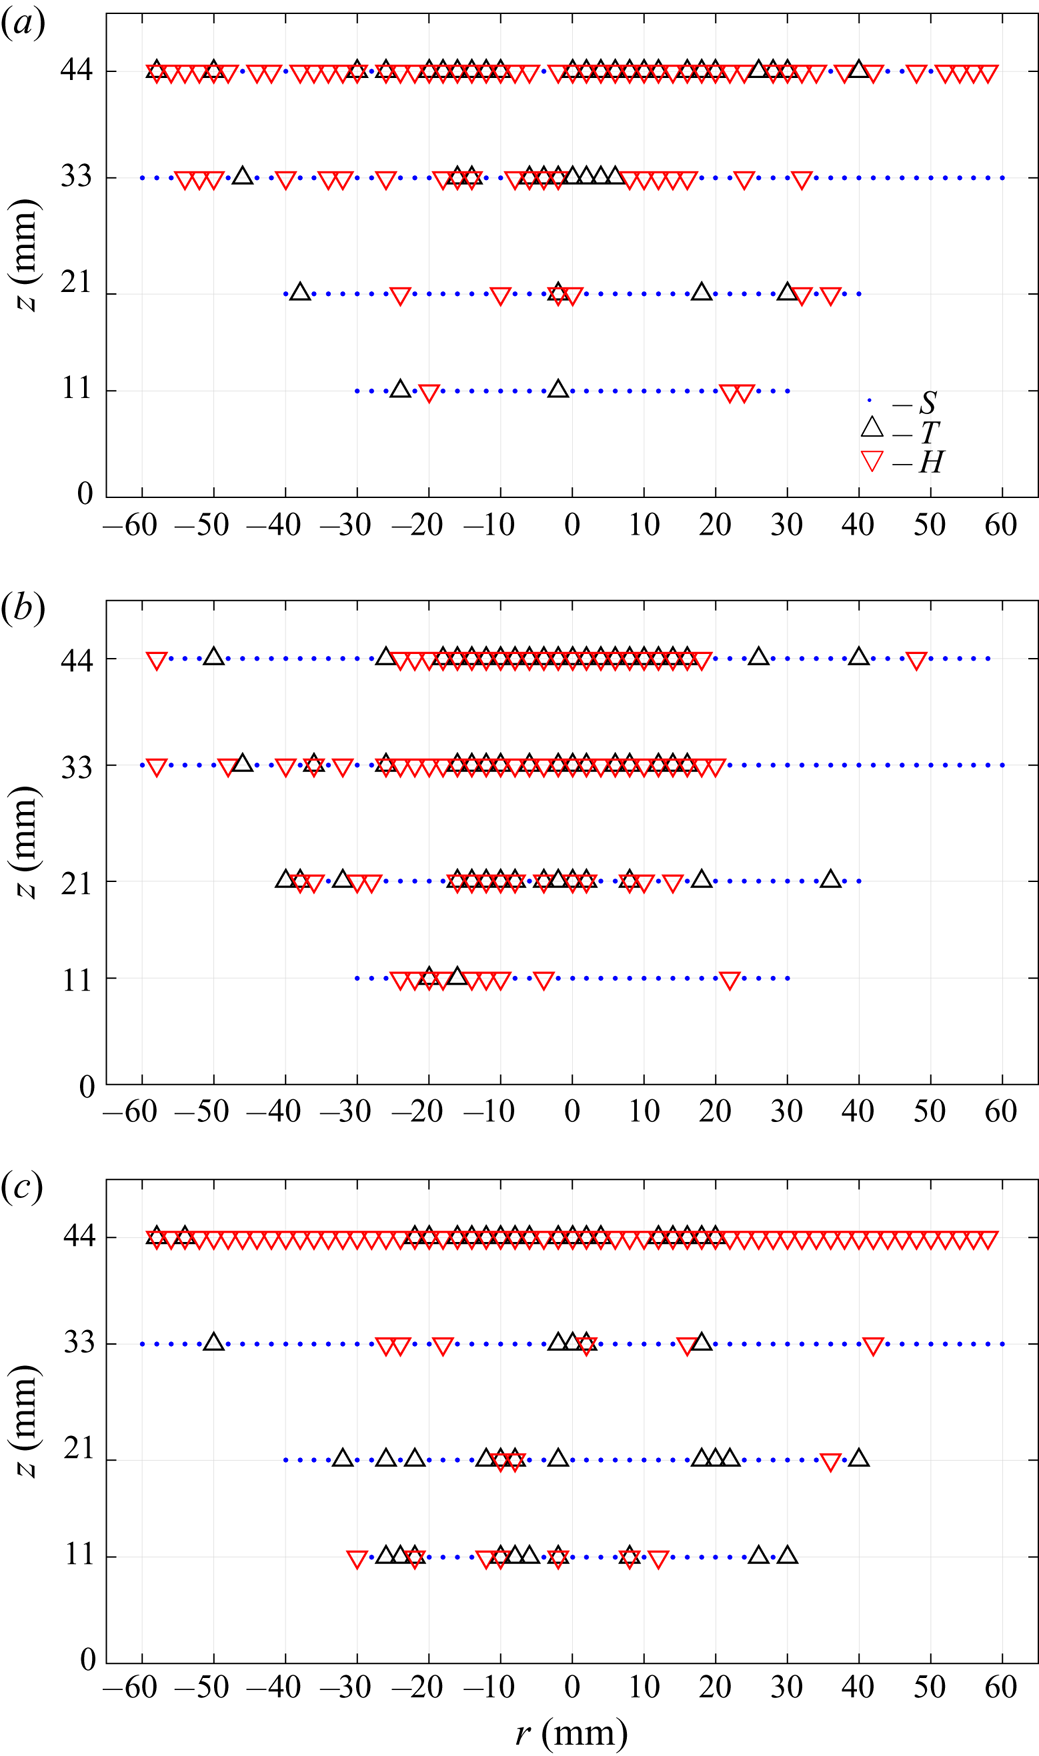
Plot indicating locations where non-stationary behaviour is observed in a pressure swirl spray for (a) diameter, (b) axial velocity and (c) inter-particle time. Here,  $T$ indicates trend type non-stationarity,
 $H$ indicates heteroskedasticity and
 $S$ indicates stationary behaviour (or lack of
 $T$- or
 $H$-type non-stationarity). Although we tested the data for integrating (
 $I$) type non-stationary behaviour, it was not observed in any of our data sets. The data exhibit non-stationary behaviour at farther downstream locations.

Figure 3 presents a graphical representation of non-stationarity observed in each of the three parameters characterizing the droplet time series for an air-blast spray. This figure is a plot of the physical locations in the spray (axial versus radial location). Every one of these locations is marked by a symbol, indicating the observation of weak stationarity or non-stationarity at that location. These symbols (as described in the legend) are also indicative of the type of non-stationarity, if present at that location. It is possible that two symbols are present at a given location, indicating multiple forms of non-stationarity at that location. Figure 3(a) is a plot showing the distribution of the stationary/non-stationary behaviour across spatial locations in the diameter series. Similarly, figures 3(b) and 3(c) are plots for velocity and inter-particle time series, respectively. As can be seen, the air-blast spray data are non-stationary in at least one of the coordinates at all locations measured. Both a trend and heteroskedastic behaviour can be observed. However, unit root non-stationary behaviour was not observed in any of the time series.
Three conclusions can be drawn from this figure. Firstly, the velocity time series is non-stationary at almost all measurement locations. This is somewhat expected since an air-blast spray involves a high momentum flux gas jet laden with droplets. The turbulent coherent structures in the gas jet cause the velocity of the drops to develop spatial correlation. In addition, the dominant source of non-stationarity is heteroskedasticity, indirectly implying that the role of turbulent fluctuations in determining drop velocities. Secondly, the inter-particle time series is also non-stationary, but more prominently only at the most downstream location. This indicates that, while droplet arrival statistics at the nearest axial location measured are mostly stationary, non-stationarity accrues, possibly due to clustering effects dominating downstream. We will revisit this thought later. Lastly, and most intriguingly, the drop size time series, especially at the farthest downstream location, is non-stationary. Again, the most probable reason is that the series is heteroskedastic, indicating that the variance of the drop size series is varying in a time-unsteady (but deterministic) manner. This seems to imply that, while droplet clustering has been discussed in the literature, size-selective clustering which is a new observation, seems to be prevalent in this spray.
Figure 4 is similar to figure 3 except that the data presented correspond to pressure swirl atomizer. From a comparison of the data in the two figures, one can conclude that pressure swirl data are non-stationary at fewer near nozzle locations in the spray than the air-blast data. This finding seems to strongly imply that the lack of a dominant background air flow in the near nozzle region of the pressure swirl spray could be a reason for this difference. In both figures 3 and 4, we observe that the data are non-stationarity at the farthest downstream locations. This implies that non-stationary behaviour (due to either clustering or ordering in velocity) is an accrued property. In conclusion, we believe that this is the first systematic and rigorous investigation of non-stationarity in any multiphase flow data set. These preliminary investigations point to a need for a more detailed study.
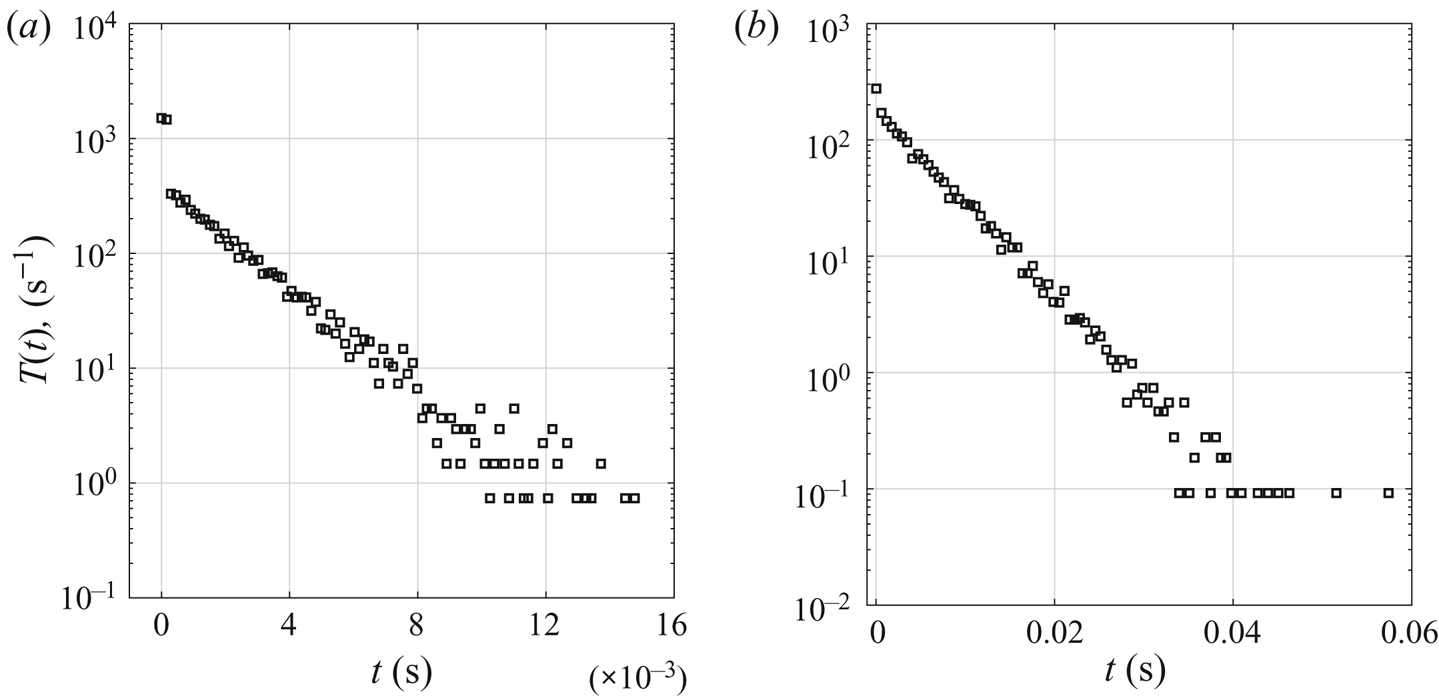
We next attempt to understand if the particle arrivals follow a Poisson process as has been idealized in previous modelling approaches. Figure 5 presents a p.d.f. of inter-particle times at a representative location in an air-blast spray and the pressure swirl spray. We have performed a hypothesis test on this p.d.f. to test whether it can be modelled as an exponential distribution, indicating a steady spray in the definition of Edwards & Marx (Reference Edwards and Marx1995a). The test shows that inter-particle times are not exponentially distributed, in spite of the fact that most of the p.d.f. shows an exponential decay. Specifically, a far larger fraction of droplets is closely spaced in time (near  $t=0$) than would be allowed by an exponential distribution. This could be a result of the vortical transport which rearranges droplet spacing. Similar tests on a pressure swirl spray also indicate that the inter-particle time distribution suggests a non-Poisson process. However, it can be noted that the peak in the p.d.f. for small
 $t$ is qualitatively less prominent in the case of a pressure swirl spray than in the case of an air-blast spray.
Probability distribution function of inter-particle arrival time of (a) air blast spray ( $z = 25\ \textrm {mm}, r = -25\ \textrm {mm}$) and (b) pressure swirl spray (
 $z = 33\ \textrm {mm}, r = -40\ \textrm {mm}$). The distribution is generally exponential except for the anomalous peak for small
 $t$. This is a result of closely clustered droplets. The peak is more obvious for the air-blast spray presented in (a).

The foregoing analysis clearly suggests that spray data exhibit non-stationarity whose nature varies with the axial and radial locations. In addition, the processes are non-Poisson. Therefore, we develop time-series models that respect the statistical nature of the data being modelled. The focus of this work, keeping the prime objectives in mind, is to develop linear time-series models which allow us to reveal the spatio-temporal correlation microstructure in such non-ideal spray data.
In order to understand the source of non-idealities, we discuss temporal correlations that cause a breakdown of the ideal spray assumptions. As a first step, a scalar measure  $\varSigma$ is calculated from the conditional probability matrix (see table 1 for an example calculation) as follows:
 \begin{equation} \varSigma = \frac{||A-J/3||}{||I-J/3||}. \end{equation}
In this equation,  $I$ is a
 $3 \times 3$ identity matrix, while
 $J$ is a similarly shaped matrix with 1 as all of its entries;
 $A$ is the conditional probability matrix from a time series, which has been shown for diameter in table 1;
 $\varSigma$ measures the distance of this matrix from a perfectly deterministic case, where a drop of given class only follows another drop of the same class. If the spray was fully predictable, with droplets of same class following each other, then the matrix
 $A$ will be an identity matrix and the scalar measure
 $\varSigma$ will have a value of
 $1$. On the other hand, if the spray is fully random, with no determinism, all the entries of
 $A$ will be equal to
 $1/3$ and the scalar measure would be zero. Thus,
 $\varSigma$ is a measure of ordering in spray, with
 $1$ representing perfect lock-on and
 $0$ indicating complete randomness.
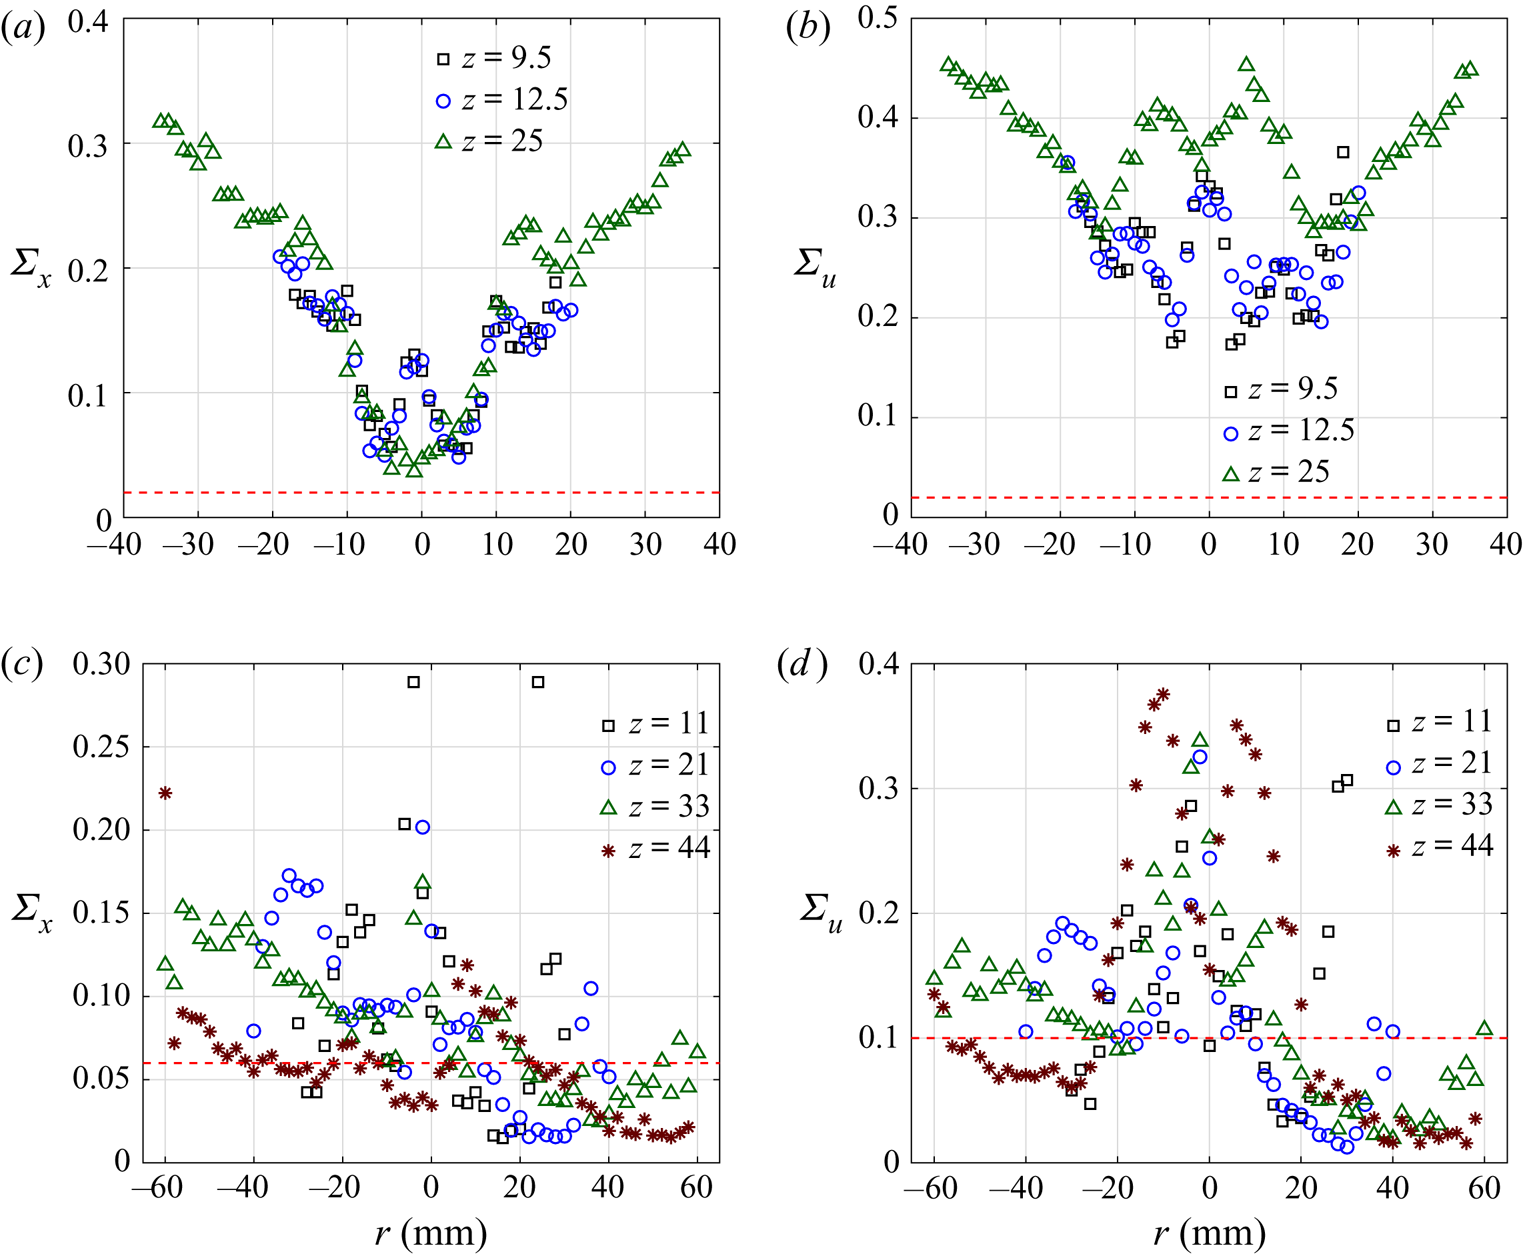
Figure 6(a) shows the radial variation of scalar measure for droplet diameter ( $\varSigma _x$) at three axial locations. It can be seen that the ordering increases towards the edge of spray. This is remarkable, in that a time sequence analysis of the data shows that a large drop is mostly followed by a large drop; similar drops appear to cluster together. Therefore, clustering is not just a phenomenon where droplet spacing is reduced; it is actually a case (at least near the edge of the spray) where drops of similar diameter form clusters. The physical mechanism underlying increased size-segregated clustering near the edge is not clear. However, the air-blast spray had a strong swirling outer air stream. The shear layer formed between the spray and this outer air stream could generate a vortex sheet. As a hypothesis, we suggest that each vortex could act as a miniature centrifuge to produce this size-segregated clusters in the bulk flow. The fact that these data were obtained sufficiently far away from the injector (where PDPA validation rates were high) did not destroy the correlation. The central spikes at
 $z=9.5$ and
 $12.5\ \textrm {mm}$ are due to the vortex core near the nozzle. The ordering in the centre disappears with breakdown of vortex core, as can be seen for
 $z=25\ \textrm {mm}$.
Radial variation of scalar measure  $\varSigma$ for ordering in (a) droplet diameter, (b) droplet velocity at various axial locations of air-blast spray, (c) droplet diameter and (d) droplet velocity at various axial locations of pressure swirl spray. The dotted line in all the plots indicates a confidence threshold for
 $\varSigma$.

Figure 6(b) shows the radial variation of the scalar measure ( $\varSigma _u$) for droplet velocity. Firstly, it can be seen that the pairwise correlation is statistically significant and stronger than that for the droplet diameter series. The data at
 $z=9.5$ and
 $12.5\ \textrm {mm}$ show central peaks similar to figure 6(a). The twin peaks at
 $z=25\ \textrm {mm}$ are due to the nature of the air-blast nozzle. Air-blast spray transport is dominated by a surrounding annular gas jet. Droplets embedded in this gas jet attain equilibrium with the gas motion. In other words, the drop velocities are more deterministic in regions where the gas and droplet phases have reached equilibrium. Figures 6(c) and 6(d) are similar to figures 6(a) and 6(b), except that they are for the pressure swirl spray data. As can be seen, both drop size and velocity series are close to the statistically significant threshold. Therefore, the patterns in pressure swirl sprays are not as dominant as in the case of the air-blast spray.
It is somewhat expected that droplet velocity shows a correlated structure in a spray, since the continuous medium (air) provides the necessary channel for communication of properties. What is remarkable is that the droplet diameter (in figure 6a) shows a statistically significant correlation, with the value of the correlation becoming more significant as the radial location increases (near the edge). In other words, drops of a similar size appear to be aggregating near the edge of the air-blast spray far more than in the pressure swirl spray. This radially increasing diameter correlation deserves further investigation as an aspect of clustering, since it has practical implications for engine operation in terms of a spray's ability to ignite at cold start.
3.2. TSA and modelling
Conditional probability analysis reveals timewise correlations in spray, but the correlations are limited to one step separation – between the current drop and the preceding drop or vice versa. To analyse correlations spread across higher temporal lags in time, partial auto-correlation functions of the data are studied. We consider univariate models for modelling spray data. We develop ARMA models of appropriate order as guided by the correlation functions and residual analysis. Since droplet arrivals are unstructured in time, a droplet number (termed lag) is used as the independent variable.
As explained in appendix A, the  $k\textrm {th}$ PACF captures the direct correlation between the
 $i\textrm {th}$ and
 $(i+k)\textrm {th}$ measurement as against the auto-correlation function (ACF) coefficient, which measures the total (direct plus mediated) correlation (with the exception of the first PACF coefficient since the direct and total correlations are identical). This contrast is particularly important in several applications. In the present context, this characteristic of PACF is useful in developing autoregressive models since the order of an auto-regressive (AR) model determines the most lagged observation that directly affects the present observation.
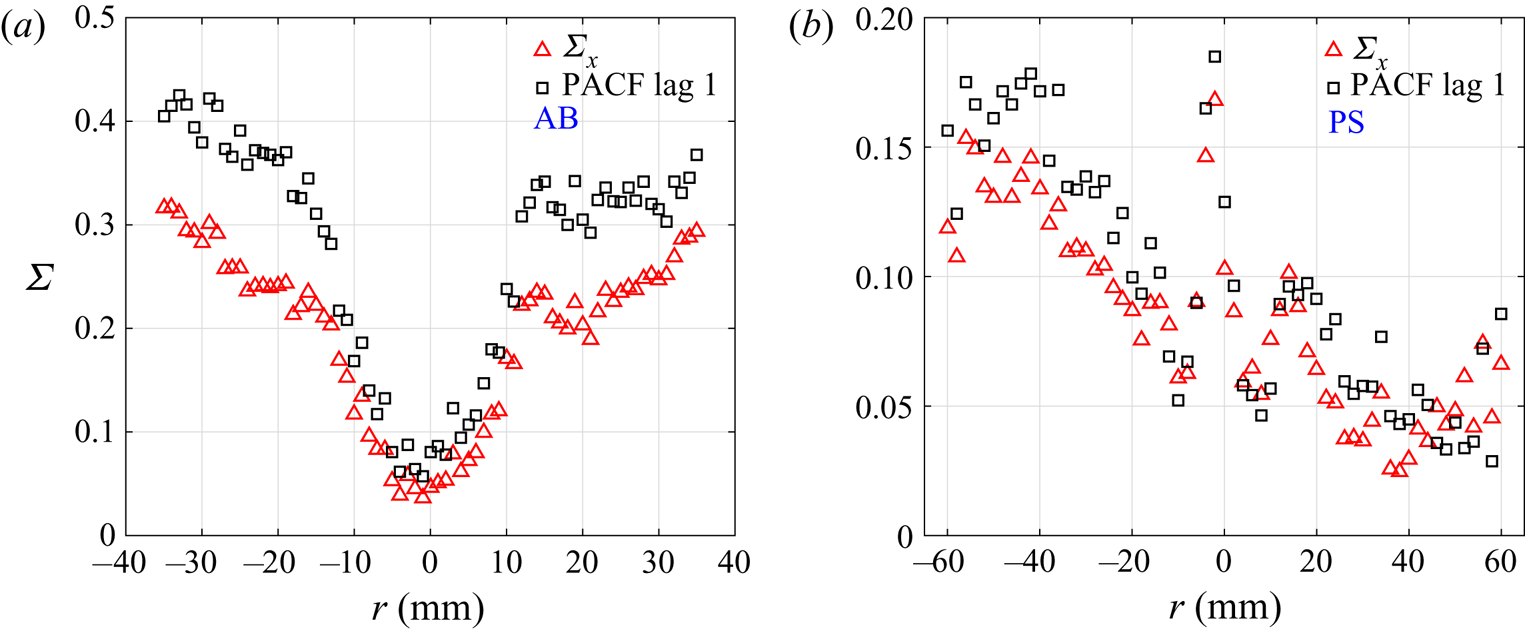
Figure 7 is a plot of the scalar measure  $\varSigma$ and the first PACF coefficients for drop size data, as a function of radial location for the air-blast and pressure swirl sprays. There is a good agreement between the two quantities, indicating that the scalar measure captures the correlation between two neighbouring events in time. The values of both
 $\varSigma$ and the PACF are much lower for the pressure swirl data in comparison to the air-blast data. In addition,
 $\varSigma$ and the PACF values for the air-blast data exhibit a radial structure. Note that PACF at lag
 $l=1$ is the same as the coefficient of an AR(1) (first-order) model, while at any other lag
 $l$, it represents the last coefficient of an AR(
 $l$) model.
Comparison of conditional probability scalar measure ( $\varSigma$) and partial auto-correlation coefficient (PACF, at lag
 $l=1$) for diameter data from (a) air-blast sprays at
 $z=25\ \textrm {mm}$ and (b) pressure swirl sprays at
 $z=33\ \textrm {mm}$. The correlation is much stronger in the case of air-blast sprays than in pressure swirl sprays.

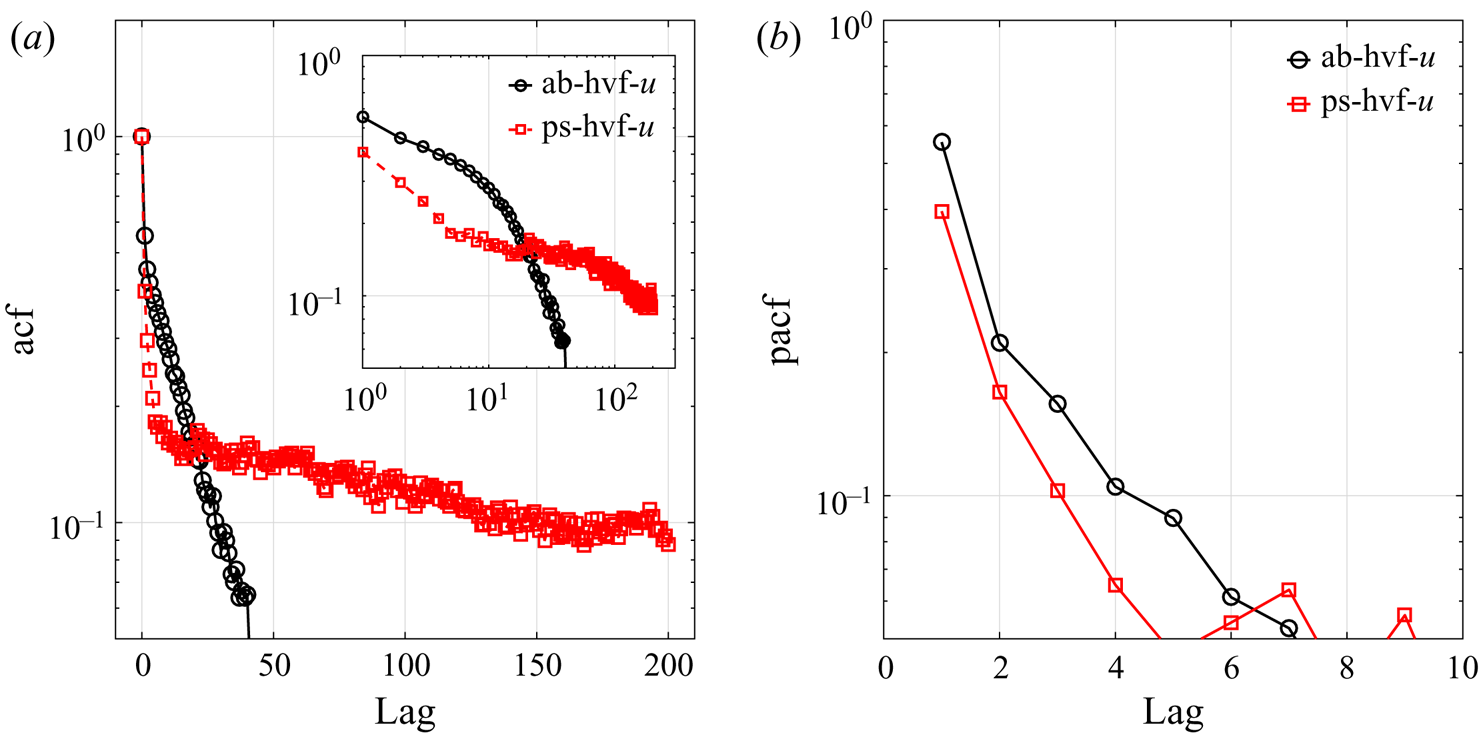
We are now interested in identifying differences in the structure of the time series between pressure swirl and air-blast atomizer data. Towards this end, we use the ACF and the PACF at various lags. Figure 8(a) is a plot of the ACF as a function of the lag distance for the velocity variable. This plot is obtained from single point data at the highest volume flux locations in both pressure swirl as well as air-blast cases. As can be seen from this plot, the auto-correlation characteristics in an air-blast spray decay exponentially and the correlation remains significant till almost  $30$ lag locations. In other words, a sequence of
 $30$ drops show correlated motion with a random forcing (analogous to Brownian motion). On the other hand, the correlation in the data for a pressure swirl spray shows two distinct phases. There is a distinct short range power law decay (see inset in figure 8) which persists until approximately
 $4$ or
 $5$ drops followed by a sharp change in behaviour to an exponentially decaying correlation. This phase persists till almost
 $200$ drops, which is remarkable. In other words, the short range behaviour appears to show signs of a scale-free Lèvy walk, while the long range correlation shows the signature of Brownian motion (Zaburdaev, Denisov & Klafter Reference Zaburdaev, Denisov and Klafter2015). The PACF (see figure 8b) is short lived in both cases, indicating that a statistically significant and direct correlation exists between the velocity of the
 $i\textrm {th}$ drop and the
 $(i+4)\textrm {th}$ drops. This shows that the time correlation signatures of the two classes of sprays are fundamentally different. This approach can therefore potentially be used to both understand the physics as well as to identify differences between sprays.
Plot of (a) ACF and (b) PACF as a function of lag distance for drop velocity data in air-blast spray ( $z = 25\ \textrm {mm}, r = -9\ \textrm {mm}$) and pressure swirl spray (
 $z = 44\ \textrm {mm}, r = -12\ \textrm {mm}$). These plots are at the radial locations with the highest volume flux locations in each case. The inset in (a) shown in logarithmic coordinates demonstrates a short lag behaviour that is exponentially decaying and a long lag power law decay of the auto-correlation coefficient for air-blast sprays. For pressure swirl sprays (see (b)), autocorrelation between velocities of drops shows an initial power law decay for short lag and an exponential decay for long lags. The partial ACF is short lived in both cases, indicating that a statistically significant and direct correlation exists between the velocity the
 $i\textrm {th}$ drop and the
 $(i+4)\textrm {th}$ drop.

Figure 8(b) depicts a plot of the PACF in the two data sets as a function of lag. This analysis is performed at the same location in the sprays as in figure 8(a). The PACF shows a decaying trend for both the pressure swirl as well as air-blast sprays. The correlation also decays below significant levels after approximately the same number of lags. These data imply that approximately  $4$ to
 $6$ drops are independently correlated in their motion. In other words, the velocity of the
 $i\textrm {th}$ drop and the
 $(i+4)\textrm {th}$ drop are correlated independent of the ‘pass through’ correlation through the intermediate drops. This is an important finding of this work and can be used to identify length and time scales within which coherent motion can occur. From the mean inter-particle time as well as the mean speed of the drops, one can estimate the mean distance and time over which independent correlation persists at this location.
It is to be noted that although the partial auto-correlation characteristics of the two sprays are similar, the auto-correlation characteristics in figure 8(a) are markedly different, pointing to fundamentally different physical transport processes in the two cases. In the case of the pressure swirl spray, the background air motion is initiated due to the entrainment initiated by drop motion. Therefore, one could construe the motion of the drops in this case (at least far away from the injector) as nearly being in equilibrium with the background air flow. Hence, the auto-correlation is persistent over several hundred successive drops. On the other hand, the air motion in the case of an air-blast spray is initiated by the nozzle. Droplet transport is largely enforced by the air motion (even far away from the injector). The finite length scale associated with coherent structures in the air flow, therefore, defines the spatial extent within which the velocity field in the gas phase would exhibit correlated motion, which goes to zero after a finite number of lags. This difference in the nature of the momentum exchange between the air and the droplets is exemplified as differences in the time correlation structure.
As seen in figure 8, the air-blast atomizer sprays show a sharp cutoff of ACF after a finite number of lags. For example, the ACF goes to zero after approximately 50 lags in figure 8(a) for the air-blast spray data. This implies that drops separated by approximately 50 are essentially uncorrelated in velocity. As we remarked earlier in the context of figure 1, it is incorrect to represent data as a p.d.f. if the data are correlated. From the ACF of the data, it is possible to identify the number of drops that are correlated. Figure 9 is a replot of the same data as in figure 1, except that the data are sampled after skipping as many drops as are correlated. This ensures that all such downsampled data are uncorrelated. The p.d.f.s presented in figure 9 are mostly similar to those in figure 1, except for a few subtle but important differences. The main differences are visible in figure 9(b) where the peak in the p.d.f. corresponding to  $r=5\ \textrm {mm}$ is shifted slightly to the right in comparison with the corresponding figure 1(b). Similarly, the peak corresponding to the p.d.f. for
 $r=-25\ \textrm {mm}$ is lower than in figure 1(b). We would like to point out that this gives a more accurate estimation of the true p.d.f. of fluid mechanic data than taking the raw signal and extracting a p.d.f. from it. In other words, it is important to only retain those samples in the p.d.f. that are uncorrelated, in order for the density plot to be interpretable.
Droplet properties of an air-blast spray for  $z = 25\ \textrm {mm}$ at the edge
 $(r = -25\ \textrm {mm})$ and centre of the spray
 $(r = 5\ \textrm {mm})$ for (a) diameter and (b) velocity after a suitable downsampling of raw data. This method used to construct the p.d.f. is technically superior to that used in constructing the p.d.f. in figure 1.

3.3. GARCH modelling
Linear time-series models, as explained earlier, model the conditional mean, but are not equipped to handle dependency of the prediction error variance on the past data or on time. In essence, they cannot model CH (refer to the earlier discussion in § 3.2 on CH), which can also be viewed as a particular manifestation of nonlinearity in the series. It must be remarked that a generic nonlinear time-series modelling of the data is outside the scope of this work. On the other hand, the variables have been transformed algebraically to be normally distributed so that the linear models provide optimal predictions of the conditional averages. However, we take this opportunity to highlight the presence of CH in spray data, a feature that is usually characteristic of econometric and hydrological data.
A standard test for the presence of CH in data is to test for the presence of serial correlation in squared residuals. For this purpose, we perform the well-known Ljung–Box test (for testing whiteness or significance of auto-correlation, see appendix A.1) on the squared residuals. The  $P$-value from the resulting test is found to be
 $2.2 \times 10^{-16}$ with
 $L = 20$, the maximal lag considered for the test (see appendix A.1 for more details), thereby confirming the significance of auto-correlation, or alternatively rejecting the whiteness of squared residuals at a significance level of
 $\alpha = 0.05$. In contrast, the
 $P$-value from the Ljung–Box test for auto-correlation in the residuals is 0.9903, thereby not rejecting the test of whiteness among the residuals of ARMA model. The CH thus determined in the diameter series was modelled using a
 $\textrm {GARCH}(0,4)$ model through a standard systematic procedure. The final optimal model for the droplet diameter time series at the
 $z=25\ \textrm {mm}$,
 $r=30\ \textrm {mm}$ location is thus
 $\textrm {ARMA}(5,5)$ superposed with a
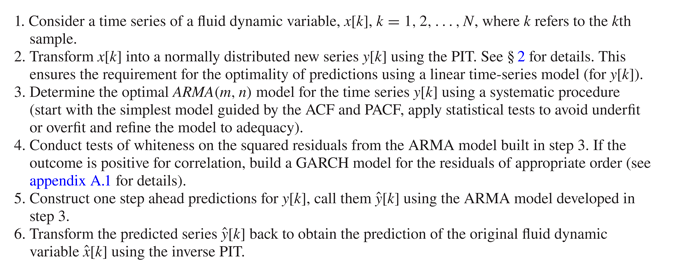
 $\textrm {GARCH}(0,4)$. Therefore, we can derive an optimal time-series model to capture the correlation structure in any fluid dynamic variable. For brevity, we present a stepwise procedure in table 2 to derive such a model for any fluid dynamic variable.
Stepwise procedure for time-series modelling and series reconstruction.

4. Utilitarian view of the results
The time-series model developed in §§ 3.2 and 3.3 captures not only the probability distribution of the variable, but also the inherent temporal structure of the time series. To demonstrate the utility of such a time-series modelling approach to computational fluid dynamics (CFD) practitioners, we apply the procedure given in table 2 to test data collected from an air-blast spray at axial location  $z = -25$ mm (AL3) and radial location
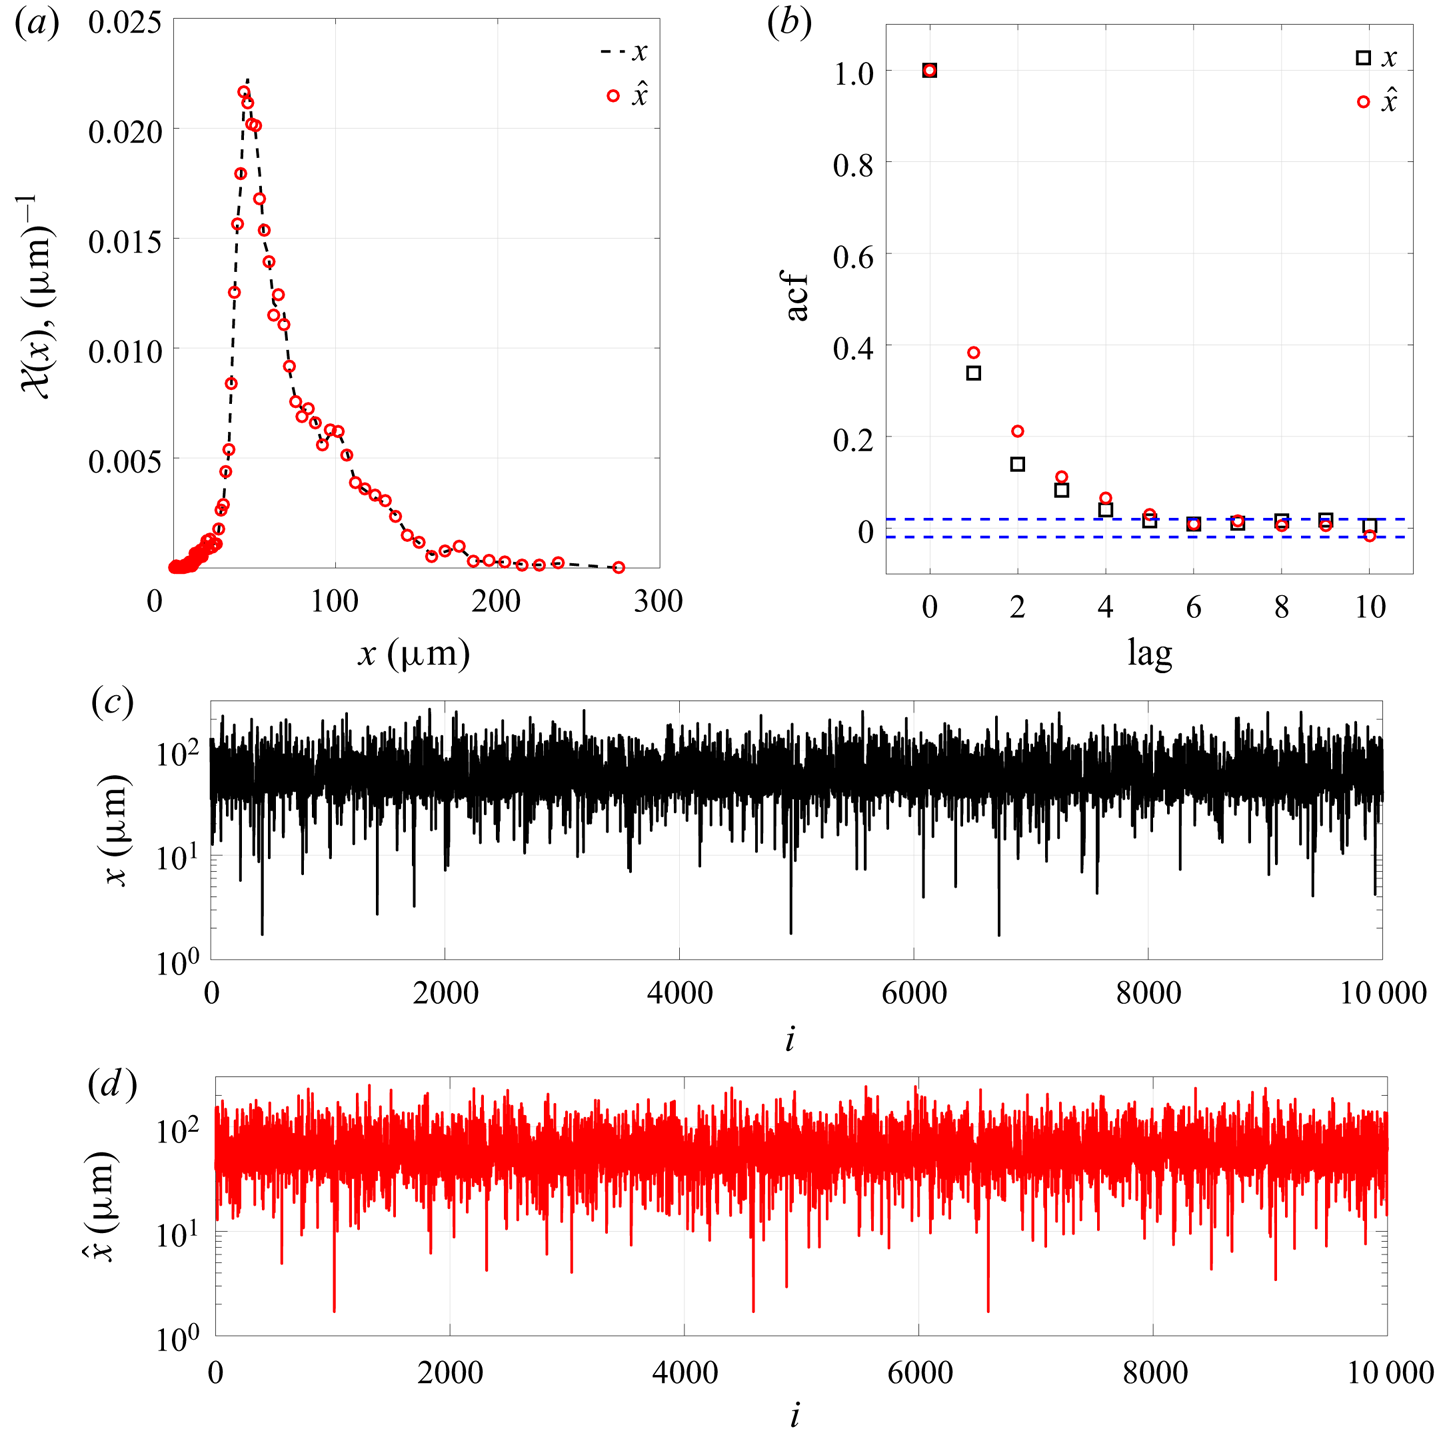
 $r = -25$ mm. Figure 10(a) is a plot of the density of the observed data and the reconstructed series. As can be seen, the density plot of the reconstructed series matches that of the original series despite its non-Gaussianity and the fact that the time-series model was developed on the transformed series. Not only can one observe the qualitative similarity between the time series, but also the close agreement with the probabilities of extreme events. This plot, however, as pointed out earlier, is not sufficient to establish the goodness of the developed model since it ignores the correlation structure. For this reason, we compare the ACFs of the observed and reconstructed series. Figure 10(b) compares the ACFs, clearly suggesting a close agreement between the two. Once again, given that the time-series model was developed on the transformed series, it is remarkable that the auto-correlations in the original series have also been captured very well by the model. Finally, a comparison of the time series is presented in figures 10(c) and 10(d), which show a satisfactory qualitative agreement with each other. Collectively, through these plots, we have shown that it is possible to simulate a sequence of droplets and their properties such that the densities and temporal correlation characteristics of the time series are well captured.
Plot showing comparison of (a) probability density distributions and (b) ACFs of original data and reconstructed time series (using the procedure in table 2). The time series of droplet diameter of (c) original data and (d) reconstructed time series. The time-series model is able to capture the probability density as well as the ACF accurately. The original data correspond to the diameter of the air-blast spray for  $z =25$ and
 $r = -25\ \textrm {mm}$.

Apart from the insights gained from such an analysis, we wish to describe a utility of this capability for CFD practitioners. Klein, Sadiki & Janicka (Reference Klein, Sadiki and Janicka2003) have pointed out the need for boundary conditions in CFD simulations to capture the temporal microstructure as well as the p.d.f. of the fluid mechanic variable. In keeping with their suggestion, let us consider the current practice in Lagrangian particle tracking simulations of sprays, which is to inject particles into the domain from a point of injection. One would require an empirical p.d.f. of the size and velocity for such an injection to be initiated. The particles are injected into the domain after randomly choosing a size and velocity from the empirical p.d.f., an approach that does not pay heed to the temporal microstructure of the spray, such as the one we have demonstrated in air-blast sprays. In contrast, a time-series model could create a synthetic sequence of droplets closely mimicking the experimental data in both the p.d.f. and the temporal microstructure. More generally, CFD simulations of turbulent flows could also benefit from implementing time-varying boundary conditions from empirically derived time-series models, since the temporal coherence information would be accurately captured in such an approach.
We have also shown that sprays originating from different atomizer classes exhibit a different spatio-temporal microstructure. In particular, we have shown that size clustering near the edge of the spray is relevant in some cases, but not in others. A spray that exhibits a higher probability of size-segregated clusters is likely to perform better on ignition tests. Therefore, one could rely on this analysis to understand the relation between cold spray measurements and ignition characteristics. Finally, Widmann & Presser (Reference Widmann and Presser2002) have presented a comprehensive database of measurements of cold and combustion sprays. As is well known, combustion is very likely to disrupt the spatio-temporal microstructure in the spray. It would be good to apply this analysis to datasets such as the one cited above to understand the correlation between cold spray characteristics to that in the combustion condition. This is a topic of future study.
5. Conclusion
The primary aim of this work was to adopt a data science, especially a TSA-based approach to understand the dynamical and spatio-temporal characteristics of sprays. To this end, we employed TSA techniques and models with the objective of obtaining insights that complement existing physics-based understanding of sprays. A scalar distance measure was developed to ascertain the presence of correlation in the spray drop size and velocity data. The variation of this distance measure with the radial location revealed that air-blast sprays showed more ordering towards the edges of the spray. In continuation, we showed that all sprays are inherently non-stationary albeit to differing degrees, primarily due to heteroskedasticity and due to the presence of a trend in the drop size and velocity time series. In addition, we showed that the droplet arrival time statistics are non-Poisson. While most of the inter-particle time distributions showed an expected exponential decay, an anomalous peak was observed for small drop spacing, indicating droplet clustering. The core part of this study involved temporal correlation analysis of diameter and velocity series at different radial locations. The analysis not only indicated predictability in the series but interestingly reflected the differences in the underlying physical transport processes. A first fallout of these correlations is that the standard method of estimating the p.d.f. does not yield a correct estimate. To remedy this issue, we proposed a technically correct way of estimating the density of droplet sizes. This method relies on a combination of suitable downsampling of the time-series data (to eliminate temporal correlation) along with time translation, followed by an averaging of the p.d.f. estimates obtained from each such downsampled record. ARMA models were developed for both air-blast and pressure swirl data series to capture the predictable portions of the series. These models further paved the way for examining the stochasticity of the self-driving random forces, essentially for the presence of CH. The diameter series in particular, tested positive for the presence of heteroskedasticity while the streamwise velocity series showed the absence of it. GARCH models were developed for the diameter residual series to explain the observed heteroskedasticity. The auto-regressive integrated moving average (ARIMA)–GARCH or the plain ARIMA models, thus developed, are not only significant because of their novelty in the literature but also important because they serve to generate more physically consistent spray data. Such models are potentially useful in several other numerical studies of sprays that require appropriate implementation of initial and boundary conditions. Models developed in this work are univariate and linear in nature. Although being somewhat simplistic from a modelling viewpoint, the insights obtained from the analysis and models developed are quite valuable and demonstrate the merit of our approach. The present work also lays foundations for a more sophisticated multivariate and nonlinear analysis of spray data, which is a subject of future study.
Declaration of interests
The authors report no conflict of interest.
Appendix A
Two classes of techniques are used for analysis of PDPA data – (a) techniques to study the aspects of the process and (b) techniques to understand the correlations present in the time series. For completeness of presentation, some definitions of the terms used in this paper are presented herein.
A.1. Some definitions
Conditional probability: conditional probability is used to determine the probability of an event, given the occurrence of another event. Mathematically,  $P(A|B)$ is the probability of event
 $A$ occurring, given event
 $B$ occurs, where
 $P(A)$ and
 $P(B) \neq 0$ are probabilities of events
 $A$ and
 $B$ occurring irrespective of each other. In the experimental measurements, this analysis is used to identify events where drops of similar size or similar velocity follow each other.
Poisson process: in sprays, droplet arrival times are expected to follow a Poisson process (Edwards & Marx Reference Edwards and Marx1995a). If the number of droplets arriving at a given location per unit time follows a Poisson distribution, it indicates that the droplet arrivals are independent events, i.e. each arriving drop does not have any knowledge of another drop that has arrived before it. If arrivals follow a Poisson process, inter-particle time, which is the time interval between consecutive arrivals, follows an exponential distribution. Analysis of arrival times in the measurements is done to test if droplet arrivals follow a Poisson process.
Stationarity: stationarity in time series can be of two types namely, strict and weak stationarity. Strict stationarity implies that all statistical properties of the series should be invariant to shifts in time. In terms of joint probability density it can be written as,
 \begin{equation} f(v[1],v[2],\ldots,v[N]) = f(v[1+T],v[2+T],\ldots,v[N+T])\ \forall T,N \in \mathbb{N}. \end{equation}
However, rarely do we find a process that meets this stringent requirement. Real sprays are no exception in this regard. For linear processes only the first two moments (of the joint p.d.f. of a pair of observations) are of interest. Since we develop linear time-series models for analysing sprays, it is sufficient to concentrate on the first two moments. Requiring that these first two moments remain invariant with time is termed as weak stationarity (it is essentially a highly relaxed version of strict stationarity). Formally, a series is called weakly stationary if
(i)
 $E(v[k]) = \mu _{k} = \mu \ \forall k \in \mathbb {N}$ (time invariance of mean)
(ii)
$\sigma _{k}^{2} = Var(v[k]) = \sigma ^{2} < \infty \ \forall k \in \mathbb {N}$ (boundedness and time invariance of variance).(iii)
$\textrm {covariance}(v[k],v[k+l]) = E((v[k]-\mu )(v[k+l]-\mu )) = \sigma _{vv}[l] \ \forall k \in \mathbb {N}$ (time invariance and lag-only dependence of covariance between a pair of observations.


Serial correlation measures: serial correlations of droplet velocity and diameter are measured to build a mathematical description for the droplet generation process. The correlation measures used are described in the rest of this section. Given a series of observations for a random process,  $\{v[1], v[2],\ldots ,v[k]\}$, a causal mathematical description of the process is built to predict future observations (Tangirala Reference Tangirala2014). Correlation is a natural measure of predictability of the series, and if a correlation can be found between the current observation
 $v[k]$ and any past observation
 $v[k-l]$ for some
 $l>0$, it can be used to predict a future observation
 $v[k+l]$. Auto-covariance and auto-correlation are two measures used for this purpose.
Auto-covariance: the auto-covariance function (ACVF) is the covariance between two observations of a series  $v[k_1]$ and
 $v[k_2]$,
 \begin{equation} \sigma_{vv}[k_1, k_2] = E([v[k_1] - \mu_{k_1}][v[k_2] - \mu_{k_2}]), \end{equation}
where  $\mu _{k_i}$ is the mean of the process at
 $k_i$ instant and
 $E$ is the expectation of the process. For a stationary process, the mean remains invariant and the ACVF is only a function of the distance between the sampling instants
 $l = k_1 - k_2$, therefore simplifying to
 \begin{equation} \sigma_{vv}[l] = E([v[k] - \mu_v][v[k - l] - \mu_v]) \end{equation}
where  $\mu _v = E[v_k]$ is the mean of the stationary process. ACVF measures the linear dependence between
 $v[k]$ and
 $v[k-l]$. It is a symmetric measure and depends on the units of
 $v[k]$.
ACF: the ACF is a normalized measure of auto-covariance, defined as
 \begin{equation} \rho_{xx}[l] = \frac{\sigma_{vv}[l]}{\sigma_{vv}[0]}. \end{equation}
The maximum value of ACF is unity, attained at lag  $l=0$. It is a bounded (above by unity in magnitude) symmetric measure which is invariant to the choice of units for
 $v[k]$. By definition, the ACF measures the direct and indirect (mediated) association between
 $v[k]$ and
 $v[k-l]$.
PACF: the PACF, introduced to measure only ‘direct’ (no mediation effects), at any lag  $l$ is defined as
 \begin{equation} \phi_{vv}[l] = \left\{ \begin{array}{@{}ll} \text{corr}(v[k],v[k-l]|z) & {|l| > 1},\\ \rho_{vv}[l] & {|l|=1},\end{array} \right. \end{equation}
where  $z$ is the set of confounding variables
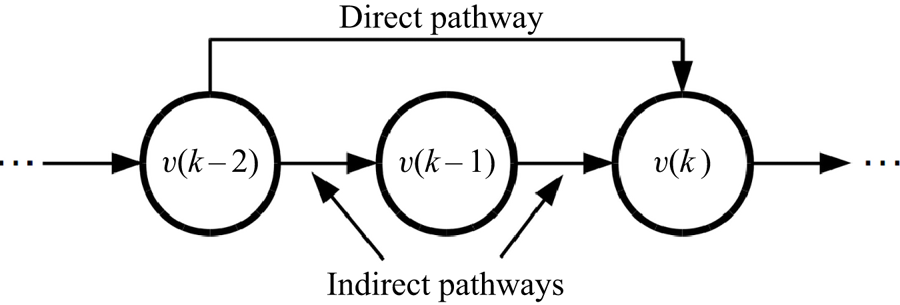
 $z = \{ v[k-l+1],\ldots ,v[k-2], v[k-1] \}$. Please refer to Tangirala (Reference Tangirala2014) and Shumway & Stoffer (Reference Shumway and Stoffer2017) for a detailed discussion. The main difference between the two statistics is that the ACF measures the overall correlation (direct and indirect) between two observations at lag
 $l$ while the PACF measures the direct correlation between the variables, as shown in figure 11.
Direct and indirect pathways for calculating auto-correlation and partial auto-correlation functions for an AR process of order 2;  $v[1], v[2],\ldots ,v[k-2], v[k-1], v[k]$ are consecutive observations in the series.

Estimation: the foregoing definitions are provided for the ensemble. However, in the real world, experiments yield a single realization (sample) with finite number of observations (measurements). Hence, the statistical properties calculated from a finite-sized realization are only estimates of the true values. These estimates are then used for testing a hypothesis on statistical properties of signals (or their derivatives, such as residuals). Estimates of statistical properties relevant to this work are obtained as follows. Given a finite series with  $N$ observations,
 $\{v[1],v[2],\ldots ,v[N]\}$, the mean of the series is estimated (A6) and the maximum likelihood estimate of the variance is defined by (A7) the, based on these estimates, the estimates for ACF is given by (A8) and (A9)
 \begin{gather} \hat{\mu} = \dfrac{1}{N}\sum_{i=1}^{N} v[i] \end{gather}
 \begin{gather}\hat{\sigma}_N^{2} = \dfrac{1}{N}\sum_{i=1}^{N} (v[i] - \hat{\mu})^{2} \end{gather}
 \begin{gather}\hat{\rho}_{vv}[l] = \frac{\hat{\sigma}_{vv}[l]}{\hat{\sigma}_{vv}[0]} \end{gather}
 \begin{gather}\hat{\sigma}_{vv}[l] = \frac{1}{N} \sum_{i=l}^{N-1} (v[i] - \hat{\mu})(v[i-l] - \hat{\mu}); \quad l > 0 . \end{gather}
PACF estimates are obtained using a well-established fact that the PACF at lag  $l$ is the coefficient of the last term of an AR model of order
 $l$. For computational efficiency, a recursive Durbin–Levinson algorithm is used (Tangirala Reference Tangirala2014; Shumway & Stoffer Reference Shumway and Stoffer2017). Finally, estimates of (AR, moving average (MA), ARMA and GARCH) model parameters are obtained using either a maximum likelihood estimation (MLE) or least-squares (LS) methods, as the case may be. The reader is referred to Shumway & Stoffer (Reference Shumway and Stoffer2017), Tangirala (Reference Tangirala2014) and Brockwell & Davis (Reference Brockwell and Davis2002) for full technical details.
Statistical tests: the estimates obtained, as above, are critical to the conduct of several hypothesis tests on statistical properties and/or assumptions. The tests relevant to the present work are that of whiteness (zero serial correlation), integrating effects (random walk behaviour) and unconditional and conditional heteroskedasticity. These tests are summarized in table 3.
Statistical tests for non-stationarity.

The Box–Ljung test (Brockwell & Davis Reference Brockwell and Davis2002) of whiteness for a given process or series  $y[k]$ uses the test statistic
 \begin{equation} Q = N(N+2)\sum_{l=1}^{L}\dfrac{\hat{\rho}_{yy}^{2}[l]}{N-l}, \end{equation}
where  $N$ is the sample size,
 $L$ is the lag up to which the auto-correlations are included (a user-defined parameter) and
 $\hat {\rho }_{yy}[l]$ is the ACF estimate at lag
 $l$. When the null hypothesis holds,
 $Q$ follows a
 $\chi ^{2}(L)$ distribution. Technical details pertaining to the ADF, KPSS and PSR tests are available in Shumway & Stoffer (Reference Shumway and Stoffer2017), Kwiatkowski (Reference Kwiatkowski, Phillips and Shin1992) and Priestley & Rao (Reference Priestley and Rao1969), respectively.
Tests on the significance of model parameter estimates are conducted by constructing the appropriate confidence intervals for the respective parameters using the asymptotic results for the MLE and LS methods (Tangirala Reference Tangirala2014; Shumway & Stoffer Reference Shumway and Stoffer2017).
Significance level: all hypothesis tests and confidence intervals in this work use a significance level of  $\alpha = 0.05$ (the probability of false positives).
Linear time-series modelling: the PACF and ACF signature (i.e. variation of PACF with different lag) plays an important role in identifying the underlying process that drives time series. Once the presence of correlation between events at times  $t_1$ and
 $t_2 ({>}t_1)$ is identified, linear models for the outcome at
 $t_2$ based on the outcome at
 $t_1$ can be constructed. Linear models for time series are primarily of three types (i) AR models, (ii) MA models and (iii) ARMA models. All three models for a given process
 $v[k]$ involve the unpredictable uncertain component of
 $v[k]$, called the white noise term (
 $e[k]$). The term ‘linear’ stems from the fact that all three models can be represented by a single model that expresses
 $v[k]$ as a linear weighted combination of past, present and future uncertain component
 $e[k]$.
AR models: the AR specifies that the output variable depends linearly on its own previous values and a stochastic term. An AR model of order  $p$ is essentially a linear regression of the observation
 $v[k]$ on
 $p$ past observations and the indispensable error term
 $e[k]$
 \begin{equation} v[k] = \sum_{i=1}^{p} ({-}d_i) v[k-i] + e[k], \end{equation}
where  $e[k]$ is white noise, usually assumed to be from a Gaussian distribution.
AR processes are detected by their ACF and PACF signatures. A stationary  $AR(p)$ process always possesses an exponentially decaying ACF (irrespective of the order), whereas it is characterized by a PACF that abruptly goes to zero (theoretically) after
 $p$ lags.
The ACF and PACF estimates (obtained from 1000 observations) of a synthetic  $AR(2)$-order process are shown in figure 12. The 95 % significance band is also shown for each of these estimates. Based on the figures, one can infer that ACF estimates decay exponentially with lag, while the PACF is statistically insignificant after lag
 $l =2$, which is the order of a generating AR process. Hence, the PACF signature plays an important role in identifying the order of underlying AR process.
Plots of (a) ACF and (b) PACF estimates (with 95 % significance bands) from 1000 observations of a synthetic second-order AR process.

Moving average model: the moving average model is a linear regression of the current value of the series on the current and previous white noise terms. A moving average model of order  $q$ can be formulated as
 \begin{equation} v[k] = \sum_{i=1}^{q} h_i e[k-i] + e[k]. \end{equation}
The  $MA(q)$ process is easily recognized by its ACF signature. The theoretical ACF of an
 $MA(q)$ process abruptly goes to zero after q lags whereas the PACF decays to zero, but not necessarily monotonically. Thus, the ACF provides a good initial estimate of the order for a MA process.
ARMA model: the ARMA model is basically a combination of both, an AR part and a MA part. The model is generally described as an ARMA(p, q) model where  $p$ is the order of the autoregressive part and q is the order of the MA part. An
 $ARMA(p,q)$ model can be formulated as shown below
 \begin{equation} v[k] + \sum_{i=1}^{p} d_i v[k-i] = \sum_{i=1}^{q} h_i e[k-i] + e[k]. \end{equation}
There is no set ACF or PACF signature for ARMA processes. Hence, an appropriate model for the underlying process driving the time series is chosen based on information criterion statistics such as the Akaike information criteria (Sakamoto & Kitagawa Reference Sakamoto and Kitagawa1987). These criteria are also applied to both AR and MA models along with the crucial residual analysis (whiteness test) for detecting model underfit. Overfitting is tested by examining the errors in model parameter estimates. Any parameter for which the  $100(1-\alpha )\%$ confidence interval includes a zero is deemed to be statistically insignificant at the significance level
 $\alpha$ and therefore omitted from the model.
GARCH: the GARCH model describes stochastic processes that exhibit the property of CH. This is a special characteristic of all processes that cannot be predicted with uniform precision, i.e. whose predictions have varying levels of uncertainties. Optimal ARMA models are not fully suited for such processes since they model only the conditional mean. The GARCH nature of a process is detected by examining the auto-correlations of squared prediction errors. If this auto-correlation is significant, the process is said to be conditionally heteroskedastic. The GARCH model is essentially an add-on to the linear model for the series, where an optimal ARMA model is first fit to the series and subsequently an ARMA model is fit to the changing variance using the past squared residuals and past variances as regressors. Let  $\varepsilon [k]$ be the residuals of the optimal model. A
 $GARCH(m,n)$ model for
 $\varepsilon [k]$ would be,
 \begin{gather} \varepsilon[k] = \sigma_kw[k], \end{gather}
 \begin{gather}\sigma^{2}_k = c_0 + \sum_i^{m} b_i\varepsilon^{2}[k-i] + \sum_{j=1}^{n} a_j\sigma^{2}_{k-j}, \end{gather}
where  $w[k]$ is an i.i.d.(0,1) process and is independent of
 $\varepsilon [k-l]$,
 $l \geqslant 1$,
 $\forall k$. The orders of a GARCH model are determined in a similar way as that of an ARMA model. Model adequacy is determined by residual analysis (whiteness test) and significance of parameter estimates.