Introduction
An increasing prevalence of obesity in both adults and children has been observed in many countries throughout the world (Wang et al., Reference Wang, Monteiro and Popkin2002; Silventoinen et al., Reference Silventoinen, Sans, Tolonen, Monterde, Kuulasmaa, Kesteloot and Tuomilehto2004). Changes in childhood lifestyle, characterized by a lack of physical activity and an increase in the consumption of energy-dense food, have led to a worldwide obesity epidemic that represents a significant challenge in public health (Weiss et al., Reference Weiss, Dziura, Burgert, Tamborlane, Taksali and Yeckel2004). It has been observed that 30% of obesity begins in childhood, and 50–80% of obese children become obese adults (Styne, Reference Styne2001). Undernutrition in early life can also lead to metabolic disorders in adulthood (Trowbridge et al., Reference Trowbridge, Marks, Romana, Madrid, Boutton and Klein1987; Miller et al., Reference Miller, Chen, Fok, Walker, Lim and Nicholls2009).
Morbidity from cardiovascular disease, diabetes, obesity-related cancers and arthritis has been found to be 50–100% higher in obese individuals who were also obese as children (Must et al., Reference Must, Jacques, Dallal, Bajema and Dietz1992). Also, epidemiological studies have shown a progressive increase in the incidence of hypertension, diabetes mellitus and coronary heart disease in obese persons (Kissebah et al., Reference Kissebah, Freedman and Peiris1989; Després et al., Reference Després, Lemieux and Prud’homme2001). Developing countries have been demonstrated to be harbouring the double burden of obesity and undernutrition, especially among the poor (Sawaya et al., Reference Sawaya, Sesso, DeMenezes, Florencio, Fernandes and Martins2005). Nutrition transition is a major driving force behind the double burden of malnutrition – a phenomenon that has become important in low- and middle-income countries, where high levels of obesity have been documented despite the persistence of undernutrition (Popkin, Reference Popkin2003; Food and Agriculture Organization of the United Nations, 2006). In Bangladesh too, possibly due to socioeconomic and demographic transition, undernutrition and obesity pose a major public health problem. However, there have been very few studies on undernutrition and obesity among school children aged 6–12 years in Bangladesh, so the current study focused on this group.
Methods
The cross-sectional study was conducted from June 2012 to May 2013 in different areas of Dhaka city, Bangladesh. Two public and six private schools were purposively selected, including three English medium schools. The sample size was calculated using the formula n=Z 2 pq/d 2, where n=sample size; Z=1.96; p=prevalence; q=1−p and d=allowable error of known prevalence. All children present in a class and who were willing to participate were included in the study sample. The total sample comprised 1768 children (980 boys; 788 girls). Informed consent was obtained from the school authorities, students and their parents.
The parents of each respondent completed a form asking for their age, sex, education, family expenditure, height and weight, occupation and family history of chronic diseases. After face-to-face interview by the data collector regarding age, eating habits and physical activities, each student’s height, weight, mid-upper-arm circumference (MUAC), and waist and hip circumferences were measured. Body mass index (BMI) was calculated as weight in kg/height in m2 and categorized according to international standard cut-offs: underweight (<15th percentile); overweight (85th to 95th percentile); obese (>95th percentile) (Kuczmarski et al., Reference Kuczmarski, Ogden, Grummer-Strawn, Flegal, Guo and Wei2000; Taylor et al., Reference Taylor, Viner, Booy, Head, Tate and Brentnall2005; Rahmani-Nia et al., Reference Rahmani-Nia, Rahnama and Bambaeichi2008). The CDC, WHO and IOTF references were also used to compare the BMI of the respondents.
Per capita family expenditure quartiles were used to indicate socioeconomic status (SES). The 1st quartile (expenditure <20,000BDT) was referred to as ‘low SES’, the 2nd and 3rd quartiles (expenditure 20,000–50,000BDT) as ‘medium SES’ and the 4th quartile (expenditure >50,000BDT) as ‘high SES’.
The results of the descriptive analysis were presented as frequencies and percentages. Student’s t-test was used for comparison of mean values of the groups and the χ 2 test for associations, with a p-value at <0.05 being considered significant. Multinomial logistic regression analysis was used to estimate the relationship between nutritional status, as measured by underweight, overweight or obesity, and family history of chronic disease.
Results
The average age of the respondents was 9.5 (±1.8) years; 24.7% were from public schools and 75.3% were from private schools. The majority (61.8%) were in the middle socioeconomic group. On considering a family history of disease, 34.9% children had a family history of hypertension, 42.0% of diabetes, 4.8% obesity, 14.4% heart disease, 6.4% stroke and 2.3% paralysis.
The majority of respondents (67.3%) ate junk food daily, but only 7.3% reported eating in a restaurant at least once a week. The majority of respondents (87.8%) reported watching TV for more than an hour a day, 22.5% reported playing video games daily, 35.9% said they read story books daily, and 27.5% were in the habit of sleeping during the day. As for physical activity, the majority (72.3%) said they played sport at school daily, but only a third (32.7%) reported playing outdoor games.
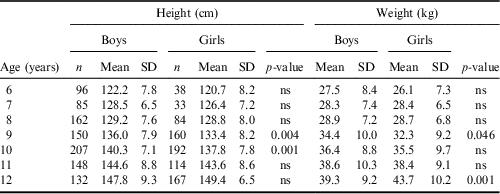
Average height, weight, BMI, MUAC, waist circumference and hip circumference values were found to be higher in boys than in girls, except at age 12, when most of these were significantly higher in girls than in boys (p<0.05; see Table 1).
Heights and weights of school children in Dhaka, Bangladesh, by sex and age, 2012–13

N=1768; p-values from sample t-test.
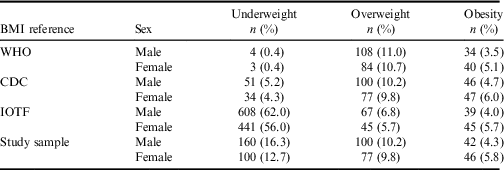
The overall prevalences of obesity, overweight and underweight were 5.0%, 10.1% and 14.7% respectively. The prevalence of overweight was 10.2% among boys and 9.8% among girls. That of obesity was 4.3% in boys and 5.8% in girls, and for underweight 16.3% in boys and 12.7% in girls. On using three different criteria for nutritional status classification (the United States Centers for Disease Control and prevention (USCDC), the Word Health Organization (WHO) and the International Obesity Task Force (IOTF) references), higher thinness grade I (males, 37.3%; females, 30.2%) and lower overweight (males, 6.8%; females, 5.6%) prevalences were seen with the IOTF cut-offs compared with the WHO, USCDC and study sample references (Table 2).
Nutritional status of respondents using different international BMI classification criteria

N=1768 (males: N=980; females, N=788).
WHO: underweight (<−2SD), overweight (> 1SD), obese (>+2SD).
CDC: underweight (<5th percentile), overweight (85th–95th percentile), obese (>95th percentile).
IOTF: thinness grade 1 (<18.5 kg/m2), overweight (23.0–25.0 kg/m2), obese (>25.0 kg/m2).
The prevalences of overweight and obesity were significantly higher in the middle and high SES groups (10.5% and 16.4%, respectively) compared with the low SES groups (4.9% and 9.9%), but the prevalences of overweight and obesity were lowest in the low SES group (3.8% and 1.3%, respectively; p<0.05) (see Table 3).
Nutritional status of respondents by family socioeconomic status (SES)

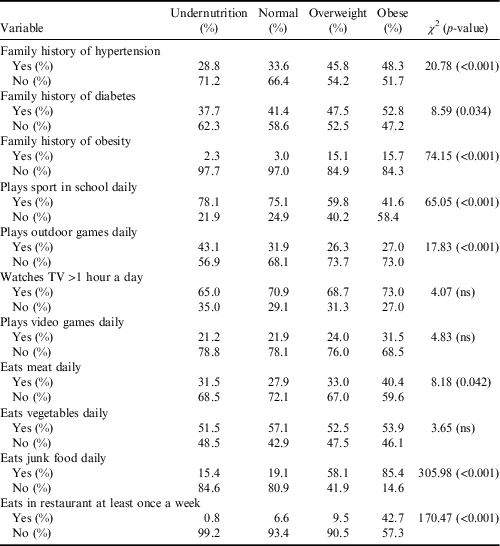
The obese group reported the lowest physical activity both in sports (41.6%) and outdoor games (27.0%), followed by the overweight group (sports, 59.8%; outdoor games, 26.3%), normal weight group (sports, 75.1%; outdoor games, 31.9%) and underweight group (sports, 78.1%; outdoor games, 43.1%). The majority of the obese (73%) and overweight (68.7%) students watched TV for more than an hour a day, compared with 65% of the underweight group, which reflected a sedentary lifestyle of the obese and overweight groups.
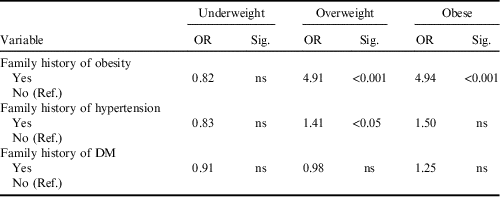
Having a family history of chronic diseases (hypertension, diabetes, obesity) was more likely in the obese and overweight groups than in the normal and underweight groups (Table 4). A family history of obesity was found to be a strong predictor of developing overweight (Odds Ratio (OR) 4.9) and obesity (OR 4.9) in the respondents. The probability of developing overweight was 40% higher among participants who had a family history of hypertension (Table 5).
Respondents’ nutritional status by family history of chronic disease, and respondents’ reported eating habits and activity levels

Multiple logistic regression analysis of respondents’ nutritional status by family history of chronic diseases

Ref., reference category; DM, diabetes mellitus.
Discussion
Malnutrition is a public health problem all over the world. There are widespread reports of an increasing trend in the prevalence of overweight and obesity among children and adolescents (Mo-suwan et al., Reference Mo-suwan, Junjana and Puetpaiboon1993). Morbidity from cardiovascular disease, diabetes, obesity-related cancers and arthritis is higher in obese individuals who were also obese as children (Must et al., Reference Must, Jacques, Dallal, Bajema and Dietz1992).
The present study of school children aged 6–12 years in Dhaka city found the prevalences of underweight, overweight and obesity to be 14.7%, 10.1% and 5.0%, respectively, using BMI cut-offs of <15th, >85th–95th and >95th percentiles. Sayeed et al. (Reference Sayeed, Rhaman, Banu and Mahtab2012), in a study of rural, suburban and urban Bangladeshi school children, and using BMI cut-offs of <18.5, 23.0–25.0 and >25.0 kg/m2, found a prevalence of undernutrition of 57.4% and a prevalence of adiposity (overweight+obesity) of 7.6%. If the present study had used the same cut-offs the result would have been 59.8% underweight and 11.3% adiposity, which are closer to their figures. A very similar study in South Korea (Kim et al., Reference Kim, Hwang, Woo, Kim, Jo and Jo2005) using the same BMI cut-offs as Sayeed et al. (Reference Sayeed, Rhaman, Banu and Mahtab2012) found prevalences of 12.1%, 12.5% and 9.8% for undernutrition, overnutrition and obesity, respectively. So, large proportions (59.8%) of Bangladeshi children are underweight compared with Korean children (Wickramasinghe et al., Reference Wickramasinghe, Lamabadusuriya, Atapattu, Sathyadas, Kuruparanantha and Karunarathne2004; Kim et al., Reference Kim, Hwang, Woo, Kim, Jo and Jo2005). Studies in Delhi (WHO, 2002) and in Pune (Khadikar & Khadikar, Reference Khadikar and Khadikar2004) documented the prevalence of obesity as 7.4% and 5.7%, respectively. These are similar to the findings of the current study, but the Pune study showed a higher prevalence of overweight (19.9%) than did the current study. Another study, conducted among school children in Punjab (Chhatwal et al., Reference Chhatwal, Verma and Riar2004), reported a similar overweight prevalence to the current study, but the obesity prevalence was found to be much higher (14.2%). This demonstrates the degree of heterogeneity in health and nutrition problems in developing countries. Wang and Lobstein (Reference Wang and Lobstein2006) also supported this study’s findings, reporting that a number of low- and middle-income countries have experienced the double burden of undernutrition and obesity.
There is still controversy over the use of a series of universal BMI cut-offs to define obesity or overweight in different population of adults and children (Deurenberg et al., Reference Deurenberg, Yap and van Staveren1998; Wang et al., Reference Wang, Monteiro and Popkin2002). In the present study underweight, overweight and obesity were calculated according to three international references, and the study showed that the prevalence of underweight, as well as overweight, was greater in male subjects compared with female subjects when using the IOTF compared with using the CDC and WHO references. However, the prevalence of obesity was higher in females using all three cut-off references.
The higher prevalence of overweight in boys than in girls was consistent with the findings of previous studies conducted by Anand et al. (1996) and Verma et al. (1994), as cited by Goyal et al. (Reference Goyal, Shah, Saboo, Phatak, Shah and Gohel2010), in northern Indian children and also in southern Indian children (Ramachandran et al., Reference Ramachandran, Snehalatha, Vinitha, Thayyil, Kumar and Sheeba2002). However, the higher obesity prevalence among girls demonstrated in this study differs from the findings of these other studies. This could be explained by the high physical activity level of the boys in the study population.
The three references used in this study showed marked differences between each other. The values found when using the IOTF and CDC cut-offs compared fairly well for overweight and obesity in both sexes. This was similar to the findings of Kain et al. (Reference Kain, Uauy, Vio and Albala2002), who reported that the use of CDC and IOTF cut-offs generated comparable prevalence estimates for overweight, but use of the IOTF reference value for obesity generated a lower prevalence estimate than did the CDC reference, which was not consistent with the current study. The prevalence of underweight was very low and that of overweight was found to be higher using the WHO category. One possible explanation for the lower values of underweight when using the WHO criteria is that the critical BMI values are higher than those of other criteria.
It has been reported previously that BMI is influenced by background SES (Lusky et al., Reference Lusky, Lubin, Barell, Kaplan, Layani, Lev and Wiener2000). The present study found a strong association between nutritional status and SES. Obesity and overweight were more prevalent in the middle and rich classes, and undernutrition was more prevalence in the poor class. Similar observations have been made by other researchers (Sayeed et al., Reference Sayeed, Rhaman, Banu and Mahtab2012; Bhuiyan et al., Reference Bhuiyan, Zaman and Ahmed2013). This might be due to the sedentary lifestyle and dietary habits of middle and high SES groups. In developed countries such as the UK, the association between social deprivation and childhood obesity has been found to be strong, especially in girls (Kinra et al., Reference Kinra, Nelder and Lewendon2000). In Bangladesh, social deprivation results in a lower BMI among children. These differences may be due to the fact that the criteria of social deprivation differ between developed and developing countries. Social deprivation results in the unavailability of sufficient food and thus causes nutritional deficiencies. The low economic group probably reflects a nutritional imbalance as a result of poverty (Qamra et al., Reference Qamra, Mehta and Deodhar1991).
Sedentary behaviour and physical activity in children may be predictive of body mass in late adolescence. Sleeping in the afternoon and a lack of sport and exercise have been implicated in childhood obesity because they reduce resting metabolism and result in a reduction in physical activity (Rosenbaum et al., Reference Rosenbaum, Leibel and Hirsch1997). This study found less involvement in sports and outdoor games, and a greater chance of watching TV for more than an hour a day and playing video games for a long time among obese and overweight children. The prevalences of overweight and obesity were higher among children who ate meat and junk food daily and visited restaurants frequently.
A family history of chronic diseases such as hypertension, diabetes and obesity was more frequent in the obese and overweight groups. The prevalence of obesity was higher among participants who had a family history of obesity than those who had a family history of diabetes and hypertension. These findings are similar to those of King et al. (Reference King, Fitch, Collins, Koki, King and Heywood1989), Sinha et al. (Reference Sinha, Fisch and Teague2002) and Goyal et al. (Reference Goyal, Shah, Saboo, Phatak, Shah and Gohel2010). However, the opposite scenario was found in these studies regarding a family history of diabetes.
The study had some limitations. It included more private than public schools, which might have overestimated overweight and obesity. Ages of the children were taken as stated by themselves. Age groups could have been more accurate if birth certificates had been checked. However, it had several strengths. It is the first study to address nutritional status using different international growth references (WHO, CDC and IOTF) among Bangladeshi school children. The data included family history of chronic diseases such as obesity, hypertension, diabetes, and also some information on participants’ dietary intake and physical activities, which gave additional information about factors contributing to obesity.
In conclusion, the prevalence of obesity and overweight is high in middle- and high-SES children in Bangladesh. This increase has been attributed to an increasingly sedentary lifestyle, along with reduced physical activity, as well as changing dietary habits. As a result, more children in Bangladesh are experiencing severe health risks, which are expected to lead to huge economic costs to health. Health education on dietary habits and the risks of a sedentary lifestyle should be provided to parents, teachers and children. Further study may be undertaken on a larger scale to establish diagnostic criteria for age-specific nutritional status and to investigate whether differences in nutritional status are due to differences in children’s economic and social factors, such as diet and physical activity.
Ethical Approval. As a part of the ethical clearance informed consent was obtained from the school authorities, students and the parents.
Conflicts of Interest. The authors have no conflicts of interest to declare.
Funding. The study was funded by Ibrahim Medical College research fund under BADAS (Bangladesh Diabetic Somity).