INTRODUCTION
Describing the trophic dynamics of marine communities can provide better understanding of the organization and functioning of assemblages (Paine, Reference Paine1966; Menge, Reference Menge1992; Hamilton et al., Reference Hamilton, Smith, Price and Sandin2014), enable prediction of responses to disturbance or disease (Witman, Reference Witman1985; Harley et al., Reference Harley, Hughes, Hultgren, Miner, Sorte, Thornber, Rodriguez, Tomanek and Williams2006; Rodríguez-Barreras et al., Reference Rodríguez-Barreras, Pérez, Mercado-Molina, Williams and Sabat2014), and ultimately enhance their long-term management and conservation (Graham et al., Reference Graham, Evans and Russ2003; Pauly & Watson, Reference Pauly and Watson2005; Mumby et al., Reference Mumby, Harborne, Williams, Kappel, Brumbaugh, Micheli, Holmes, Dahlgren, Paris and Blackwell2007). In tropical reef systems, trophic dynamics tend to be ‘top-down’ (Carpenter & Edmunds, Reference Carpenter and Edmunds2006; Hamilton et al., Reference Hamilton, Smith, Price and Sandin2014), where the trophic interactions of predatory fish and their herbivore prey have direct and significant impact on fluctuations between coral and algal abundance (Floeter et al., Reference Floeter, Behrens, Ferreira, Paddack and Horn2005 for review). Consequently the relationships between predators, herbivores and primary producers have drawn a great deal of attention in shallow reef community studies due to their integrated role in structuring nutrient flow throughout the reef system (e.g. Barneche et al., Reference Barneche, Kulbicki, Floeter, Friedlander, Maina and Allen2014; Vinueza et al., Reference Vinueza, Menge, Ruiz and Palacios2014).
In response to typically high densities of visual predators on tropical reefs (e.g. fish species), prey species have evolved predator avoidance strategies such as migration into cracks and crevasses or other habitats that offer refuge during the day, and emerging at night when there is a lower encounter rate with visual predators (Dill, Reference Dill1987; Barnes & Crook, Reference Barnes and Crook2001; Clark et al., Reference Clark, Ruiz and Hines2003). In these cases, prey species must trade-off between optimal foraging opportunities and prey avoidance, because often foraging in predation refugia is sub-optimal (Holomuzki & Messier, Reference Holomuzki and Messier1993; Barnes & Crook, Reference Barnes and Crook2001 for review). For example, such daily retreat to predation refugia has been well documented for echinoids in tropical and temperate reefs (Nelson & Vance, Reference Nelson and Vance1979; Barnes & Crook, Reference Barnes and Crook2001), avoiding fish predators (see Tuya et al., Reference Tuya, Martin and Luque2004 for review). Similarly, a lack of daily migration in echinoids has been observed elsewhere when there are low abundances of predatory fish (Glynn et al., Reference Glynn, Wellington and Birkeland1979). In these instances, echinoids are considered ‘keystone’ herbivores (e.g. D. antillarum in the tropical Atlantic: Hughes et al., Reference Hughes, Reed and Boyle1987; Carpenter & Edmunds, Reference Carpenter and Edmunds2006; Rodríguez-Barreras et al., Reference Rodríguez-Barreras, Pérez, Mercado-Molina, Williams and Sabat2014), where the reduced abundance of this species can result in dramatic increases in algal cover (Phinney et al., Reference Phinney, Muller-Karger, Dustan and Sobel2001). Therefore, when relating the importance of echinoids in reef trophic dynamics and their nocturnal feeding behaviour, it can be assumed that nocturnal grazing is when this species exerts maximum grazing pressure. However, herbivorous fish also play a major ‘top-down’ role in structuring tropical reef assemblages (Hughes et al., Reference Hughes, Reed and Boyle1987; Hamilton et al., Reference Hamilton, Smith, Price and Sandin2014 and references therein). Given that herbivorous fish are generally active in the day (Hay et al., Reference Hay, Paul, Lewis, Gustafson, Tucker and Trindell1988; Choat & Clements, Reference Choat and Clements1993) when historically most reef surveys have been carried out (although see Azzurro et al., Reference Azzurro, Pais, Consoli and Andaloro2007), then a key period of critical trophic activity has been unstudied in Ascension Island; both night and day surveys of the reef assemblage are necessary for fully understanding trophic dynamics in tropical reef systems.
The inshore benthic habitats in Ascension Island are characterized by bedrock, boulders, cobble, maerl and sand, and conspicuously low coral substrate. Non-geniculate coralline red algae formations widely dominate the rocky bottom, where fleshy seaweeds are relatively inconspicuous, reduced to thin epibenthic turf-like mats, including diminutive and repent forms of various green, brown and red macroalgae (such as Wrangelia argus and Dictyota sp.) (Tsiamis et al., Reference Tsiamis, Peters, Shewring, Asensi, Van West and Küpper2014). Visually dominating the daytime underwater seascape of Ascension Island is an abundant fish assemblage, with elements characteristic of both western and eastern Atlantic assemblages (Floeter et al., Reference Floeter, Rocha, Robertson, Joyeux, Smith-Vaniz, Wirtz, Edwards, Barreiros, Ferreira, Gasparini, Brito, Falcón, Bowen and Bernardi2008, reviewed in Wirtz et al., Reference Wirtz, Bingeman, Bingeman, Frickle, Hook and Young2014). Similar to other oceanic islands in the tropical Atlantic (Floeter et al., Reference Floeter, Rocha, Robertson, Joyeux, Smith-Vaniz, Wirtz, Edwards, Barreiros, Ferreira, Gasparini, Brito, Falcón, Bowen and Bernardi2008; Pinheiro et al., Reference Pinheiro, Ferreira, Joyeux, Santos and Horta2011), richness is relatively low compared with coastal tropical Atlantic regions, with intermediate levels of endemism (Floeter et al., Reference Floeter, Rocha, Robertson, Joyeux, Smith-Vaniz, Wirtz, Edwards, Barreiros, Ferreira, Gasparini, Brito, Falcón, Bowen and Bernardi2008). Characteristic of Ascension Island are the disproportionally dominant black triggerfish Melichthys niger in terms of both numbers and biomass (Price & John, Reference Price and John1980; Kavanagh & Olney, Reference Kavanagh and Olney2006). Melichthys niger is a voracious omnivore common throughout the tropical Atlantic. Analysis of stomach contents has revealed a wide spectrum of diet including benthic algae, invertebrates spanning most phyla, planktonic organisms and fish (Kavanagh & Olney, Reference Kavanagh and Olney2006) similar to other balistid fish (McClanahan, Reference McClanahan2000). As such they are likely to exert significant grazing pressure on algal turf as well as predation pressure on invertebrate fauna. In contrast, preliminary night surveys (personal observation) showed an underwater seascape visually dominated by benthic invertebrate fauna, with a distinct lack of active fish present. Conspicuous nocturnal invertebrates include Diadema antillarum and the holothurian Euapta lappa. Interestingly, in addition to invertebrates, also seen are numerous M. niger in a state of deep rest, lying motionless on the rocky seabed.
There is currently no published quantitative information on the nocturnal benthic assemblage of Ascension Island. We therefore ask the following questions: (1) what are the differences between the day and night fish and invertebrate assemblages in terms of composition and abundance and (2) how are these assemblages structured in terms of their functional groups? To elucidate these questions, we carried out a series of day vs night scuba surveys collecting visual census data for the first time, providing a quantitative baseline of species that may otherwise be missed during day surveys as well as allowing for the comparison of the difference in relative abundance and species composition of marine fauna present between day and night.
MATERIALS AND METHODS
A total of 12 transect surveys were conducted at Wigan Pier, Ascension Island (7.894°S 14.384°W) spanning 9 months. The site is a small embayment at the base of a cliff headland. The seabed consists of very large (>1 m diameter) irregularly shaped and highly rugose boulders on very rugged bedrock, with numerous large fissures and crevasses. The reef slopes down to a sand/cobble/boulder field at a depth of 15–20 m, over a horizontal distance of approximately 200 m. In each survey period (season), six transect surveys were carried out; three day transects and three night transects (4 September 2012; day: 1500 h; night: 2025 h and 4 June 2013; day: 1500 h; night: 2030 h). In 2012, the three transects were placed at mean depths of 5.5 m (D1/N1), 5.1 m (D2/N2) and 7.0 m (D3/N3). In 2013, transects were placed at mean depths of 7.0 m (D1/N1), 6.3 m (D2/N2) and 8.5 m (D3/N3).
Surveys were carried out using standard visual survey methods, counting all fish and invertebrates within a 2 m belt (1 m either side of the tape measure) along a 50 m transect (based on methods in http://www.reeflifesurvey.com; Edgar et al., Reference Edgar, Barrett and Stuart-Smith2009). Transects were anchored on the seabed at three depths during the day surveys, suitably separated such that fish counts did not overlap between transects. The same transects were surveyed at night. Transects were marked with a single Cyalume-like glow stick at each end so they could be relocated by divers. Although the glow stick created a light field at night, it was deemed not significant enough to bias night survey results beyond the first metre of the transect. For the night survey, the survey diver wore a head-mounted torch. In all six night surveys, the head torch did not attract any fish species during the survey. All surveys in both seasons were carried out by the same diver surveyor, who was highly experienced in fish surveys in Ascension Island. Start and end depth and habitat type were noted for each transect.
All individuals were identified to species or closest practical taxonomic unit. Juvenile and adult forms of fish were recorded separately. All night observations of M. niger were of fish lying dormant on the seabed, and thus their presence was counted but classified separately from M. niger counted during the day. Categorizing these separately takes into account the different functional roles of M. niger in the day or night while at the same time, records their presence in the assemblage. Fish species were assigned to functional group codes based on Halpern & Floeter (Reference Halpern and Floeter2008), or from FishBase (http://www.fishbase.org. Last accessed 23 October 2014) if not recorded in that study. Invertebrates were classified using the same terminology as fish, on the basis of a wide range of peer-reviewed sources. If specific species information could not be found, then functional grouping was assumed from the genus or family. Classifications are: Macrocarnivores (MCAR) – consume mobile benthic organisms and fish; Strict piscivores (PISC) – consume fish only; Mobile benthic invertivores/cleaners (MINV) – consume primarily benthic mobile and parasitic invertebrates; Coral/colonial sessile invertivores (SINV) – consume sessile benthic invertebrates; Planktivore (PLA) – consume primarily macro- and micro-zooplankton; Turf grazing (TURF) – herbivores feeding on algae and epiphytic organisms; Scrapers (SCRP) – herbivores that leave shallow bite scars; General omnivores (OMNI) – consume a variety of animal and plant material in similar quantities; Detritivore (DETR) – consume sediments and decomposing material. The category DETR was needed for some species of invertebrates. The category INRT was used to classify M. niger at night.
All statistics were done in Rv3.1.0 (R Core Team, 2014). Multivariate analysis was conducted using the package ‘vegan’ v2.0–10. Principal component analysis (PCA) was carried out on the species matrix of day and night transect observations after 4th root transformation, reducing the weight of large values while retaining relative abundance information (Legendre & Legendre, Reference Legendre and Legendre1998). Significance of site groupings was done using ANOSIM (analysis of similarity). SIMPER (similarity percentage) was used to determine the species having the highest 90% of influence on site groupings. Functional group diversity of day and night assemblages was examined in terms of richness (S), Shannon diversity (H′) and Pielou's evenness (J′) (Maurer & McGill, Reference Maurer, McGill, Magurran and McGill2011). Morisita–Horn index was used to examine the difference (dissimilarity) in species composition between day and night surveys, within each functional group (Maurer & McGill, Reference Maurer, McGill, Magurran and McGill2011). This is an abundance-based index of species overlap between two groups (day vs night).
RESULTS
Species composition and abundance
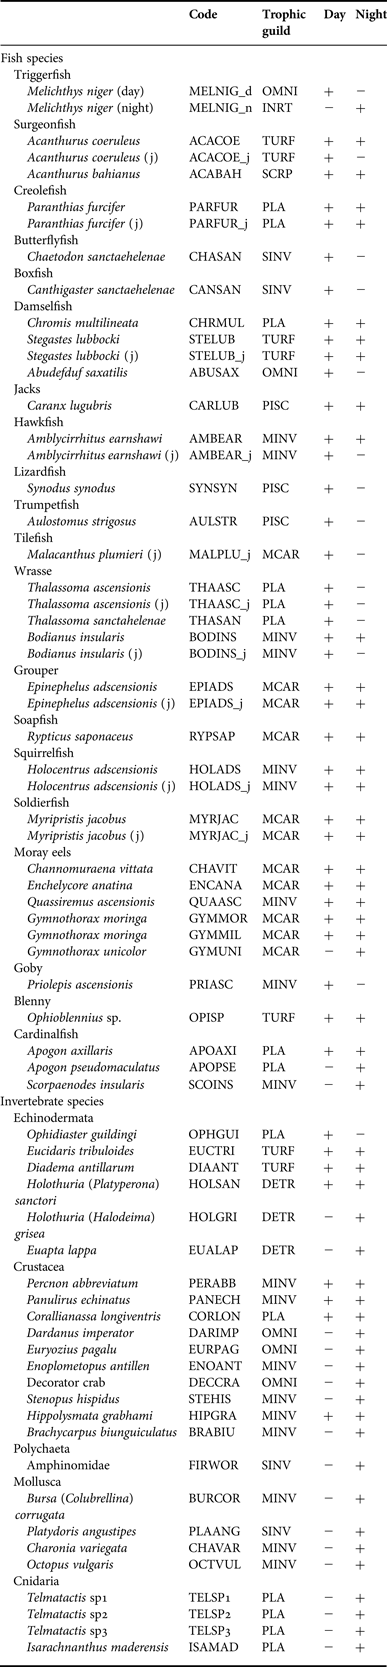
A total of 57 taxa were identified among a total of 6547 individuals counted, including 32 species of fish, 10 of which included juvenile forms, and 25 invertebrate species (Table 1). Of the fish species, 29 species were found during day transects with 13 found exclusively during the day. At night 23 species were found, with the brown moray eel (Gymnothorax unicolor), cardinal fish (Apogon pseudomaculatus) and scorpion fish (Scorpaenodes insularis) found exclusively at night. Of the invertebrates, eight species were found during the day transects, with the ophiuroid Ophidiaster guildingi found exclusively during the day. All other invertebrates were recorded at night, with 16 taxa occurring exclusively at night.
Species presence/absence in all surveys. Trophic guilds adapted from Halpern & Floeter (Reference Halpern and Floeter2008)

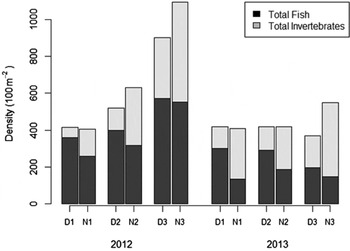
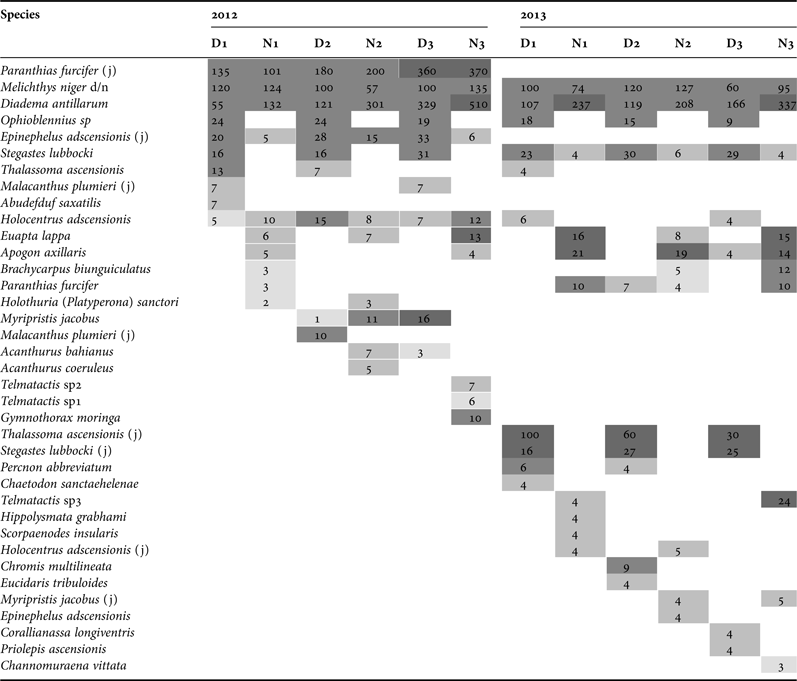
In all transect pairs, the density of all fish decreased between day and night surveys by an average of 27.9% (±15.6% SD) (Figure 1). Conversely, the density of invertebrates increased between day and night surveys by an average of 53.5% (±8.4% SD). In 2012, density of combined fish and invertebrates (using day and night transects as replicates) increased with depth (ANOVA, df = 2, F = 22.645, P = 0.0155). There was no similar increase or decrease detected in 2013. Rank abundance analysis of all species from all transects shows that M. niger and D. antillarum were ranked among the highest three species in all day and night transects in both seasons (Table 2). In addition to these two species, juvenile Paranthias furcifer ranked highly in 2012, but were not recorded in 2013. Ophioblennius sp. and juvenile Epinephelus adscensionis also ranked highly in day surveys. In 2013 top ranked species also included juvenile Thalassoma ascensionis and juvenile and adult Stegastes lubbocki in day surveys, and Apogon axillaris and Telmatactis sp3 in night surveys. In total, there were 37 out of the total of 57 species ranked in the top 10 most abundant species among all transects.
Density of total fish and invertebrates between paired transects (D1, D2, D3, N1, N2, N3) between seasons (September 2012 and June 2013).

Abundance (100 m−2) of the top 10 ranked species in all transects. Ranks are coded dark grey (highest rank) to light grey (lowest rank) for ease of interpretation.

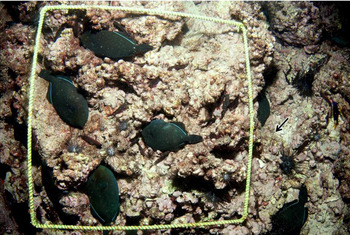
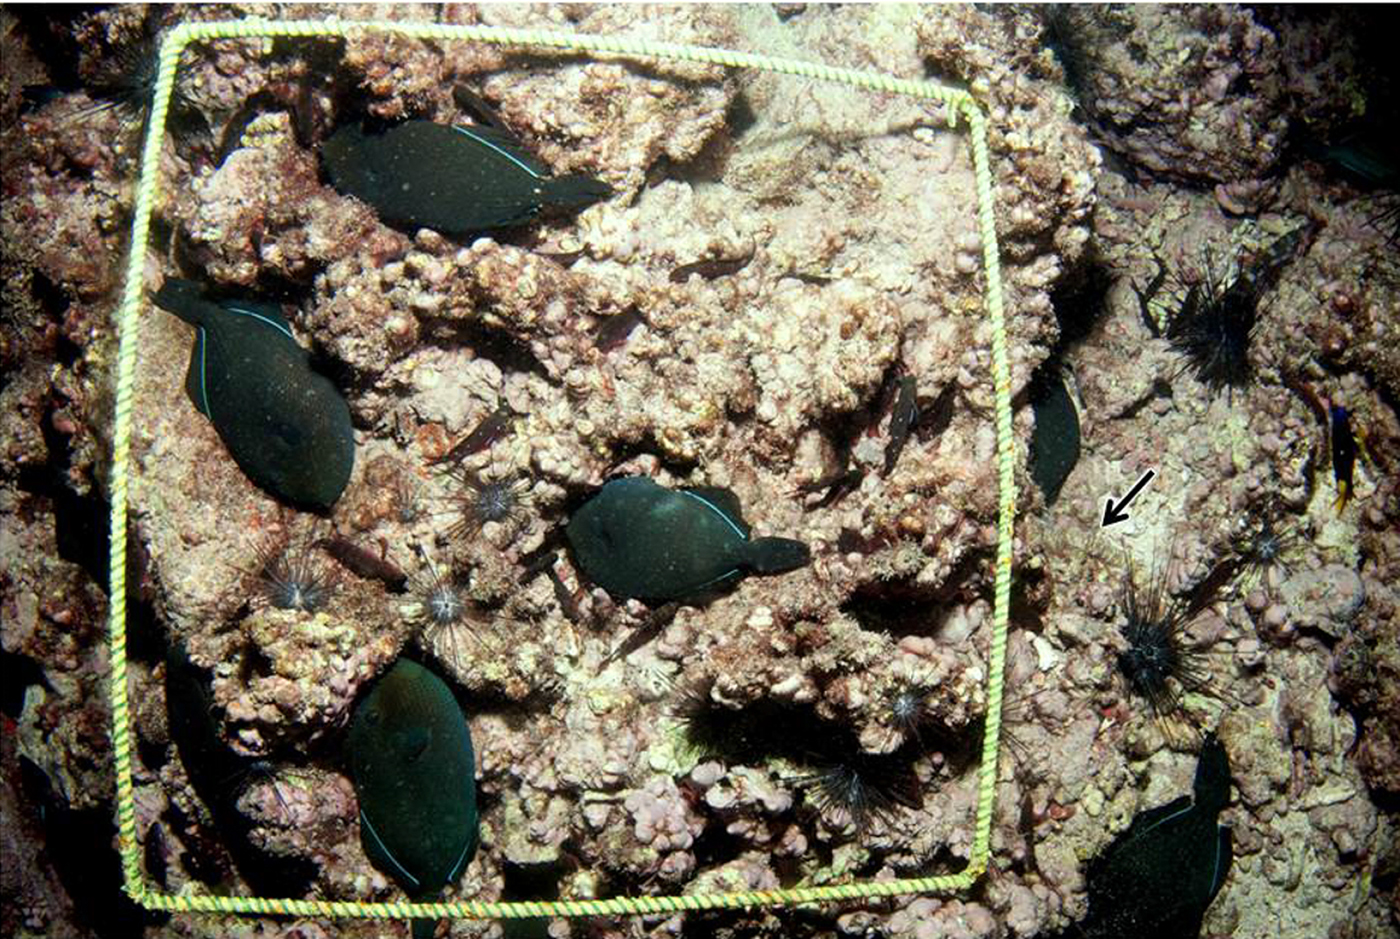
Because M. niger and D. antillarum were found in large numbers consistently throughout all transects (M. niger; mean density = 101.0 individuals 100 m−2, range = 57–135: D. antillarum; mean density = 218.5 individuals 100 m−2, range = 55–510), these species are analysed separately. Two-sample Wilcoxon test (as data did not conform to parametric assumptions) was used to compare day and night densities among pairs of day/night transects in these species. There was no significant difference found between day and night densities of M. niger (W = 16, P = 0.81). However, all night observations of this species were of individuals in a state of deep rest (Figure 2). In contrast, pairs of day and night densities of D. antillarum were significantly different (W = 5, P = 0.0411). Diadema antillarum tended to hide during day transects, although many could be observed by the surveyor. At night however, urchins were observed out on open rock surfaces (Figure 2).
Photo of resting M. niger at night (4 September 2014, N1Quadrat 5). Also seen are D. antillarum, and Euapta lappa (arrow). Quadrat is 0.5 × 0.5 m.
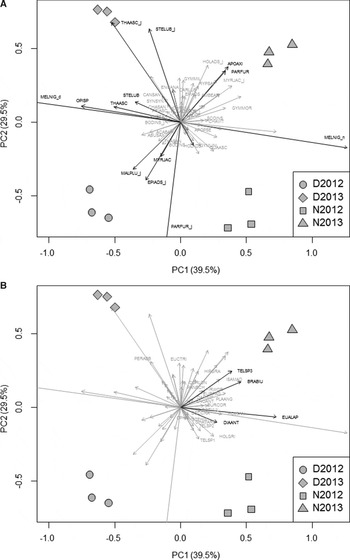
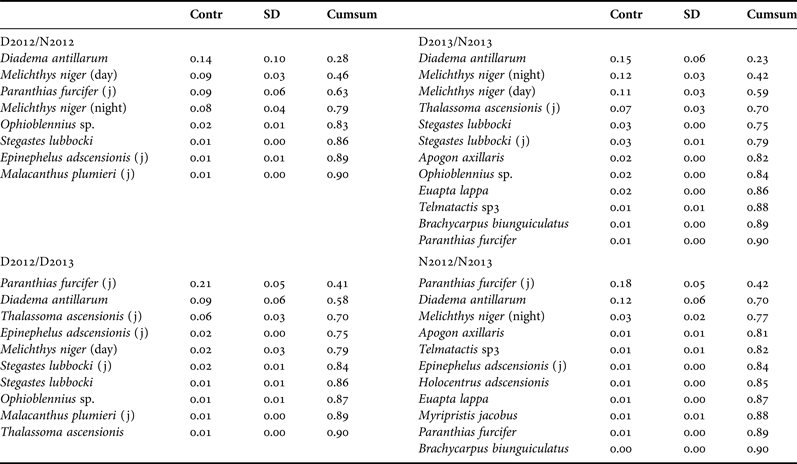
Principal component analysis of the day and night species matrix shows significant groupings of day and night surveys and surveys between seasons (ANOSIM, R-statistic = 0.8827, P = 0.001) (Figure 3). PC1 explains 39.5% of the variation in surveys, and represents the gradient between day (negative PC1) and night (positive PC1) surveys. This gradient seems to be strongly influenced by active or resting M. niger. As noted above, their day and night densities were not significantly different. Therefore in the PCA (Figure 3), the influence of M. niger effectively cancels each other out, and the abundance of other species can be interpreted with respect to their relative influence on survey groupings. Species driving this gradient are the echinoderms Euapta lappa, Holothuria (Platyperona) sanctori, Holothuria (Halodeima) grisea, D. antillarum at night, and the fish Ophioblennius sp., Thalassoma ascensionis, Stegastes lubbocki (adult) during the day. The gradient shown along the PC2 axis (explaining 29.5% of variation between surveys) represents the change in day and night assemblages between season (September 2012 and June 2013). These groupings are heavily influenced by the presence or absence of the juveniles of Paranthias furcifer, Epinephelus adscensionis, Malacanthus plumieri, Myripristis jacobus in 2012, and Apogon axillaris, Stegastes lubbocki, Holocentrus adscensionis and Thalassoma ascensionis in 2013. Analysis using SIMPER (per group identified in PCA) confirms these species are important for distinguishing groups; further detail of species driving the top 90% of these groupings are shown in Table 3.
Day and night species PCA. Top and bottom plots are identical, where the top plot names fish species, and the bottom plot names invertebrates. Species in black are those identified in SIMPER as being in the top 90% of species driving separation of day/night and 2012/2013 pattern.

SIMPER results for day/night comparison, and 2012/2013 comparison. Results of this analysis are Contr, Average contribution to overall dissimilarity; SD, Standard deviation of contribution; Cumsum, Ordered cumulative contribution.

Functional group diversity
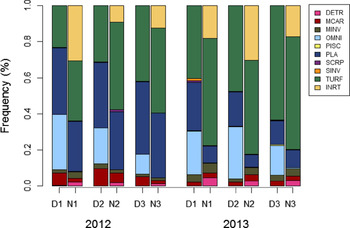
Both day and night functional group profiles showed large proportions of herbivores (TURF) and planktivores (PLA) (Figure 4). The main difference in functional group profile was the presence (day) or absence (night) of omnivores (OMNI). These were composed almost entirely of M. niger, where active fish in the day were replaced by resting (INERT) M. niger at night. Other species of omnivore were present in the day and at night, although in low numbers (Table 1). Other functional groups were present in generally low proportions, varying between day and night transects in different ways, e.g. macrocarnivores (MCAR) and mobile benthic invertivores/cleaners (MINV). Detritivores were found primarily at night, being composed of three species of holothurians (Table 1).
Proportion of functional groups per transect. Functional group codes are found in Table 1.
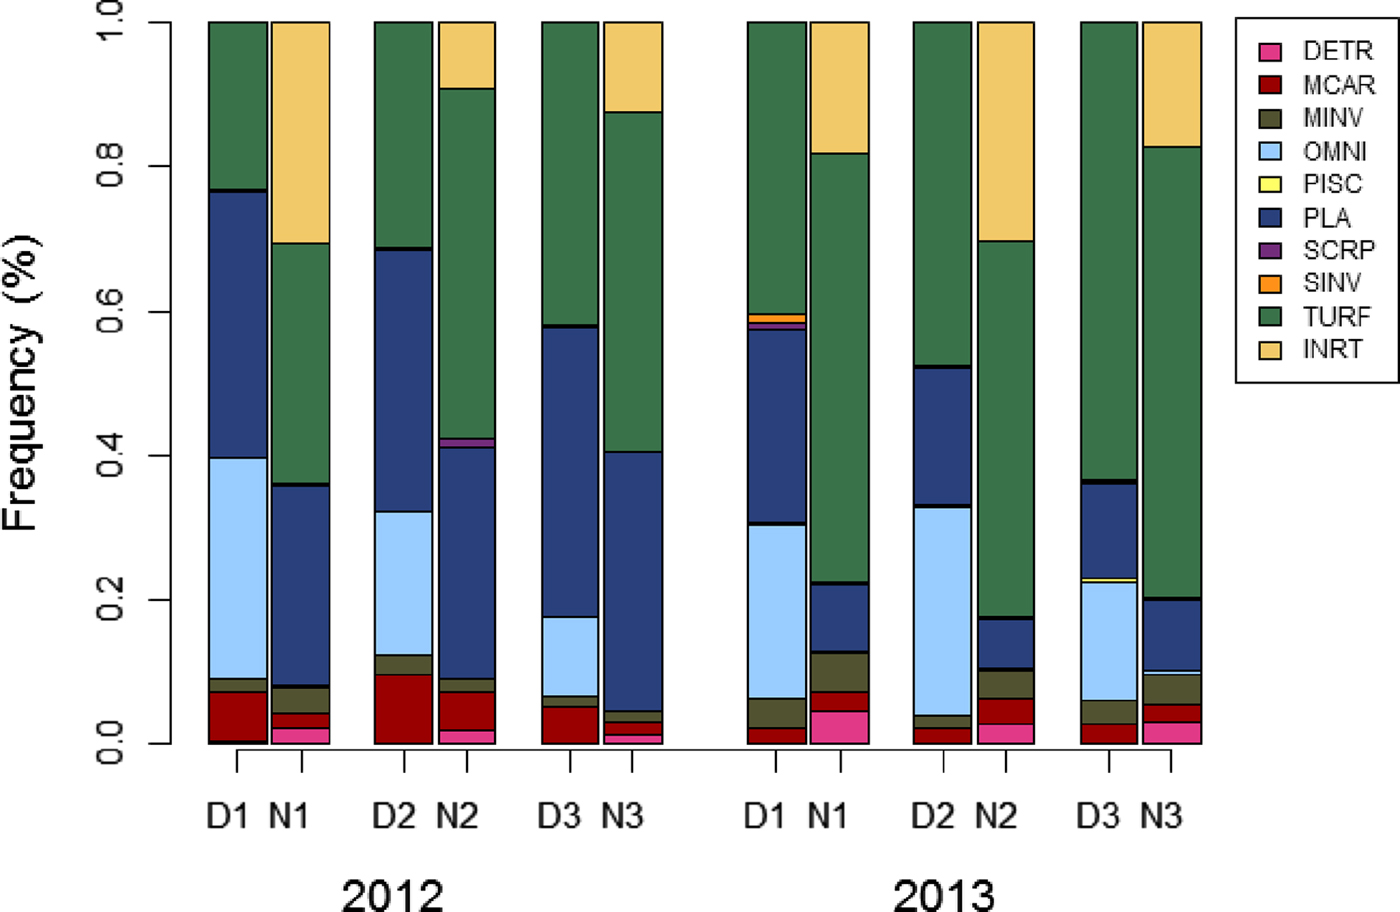
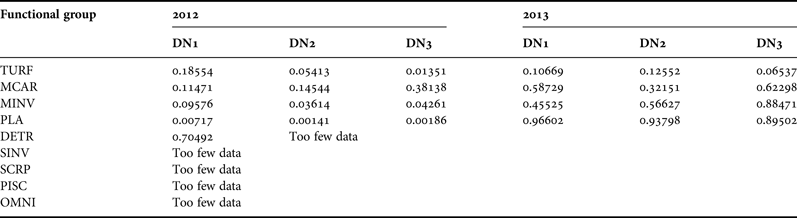
Functional group diversity was examined between day and night transects for each season. There were no significant differences between day/night S (here being the number of functional groups), H′ (relative abundance of groups present) and J′ (evenness of groups present) in each season (after ANOVA and Tukey's HSD post hoc tests). Within functional groups, species overlap between day and night transect pairs was tested using Morisita–Horn index of dissimilarity (Table 4). Particularly low dissimilarity between day and night assemblages was found within the planktivores (PLA) in 2012, due in part to high abundances of juvenile Paranthias furcifer in both day and night surveys. However in 2013, there was high dissimilarity between day and night planktivore species, this time driven by the relatively high abundance of juvenile Thalassoma ascensionis in the day and high abundance Apogon axillaris at night. For mobile benthic invertivores/cleaners (MINV), low dissimilarity was seen in 2012, while high dissimilarity was seen in 2013, possibly driven by the presence of the shrimp Brachycarpus biunguiculatus at night, but also the presence or absence of a variety of low abundance species found in night or day surveys. There was a surprisingly low dissimilarity for herbivore species turnover between day and night transects (Table 4), suggesting that in general most herbivore species were found in both day and night surveys, although varying in their abundance only between day and night.
Species overlap (Morisita–Horn index) within functional groups. High values represent high dissimilarity (i.e. low number of shared species). Instances marked ‘too few data’ mean that there were too few occurrences (many zeros) or the functional group was made up of only one species, meaning that comparison was not possible.

DISCUSSION
We quantitatively show clear differences between the day and night shallow reef assemblages on Ascension Island. Overall, invertebrate density increased by over 50% at night compared with the day, while fish density decreased. The sea urchin Diadema antillarum was a large component of this increase, emerging from crevasses at night; this predator avoidance behaviour has been well studied in the tropical Atlantic (e.g. Rodríguez-Barreras et al., Reference Rodríguez-Barreras, Pérez, Mercado-Molina, Williams and Sabat2014). Indeed, the majority of invertebrates surveyed were found exclusively at night. For example, the holothurians Holothuria (Platyperona) sanctori, H. (Halodeima) grisea and Euapta lappa all increased activity at night. These large (10 s of cm in length), soft-bodied, slow-moving species may be particularly susceptible to predation, and their nocturnal emergence may be a predator avoidance behaviour (Hammond, Reference Hammond1982). PCA and ANOSIM analyses indicate significant differences between day and night assemblages, however these analyses also show that there is a great deal of variability not well explained, where the first two PCA axes explained only 69% of multivariate variation in the species matrix. Sample size is relatively low in the present study with limited replication, which may lead to a poorly resolved pattern. This study does provide strong guidance towards developing and testing hypotheses of important ecological gradients within the assemblage (e.g. day/night, depth, season) that can be translated into a more fully replicated and stratified design in the future, spanning a wider spatial extent.
It should be pointed out that day and night survey observations are based on those species that are in fact observable in either the day or night. In other words, with the exception of some fish that may have diurnal depth migrations, the actual assemblage is likely to be similar between day and night, where unobserved taxa are present but hidden. For example, M. niger densities were not significantly different between day (observed to be swimming) and night (observed to be resting) transects, suggesting that they are somewhat resident to specific areas. Conversely, D. antillarum densities were significantly different between day and night surveys. However in this case, they are simply hidden from view in the day, and this is likely to be the case for all invertebrates observed at night. What this means in terms of trophic dynamics is unclear, however it is thought that species’ refuge sites are sub-optimal for food resources (Barnes & Crook, Reference Barnes and Crook2001 for review). Therefore it is reasonable to assume that the trophic ecology of the reef is roughly partitioned between day and night, described by a representative turnover of species and related functional groups. What this means in terms of the reef's day and night distribution of biomass and coincident diversity remains unknown; further investigation into the diversity-biomass (i.e. productivity) relationship would offer good insight into the overall ecosystem functioning of tropical reef systems (Gaston & Blackburn, Reference Gaston and Blackburn2000).
Although predator avoidance may be a driver for nocturnal activity in some species, many other reef species have evolved to take predatory advantage of their behaviour. For example, we show that anemone (Telmatactis sp. and Isarachnanthus maderensis) emergence is exclusively at night. This is likely to be related to feeding on the nocturnal emergence of benthic zooplankton (Sebens & DeRiemer, Reference Sebens and DeRiemer1977). Increased zooplankton (e.g. copepods) and other small crustacean (cumaceans and amphipods, etc.) abundance at night has been reported widely for temperate and tropical shallow reefs (Ohlhorst, Reference Ohlhorst1982; Annese & Kingsford, Reference Annese and Kingsford2005; Nakajima et al., Reference Nakajima, Yoshida, Othman and Toda2009; Heidelberg et al., Reference Heidelberg, O'Neil, Bythell and Sebens2010), where they swarm near the bottom or hide in sediment in the day, and emerge into the water column at night with depth and time of emergence varying with species (Alldredge & King, Reference Alldredge and King1980). Increases in zooplankton at night were not measured in this study, however it can be inferred through the higher abundance of other planktivorous fish such as the cardinalfish (Apogon axillaris) (Marnane & Bellwood, Reference Marnane and Bellwood2002) reported in the present study at night, particularly in 2013. Nocturnal feeding on zooplankton may also drive the emergence of benthic decapods found in the present study (e.g. Brachycarpus biunguiculatus). Furthermore, the role of other more cryptic trophic associations such as diel patterns of fish parasites, fish, and their mutualistic cleaner fish and invertebrates commensals (Chambers & Sikkel, Reference Chambers and Sikkel2002) cannot be ignored.
In addition to day/night patterns of species abundance, there is also a strong seasonal pattern in both day and night assemblages. This pattern was driven primarily by the presence or absence of juveniles of a variety of fish species, where principal component analysis and rank abundance analyses show a difference in juvenile night assemblage between surveys (spanning 9 months) as well as differences in the day assemblages. Timing and location of, for example, spawning aggregations in reef fish are known to be highly precise and variable among species (Domeier & Colin, Reference Domeier and Colin1997). In particular, species of the Serranidae (e.g. Paranthias furcifer and Epinephelus adscensionis highlighted in the present study), are known to form seasonal spawning aggregations; their differences in reproductive timing may account for the seasonal variation in their presence or absence shown in Ascension Island. Difference in length of larval stages will also determine when the juveniles are visible in abundance counts. Certainly, variability between seasons in other species may be due to those species being rare or found in particularly low abundances in the area surveyed (i.e. those having low rank abundance). As such, sampling error may account for at least some of this variability. More comprehensive sampling is needed to find true seasonal or inter-annual differences in rare species. In addition, seasonal patterns related to reproductive timing also need to be considered in future trophic studies.
Herbivorous and planktivorous species dominated the functional group profile in all the day and night surveys. There was no difference in the diversity of functional groups between day and night, although there was significant turnover in species within each functional group between day and night assemblages. Given this high species turnover, this suggests that there may be a degree of ‘functional redundancy’ (sensu Rosenfeld, 2002) in this system. That is, because species within the group share a similar functional role, some species loss may have little effect on the overall functioning of the ecosystem. Functional redundancy, therefore, offers the ecosystem some resilience to perturbations. This has been studied in herbivorous reef fish (e.g. Hamilton et al., Reference Hamilton, Smith, Price and Sandin2014), and in cases where there is significant exploitation of reef fish, the consequences of reduced functional redundancy can have significant negative effects on the reef system (e.g. Bellwood et al., Reference Stuart-Smith, Bates, Lefcheck, Duffy, Baker, Thomson, Stuart-Smith, Hill, Kininmonth, Airoldi, Becerro, Campbell, Dawson, Navarrete, Soler, Strain, Willis and Edgar2003). Although we define functional diversity solely by the presence and relative abundance of trophic groups, true functional diversity of an assemblage may integrate a wider range of ecological traits including species abundance, body size, behaviour and habitat characteristics (e.g. Stuart-Smith et al., Reference Stuart-Smith, Bates, Lefcheck, Duffy, Baker, Thomson, Stuart-Smith, Hill, Kininmonth, Airoldi, Becerro, Campbell, Dawson, Navarrete, Soler, Strain, Willis and Edgar2013; Whittaker et al., Reference Whittaker, Rigal, Borges, Cardoso, Terzopoulou, Casanoves, Pla, Guilhaumon, Ladle and Triantis2014). In the present study, we found numerical dominance in a few species, but low abundance (local rarity) in others, drawing into question how much effective redundancy there actually is within functional groups. Indeed, our interpretation of functional redundancy in the present study can be an artefact of how we have defined our functional groups (Bellwood et al., Reference Bellwood, Hoey and Choat2003, Halpern & Floeter, Reference Halpern and Floeter2008), where our functional group might be too broad, thereby being more descriptive of the species’ fundamental niche space, when the reality is that each species occupies a very narrow realized niche space (Hutchinson, Reference Hutchinson1957; Morlon et al., Reference Morlon, Kefi and Martinez2014), which would result in a reduced functional redundancy overall. Future trophic studies in Ascension Island should focus on the importance of abundant versus rare species, their relationship to habitat type, and species’ morphological features as has been shown to be important in other reef systems (e.g. Ellingsen et al., Reference Ellingsen, Hewitt and Thrush2007; Stuart-Smith et al., Reference Stuart-Smith, Bates, Lefcheck, Duffy, Baker, Thomson, Stuart-Smith, Hill, Kininmonth, Airoldi, Becerro, Campbell, Dawson, Navarrete, Soler, Strain, Willis and Edgar2013; Aguilar-Medrano & Calderon-Aguilera, Reference Aguilar-Medrano and Calderon-Aguilera2015).
The presence/absence and abundance of species in the day compared with night, and hence the trophic profile of the reef, will likely be strongly correlated with habitat complexity as it relates to refuge space for fish and invertebrates (e.g. Beukers & Jones, Reference Beukers and Jones1997; Wilson et al., Reference Wilson, Graham and Polunin2007 for review). The subtidal rocky seabed of Ascension Island can be extremely complex, with non-geniculate coralline red algae creating formations that add significantly to benthic rugosity. Such complexity will vary spatially throughout the island and at varying depths; in the present study the same habitat was surveyed in both seasons. However, future studies of trophic complexity or other ecological studies of assemblages across wider spatial scales should include habitat complexity as a co-variable. Furthermore, there is evidence of important yet highly cryptic habitats such as in the internal spaces of maerl balls and reef-forming coralline tower formations (SMSG unpublished observations) that should be more thoroughly explored.
Trophic processes of tropical marine communities can be placed on a spectrum of top-down (e.g. predation pressure) versus bottom-up (e.g. physical forcing) control of trophic dynamics, where placement along this spectrum is dependent on biotic and abiotic processes acting across a broad range of spatio-temporal scales (Vinueza et al., Reference Vinueza, Menge, Ruiz and Palacios2014). Moreover, in these systems dynamics are not static and can be modified by, for example, spatio-temporal variability in oceanographic processes (e.g. Vinueza et al., Reference Vinueza, Menge, Ruiz and Palacios2014). Our data show that there is significant daily and seasonal variability in species composition, abundance and functional group profile in Ascension Island. This suggests that there are a very wide range of species and processes that contribute to the trophic dynamics of the reef system. For example, at this location there have been significant seasonal cold-water upwellings detected compared with near-by sites (SMSG, unpublished data). Future research should examine interactions of such bottom up-processes with potential top-down processes (herbivory and predation on herbivores) for better understanding of reef assemblages and ecosystem function across local and wider-spatial scales in this highly isolated tropical reef system.
ACKNOWLEDGEMENTS
Funding for this work came from a grant to the Shallow Marine Surveys Group (SMSG) from the Darwin Initiative (EIDCF012). The two expeditions were organized by SMSG and the South Atlantic Environmental Research Institute. Constructive comments on early drafts by A. Arkhipkin are gratefully acknowledged, as well as the comments by two anonymous reviewers. The authors thank the members of SMSG for excellent work in the field, and the continued support of the Falkland Island Government Fisheries Department. We would also like to thank the Ascension Island Government, the staff at the Conservation Centre, and members of the Ascension Island Dive Club for their cooperation, accommodation and hospitality. Finally we are very grateful to British Forces South Atlantic Islands for their logistical support.