Introduction
European populist radical right parties (PRRPs) have been a prolific topic of research in recent political science. Their discourse, leaders, electorate, and causes of emergence and success have been dissected in multiple articles and books (see, for comprehensive comparative works, Kitschelt and McGann, Reference Kitschelt and McGann1995; Mudde, Reference Mudde2007; Akkerman et al., Reference Akkerman, de Lange and Rooduijn2016). However, only recently have there been some inroads into the empirical consequences of the rise of radical right parties, trying to answer the question of whether all the attention and concern is indeed justified. Some researchers have discussed, for example, whether radical right parties restructure the party system and lead mainstream parties to change their platforms (Mudde, Reference Mudde2013; Rooduijn et al., Reference Rooduijn, de Lange and Van der Brug2014). Others have analyzed their performance as members of governing coalitions (Akkerman and de Lange, Reference Akkerman and de Lange2012; Albertazzi and Mueller, Reference Albertazzi and Mueller2013), and how much of their radical program was actually implemented.
This paper aims at contributing to understanding the consequences of these parties’ ascension, and investigates whether PRRPs have an impact on political polarization among the public. The existence of polarization in the electorate has been suggested as a factor contributing to radical parties’ success (Merrill and Adams, Reference Merrill and Adams2002; Ezrow et al., Reference Ezrow, Tavits and Homola2014b): in a nutshell, the idea is that where the public is polarized, politicians have an incentive to push more extreme views in order to appeal to the larger number of voters ideologically distant from the center. This has been supported by cross-national evidence that such parties do fare better when the public is more polarized (Bustikova, Reference Bustikova2014; Ezrow et al., Reference Ezrow, Homola and Tavits2014a).
I turn the arrow around and ask whether PRRP’s not only flourish under polarization, but might also contribute to an even more polarizing environment. With the influence that political elites have on mass-level opinion formation, it has been proposed that higher elite polarization – which we may expect when a PRRP rises – would lead to higher polarization among the public (e.g. Hetherington, Reference Hetherington2001; Abramowitz and Saunders, Reference Abramowitz and Saunders2008; Adams et al., Reference Adams, Green and Milazzo2012b; Lupu, Reference Lupu2015). This matters because polarization and its potential negative effects, such as higher dissatisfaction with democracy among supporters of the losing side (Iyengar et al., Reference Iyengar, Sood and Lelkes2012) or worse government performance (Sørensen, Reference Sørensen2014), are not restricted to two-party systems (Hansen and Kosiara-Pedersen, Reference Hansen and Kosiara-Pedersen2015). Elite polarization may lead consensual and consociational democracies into a centrifugal path, often associated with unstable regimes, as Vatter (Reference Vatter2016) argues is happening in Switzerland.
I use a synthetic control model (Abadie and Gardeazabal, Reference Abadie and Gardeazabal2003) to test whether mass polarization in the Netherlands has increased after the electoral breakthrough of radical right populists. From a pool of comparable countries, this method creates a best possible counterfactual, similar to the Netherlands in all aspects except for the rise of a PRRP. The logic is experimental: it compares a unit that received a treatment to itself (represented by its best possible counterfactual) which did not receive the treatment, and tests whether there is a difference in the outcome of interest. Results suggest that, had it not been for the rise of right-wing populism to prominence in Dutch politics since 2002, mass-level polarization in the following decade would have been significantly lower. Mass polarization is calculated based on Eurobarometer data, which fields surveys twice a year in all EU countries, allowing for a the construction of a large enough time series.
The arguments and findings here are not only relevant for those interested in Dutch politics. First, they contribute to the discussion on how mass and elite-level polarization are connected, supporting the argument of a top-down link between them. Second, the method used allows us to make a causal argument that puts the rise of right-wing populism as one cause of mass polarization. This goes against a growing part of radical right literature that sees little, if any, impact of the rise of radical right parties (see for instance, Mudde, Reference Mudde2014; Rooduijn et al., Reference Rooduijn, de Lange and Van der Brug2014). It seems that, at least to a certain extent, the worries about these actors are justified. The results indicate that the binomial PRRP-polarization might lead to a polarizing spiral: higher polarization contributes to radicals’ success, and stronger radical parties lead to an even more polarized electorate.Footnote 1 Third, the analysis shows how a synthetic control model can be applied to study the impacts of party-system change, in what may also be expanded in future research of political and institutional change.
How can PRRP’s contribute to mass polarization?
This article follows the well-established definition of PRRPs given by Mudde (Reference Mudde2007: Ch. 1). These are parties whose ideology is characterized by three aspects: populism, authoritarianism, and nativism. Populism is seen as a thin ideology which divides society into a good, homogeneous ‘people’, and an ‘evil elite’, and considers that the people’s ‘general will’ should govern politics. Authoritarianism refers to the idea of a strictly ordered society valuing discipline and obedience to authority. Nativism is defined as a xenophobic nationalism where the country should be reserved for nationals, and this collective identity is seen as threatened by non-nationals (Mudde, Reference Mudde2014: 218).
Polarization, in general, can be understood as a situation in which a group or population may be divided into separate ‘clusters’, and there is (a) high within-cluster similarity alongside, (b) high between-cluster dissimilarity (Esteban and Ray, Reference Esteban and Ray1994). Political polarization, therefore, may be seen as the division of individuals (mass-level), or parties (elite-level), into distant ideological camps positioned at the extremes, while the central position is voided (Downs, Reference Downs1957). This may be associated with partisan sorting, a phenomenon through which individuals that have a certain ideology become more likely to identify with a specific party (Lupu, Reference Lupu2015). An example is the United States, where liberals are becoming more likely to identify as Democrats and conservatives as Republicans (Fiorina et al., Reference Fiorina, Abrams and Pope2008).
At the mass level, polarization is defined here as the process through which the public moves toward the extremes of an ideological distribution, making the ends have a higher weight and diminishing the share of individuals around the middle. Elite-level polarization is treated in this paper as party-system polarization (Dalton, Reference Dalton2008), in which political parties get more distant, ideologically, from one another.
There is growing evidence for a link between elite- and mass-level polarization in several countries (see e.g. Abramowitz and Saunders, Reference Abramowitz and Saunders2008; Levendusky, Reference Levendusky2009; Adams et al., Reference Adams, Green and Milazzo2012b; Lupu, Reference Lupu2015, for accounts on the United States, United Kingdom, and a larger pool of countries). The mechanisms proposed are based on the fact that voters often form their policy preferences following partisan alignment (Zaller, Reference Zaller1992; Lavine et al., Reference Lavine, Johnston and Steenbergen2012). Because it is costly (both regarding resources and time) to get well informed about a wide range of policy issues, some of which have no direct consequence on daily life, individuals look for the positions assumed by their preferred parties or other trusted participants in the public debate as information shortcuts to form their own opinion accordingly (Lupia, Reference Lupia1994).
Therefore, when elites’ opinions are close to one another, individuals who take these cues should not form polarized groups. However, once elites start a centrifugal movement, voters’ alignment follows and mass polarization happens as a consequence. This process might lead to a polarization spiral, in which voters’ adherence to party lines gets even stronger, since the split between them and an out-group gets clearer (Druckman et al., Reference Druckman, Peterson and Slothuus2013), and the radicalization of supporters drives party elites toward them in turn. It has been observed that a politician’s endorsement of a policy might have a polarizing effect not only by lining up her own supporters behind it, but by generating repulsion for it from opponents (Nicholson, Reference Nicholson2012).
At the psychological level, confirmation bias and motivated reasoning contribute to this picture (Jacobson, Reference Jacobson2010). First, individuals tend to seek and consume information that is in accordance with their previously held beliefs, and that leads down a slope toward more extreme positions. Motivated reasoning is responsible for ‘twisting’ the interpretation of received information that contradicts one’s beliefs to fit the pre-existing expectations (Jacobson, Reference Jacobson2010). As a consequence, we might expect ideological groups influenced by polarizing elites to become more internally homogeneous while also more distant from others.
When it comes to the polarizing effects of PRRP’s, this point is of relevance also because the in- and out-group divide for voters of these parties is especially clear. Given some of the parties’ extreme positions, those who are against them are strongly so; moreover, considering the populist part of their discourse, which paints all other parties in the political system as a homogeneous corrupt group, PRRP partisans would share an antipathy toward all other political actors. This would drive these supporters ever further away from positions embraced by any traditional or mainstream party.
Such a mechanism implies that, when parties themselves get polarized around one or several issues, voters will also sort themselves out along these lines and, consequently, get more polarized. The sorting might happen on one issue that becomes salient and in which parties assume polarizing positions (e.g. Jensen and Thomsen, Reference Jensen and Thomsen2011), or across many relevant issues (e.g. Zingher and Flynn, Reference Zingher and Flynn2016), in which case there is little overlap between supporters of different parties and the negative consequences of polarization are more visible.
Empirically, the relation between elite and mass-level polarization has been observed in different countries – with elite-level polarization being understood as party-system polarization. In the Netherlands during the 1980s and 1990s, when major parties depolarized along a traditional left-right continuum, the public followed suit and also depolarized (Adams et al., Reference Adams, De Vries and Leiter2012a). The same simultaneous depolarization movement was seen in the United Kingdom (Adams et al., Reference Adams, Green and Milazzo2012b). Conversely, in the United States, most evidence shows that the increased party-system polarization has led the public to sort itself into clearly separated groups (Hetherington, Reference Hetherington2001; Druckman et al., Reference Druckman, Peterson and Slothuus2013; Zingher and Flynn, Reference Zingher and Flynn2016).
PRRPs are especially well positioned to exercise a polarizing effect over party systems for three reasons: first, they have a radical ideology which, by itself, tends to contribute to party-system polarization (Dalton, Reference Dalton2008). If there is indeed an increase in party-system polarization after their entrance into the system, public opinion would follow. Second, PRRP’s rise is often associated with politicizing issues over which mainstream parties had a kind of consensus. They break a ‘spiral of silence’ (Arzheimer, Reference Arzheimer2009) and force other parties to assume a position on issues that were uncontroversial up to then. Bringing a new issue to salience in public debate, with strong positions on it, is also expected to drive the public into aligning with the different sides and to polarize around it.
Third, Brader et al. (Reference Brader, Tucker and Duell2013) propose that parties can better lead public opinion when (1) they are in opposition, and (2) they have a clear and identifiable ideological stance. PRRP’s, at least upon emerging, are in clear opposition not only to the government, but to all other existing political parties. And also, at least on the issues they campaign on – most notably anti-immigration – there is a clear ideological position. Therefore, upon the emergence of PRRP’s we should expect a general party-system polarization that is followed by mass polarization, given the mechanisms through which political elites and parties influence public opinion.
The Netherlands as a case study
The Netherlands was a latecomer to the group of Western European countries with successful PRRPs. While in Belgium, France, or Austria, these actors had enjoyed significant levels of public support and good electoral results since the 1980s or early 1990s, it was not until 2002 that the Dutch political system saw the arrival of a strong, populist right-wing challenger, in the figure of Pim Fortuyn. He created his party, the List Pim Fortuyn (LPF), only 3 months before the 2002 parliamentary elections, and was polling very well for a newcomer all the way until his assassination, 9 days before election day. The party went on to make an impressive 17% of the national vote and joined the governing coalition. This agreement, however, was short-lived. The first Balkenende cabinet lasted for only 87 days, and new elections were called for 2003, in which the LPF, without its charismatic founder, started its stark decline that ended with an official dissolution in 2008.
Pim Fortuyn seized a window of opportunity when mainstream parties had grown similar to one another, and voters were dissatisfied with the lack of real political alternatives (Pennings and Keman, Reference Pennings and Keman2003; Koopmans and Muis, Reference Koopmans and Muis2009). Dissatisfaction with politics, not with the economy, was suggested as the cause for the party’s success (Van Holsteyn and Irwin, Reference Van Holsteyn and Irwin2003). However, not only dissatisfaction was behind his support. The LPF ideology, similar to many Western European PRRPs, combined a strong anti-immigration element with severe opposition to the political establishment and European integration (Zaslove, Reference Zaslove2004). These policy issues, most notably the anti-immigration stance, were found to be a better predictor of LPF support than pure political dissatisfaction or cynicism (Van der Brug, Reference Van der Brug2003).
The rise of the LPF caused a sudden systematic change in the Dutch party system, that lasted long after the party’s decline, by introducing a new cleavage to a previously unidimensional party system (Pellikaan et al., Reference Pellikaan, Van der Meer and de Lange2003, Reference Pellikaan, de Lange and Van der Meer2007). As a reaction to its popularity, mainstream center-right parties have immediately shifted their position rightwards on issues such as immigration (Bale, Reference Bale2003; Van Kersbergen and Krouwel, Reference Van Kersbergen and Krouwel2008), a movement which was followed even by center-left parties (Van Spanje, Reference Van Spanje2010). The fact that voters chose the LPF because of its policy preference on immigration (Van der Brug, Reference Van der Brug2003) indicates that this is an example of a PRRP politicizing an issue over which the existing parties had a silent consensus. It contributed to the observed increased salience of attitudes toward immigration in ideological divisions within Dutch public opinion (de Vries et al., Reference de Vries, Hakhverdian and Lancee2013; Berkhout et al., Reference Berkhout, Sudulich and Van der Brug2015).
In spite of the LPF’s fall from grace, the supply of right-wing populism in the Netherlands was but briefly interrupted. In 2005 Geert Wilders, an independent MP who had left the center-right People’s Party for Freedom and Democracy (VVD) in 2004, founded a new, one-man party, the Party for Freedom (PVV). The new party’s ideology was, from the beginning, anti-immigration – most specifically against Islamic immigration – arguing that Islamic values were incompatible with the secular and liberal principles of Dutch and, more generally, western societies (Vossen, Reference Vossen2010). This was similar to the combination of anti-immigration ideology and liberalism already observed in Pim Fortuyn’s discourse (Akkerman, Reference Akkerman2005). Throughout the years, Wilders’ ideology changed in some respects, getting closer to American neo-conservative populism (Vossen, Reference Vossen2011). His anti-establishment stance, however, remained as a defining feature of his party, and is reflected in voting behavior studies of party supporters. Protest and ethnocentrism have been found to be strong predictors of support for the PVV in the Netherlands, superior to traditional economic left-right divisions and even new, socio-cultural left-right ideological cleavages (Schumacher and Rooduijn, Reference Schumacher and Rooduijn2013; de Koster et al., Reference de Koster, Achterberg, Van der Waal, Van Bohemen and Kemmers2014), as opposed to what was observed in the case of the LPF. The PVV was able, right in its first elections in 2006, to secure 5.7% of the votes, a number that increased to 15.5% in 2010, with 24 chairs.
The Netherlands, therefore, presents itself as a good case for testing whether the rise of the populist radical right has an impact on political polarization. First, the Dutch populist radical right was also responsible for politicizing an issue, immigration, which was not a cause of large political disagreement among Dutch political elites before 2002 (Berkhout et al., Reference Berkhout, Sudulich and Van der Brug2015). By doing so with a strong position, it made the options clear for voters, and contributed to a realignment along this new cleavage by both raising the salience of a new issue and assuming an extreme position on it.
Second, the proposed theoretical mechanism of elite-level polarization leading to mass-level polarization is plausible in the Netherlands. Indeed, the LPF election increased party-system polarization in the country. Its polarization index went from 2.89 in 1998 to 3.64 in 2002 in Dalton (Reference Dalton2008: 907), an upward shift larger than all but four cases in that study.Footnote 2 Using the polarization measure from Esteban and Ray (Reference Esteban and Ray1994), Oosterwaal and Torenvlied (Reference Oosterwaal and Torenvlied2010) also show that political parties and partisans have polarized in the Netherlands after 2002 on ethnic immigration policy.Footnote 3 Therefore, the mechanisms theorized for explaining how the emergence of a PRRP could lead to higher mass-level polarization are clearly present in the Netherlands during the 2000s, making it a typical case for testing whether there is indeed such an effect.
A counter-argument of endogeneity might be raised at this point. The measurement of elite-level polarization here is influenced by voters’ preferences, since it is weighed by party size. The party system having centrifugal tendencies means that parties going to (or at) the extremes have popular support, and therefore mass polarization might have preceded its party-system counterpart. Indeed, Ezrow et al. (Reference Ezrow, Homola and Tavits2014a) show that when voters are polarized, extreme parties fare better. This bottom-up approach suggests that extreme voters make parties (especially new ones) try to cater to their preferences, resulting in the emergence of more extremism (Merrill and Adams, Reference Merrill and Adams2002). Given the absence of absolutely unweighed measures of party-system polarization, I use a sensitivity test which checks whether we observe an unaccounted increase in mass polarization prior to 2002 in the Netherlands, to confirm the direction of causality.
The synthetic control method (SCM)
SCM is a statistical technique developed to perform case studies in which the question is whether a structural transformation had a causal impact on a variable of interest over time. These can be, for example, the effect of terrorism on economic development (Abadie and Gardeazabal, Reference Abadie and Gardeazabal2003), the impact of enacting a public policy on its desired goals (Abadie et al., Reference Abadie, Diamond and Hainmueller2010), or the consequences of the 1973 oil shock on democratization in oil-rich countries (Liou and Musgrave, Reference Liou and Musgrave2014).
To perform the analysis, this method uses comparable units (countries, regions, etc.), to construct a ‘synthetic control’, which is a unit as similar as possible to the case of interest except for the structural transformation. For example, Abadie and Gardeazabal (Reference Abadie and Gardeazabal2003), who investigate the economic consequences of terrorism in the Basque country, construct a ‘synthetic Basque country’ with similar demographic and economic characteristics to the real one before the start of terrorist activities in the 1970s. Most importantly, the trajectory of gross domestic product (GDP) per capita in both is matched before 1970 and compared after. If there is no economic effect of terrorism (the null hypothesis), GDP per capita in the synthetic region should closely track the real one over time after terrorist attacks started. However, if there is an impact, economic development between the two should be similar before terrorism, but different after.
The central assumption is that, if the synthetic control closely reproduces the dependent variable over time in the real case before the event happened, the only reason for a difference to exist between the two after is if the occurrence had a causal impact. Under the null hypothesis of no effect, the synthetic control should continue to closely track the real unit after the structural transformation takes place. Therefore, the closest the fit between a treated unit and its synthetic control prior to the event, the more confidence it is possible to have on the results. Consequently, the main goal of the algorithm is to find a weighed average to construct a synthetic control that best reproduces the pre-event (or pre-treatment) behavior of the dependent variable on the unit of interest. Given this, a longer pre-treatment period, with a larger number of observations, also increases confidence that the synthetic control is indeed a good reproduction of the treated unit’s path (Abadie et al., Reference Abadie, Diamond and Hainmueller2010, 2015).
A synthetic control unit is constructed as a weighed average of comparable units that have not experienced the event of interest. Weights, always summed up to 1, are attributed to the potential units so that the resulting weighed average is the closest possible to the real case on the pre-treatment values of both the outcome variable and a number of relevant covariates. While it is desirable that the synthetic unit looks like the real one on a list of observed covariates, the most important is that it reproduces the pre-treatment trend on the dependent variable, in which case it is possible to assume the absence of unobserved confounders that could influence the outcome. In the Basque example, the potential controls (called the ‘donor pool’) are the other 15 Spanish regions where there was no start of terrorist activities in the 1970s. There, the synthetic Basque country is an average of Catalonia and Madrid, with respective weights of 0.85 and 0.15 (Abadie and Gardeazabal, Reference Abadie and Gardeazabal2003), while all others are 0.
A synthetic Netherlands
In this study, to test whether the emergence of radical right populism in the Netherlands had a causal impact on mass polarization, I create a synthetic Netherlands as a weighed average of other Western European countries which did not experience the emergence of a PRRP in the time frame considered (1995–2012).Footnote 4 It is essential that levels of polarization in this synthetic Netherlands are as similar as possible to the original case up to 2002 – when the LPF made the radical right breakthrough in the country. If the emergence of the radical right had no impact over mass polarization, the synthetic trend should continue to follow closely the real Dutch one. A gap between the two would indicate that, after the emergence of a PRRP, the level of polarization in the Netherlands did not continue as it would have given no PRRP.
A key point is selecting which cases constitute the donor pool. The first requirement is that a case should not have experienced the same or a similar event during the period of the analysis. In a medical experimental analogy, this would be equivalent to having in the control group individuals who took a drug similar to the treatment. Therefore, any countries that also had the emergence of a PRRP between 1996 and 2012 should not be present.Footnote 5 A second limitation is of data availability: I use Eurobarometer surveys to measure the dependent variable over time, since this is the only survey fielded in multiple countries twice a year, allowing the construction of a time series with enough data points to make meaningful inferences from an SCM analysis. Therefore, considering the period of interest, the donor pool cannot go beyond the 14 other Western European countries that were part of the EU in 1996.
Of those, Denmark is removed because it experienced the rise of a PRRP during the period in this study. The Danish People’s Party was founded in 1996, and ran for its first national elections in 1998, getting more than 7% of the vote. As for other countries with a later emergence of PRRPs, the Sweden Democrats and the Finns Party have not achieved significant national electoral success until, respectively, 2010 and 2011, a time when any effects expected to be observed in the Netherlands should already be visible. LAOS (Popular Orthodox Rally) in Greece only broke 5% of the national votes once, in 2009 (with 5.63%), but did not sustain its support. Again, this is years after effects are expected to be seen in the Dutch case. The Golden Dawn, in its turn, had its first relevant electoral gains in May 2012, which is the date of the last surveys used.
A concern might be raised as well regarding cases where a PRRP was already strong in 1996. These refer specifically to Austria, Belgium, France, and Italy. Two arguments exist to maintain these in the donor pool: first, the emergence of PRRPs in these countries predated that of the Netherlands in at least 10 years – cases of the Northern League, which entered elections and parliament in 1992, and the Flemish Block, that crossed a 5% mark in national elections for the first time in 1991. Therefore, immediate consequences of their rise are expected to have stabilized by 2002. Moreover, if the rise of PRRPs in these countries did lead to more polarization, having them in the donor pool will underestimate the effects found in the Netherlands, and lead to a more conservative estimate. In the end, 13 Western European countries are included in the donor pool from which the synthetic Netherlands is constructed.Footnote 6 However, to ensure the reliability of results, I also run the analysis on a reduced donor pool of countries which had almost no experience of PRRPs whatsoever for the whole period, as a robustness test. It consists only of Germany, Ireland, Luxembourg, Portugal, Spain, and the United Kingdom.
One cannot apply traditional statistical inferences with the SCM, since its estimates are for the effects of treatment on a single unit, and the method does not rely on distributional assumptions. Therefore, to test whether results are likely to be a consequence of chance, permutation methods have been proposed to test the odds of observing a difference between treated and synthetic control units given no actual treatment effect. These are referred to as ‘placebo’ tests (Abadie et al., Reference Abadie, Diamond and Hainmueller2010; Ando, Reference Ando2015). They work by creating a synthetic control for each country in the donor pool, with the same ‘treatment’ date as that used for the unit of interest. Since units in the donor pool did not receive an actual treatment in 2002, the post-2002 gaps between them and their synthetic controls are an estimate of the post-treatment variation we can expect by chance (i.e. given no treatment effect). Therefore, if the observed effect for the Netherlands is larger than those for placebos, it means it was unlikely to be just a random variation. While the sample size (14) does not allow for a p-value at the conventional significance level of 0.05, the test still shows if any placebos had the same effect sizes even with no PRRP rise in 2002.
Measurement and data
Polarization
There is no one clear definition of mass polarization in political research, and measurement alternatives follow the conceptual disagreements. For this paper, I use two measures that are based on characteristics of a left-right self-placement distribution: the Agreement index (Van Der Eijk, Reference Van Der Eijk2001), and kurtosis. The first improves upon measures of dispersion (such as variance), and calculates polarization in ordered scales based on the proportion of respondents that are in contiguous categories. For instance, in a 1–7 scale, if all observations are at 6 and 7, there is high agreement between respondents. However, if cases are concentrated in specific points along the scale, say 1/3 at 1, 1/3 at 5, and 1/3 at 7, there is little contiguity, where respondents are close to tipping to one or the other side, and therefore more polarization.
To calculate agreement, this index first divides a distribution into layers in which each category with responses contains the same number of observations. For a single layer of the distribution, agreement is calculated as
 $$A\,{\equals}\,U{\times}\left( {1{\minus}{{(S{\minus}1)} \over {(K{\minus}1)}}} \right).$$
S is the number of non-empty categories and K the total number of categories in the scale (Van Der Eijk, Reference Van Der Eijk2001: 333). U is a measure of unimodality, defined as (Van Der Eijk, Reference Van Der Eijk2001: 332)
 $$U\,{\equals}\,{{(K{\minus}2){\times}TU{\minus}(K{\minus}1){\times}TDU} \over {(K{\minus}2){\times}(TU{\plus}TDU)}},$$
in which TU is the number of triples of categories (three contiguous points in an ordered scale) conforming to unimodality, while TDU are triples of categories deviating from unimodality. Triples deviating from unimodality can be represented as 101, meaning that there are responses in the first and last categories, but none in the middle. Triples conforming to unimodalities are all other options (including patterns such as 110, 011, or 001, for example). Finally, the degree of agreement in an empirical distribution is a weighed average of agreement in each of its layers (A, as calculated above, which becomes A i below), and proportions of cases in each layer are used as weights as follows:
 $$A\,{\equals}\,\mathop \sum\limits_i w_{i} {\times}A_{i} ,$$
in which i indicates each layer
 $(i\,{\equals}\,1,\,\ldots{\!},k)$
(Van Der Eijk, Reference Van Der Eijk2001: 334). For this paper this calculation has been rescaled from its original,Footnote
7
so that complete agreement is a unimodal distribution where all responses are in a single category, taking the value of 0. Complete disagreement (polarization) is a multimodal distribution taking the value of 1, while 0.5 denotes a uniform distribution.
Kurtosis is a measurement of polarization as bimodality, meaning that individuals are aggregated around two poles in a distribution – it corresponds specifically to the ‘voiding of the middle’ understanding of polarization (DiMaggio et al., Reference DiMaggio, Evans and Bryson1996). It is an indication of how close to normal a distribution is.Footnote 8 Its formula, following the proposition of Joanes and Gill (Reference Joanes and Gill1998: 185), is
 $$b_{2} \,{\equals}\,{{m_{4} } \over {s^{4} }}{\minus}3\,{\equals}\,\left( {{{n{\minus}1} \over n}} \right)^{2} {{m_{4} } \over {m_{2}^{2} }}{\minus}3,$$
where s is the sample standard deviation, m r the sample moment of order r, and n the sample size.
No doubt, these are not the only two possible measurements of polarization. Nevertheless, other common alternatives in the literature are not appropriate in this study. For example, DiMaggio et al. (Reference DiMaggio, Evans and Bryson1996) suggest calculating polarization as correlation between distributions. In ideology, polarization would be higher when individuals’ positions on one issue are highly correlated with their position on other issues. While this is ideal for estimating the shared ideological space in a single polity, it becomes difficult to conciliate across several countries, due to varying issues salience. With a time frame of two decades and 14 countries, it would be impossible to find a set of questions on political issues that would represent, meaningfully, the political debate in all cases.
Another option is partisan sorting, meaning the alignment between ideology and party preference (used, e.g., in Lupu, Reference Lupu2015). However, this is heavily dependent on the stability and institutionalization of a party system. Those with more established left and right parties are likely to have more partisanship than those with higher electoral volatility. However, it is not necessarily the case that in the second group polarization is lower. A third widely used indicator is the ER, for Esteban and Ray (Reference Esteban and Ray1994), which estimates both the internal cohesion and external difference of clusters in a distribution. An issue with this index is the necessity to impose who are the groups in the ideological distribution – for instance, centrists, leftists, and so on. Once again, the comparability of distributions across countries and over time is compromised if the researcher must define the groups a priori.
While the meaning of left and right also changes across time and space, the self-placement usually reflects what is understood in that moment as the commonly shared ideological distribution and, most important, shows how far individuals believe to be from the middle regardless of how they mentally fill these concepts. I follow Sani and Sartori (Reference Sani and Sartori1983) in assuming that it captures the relevant issues at the time, and can better indicate a general polarization in society than specific policy topics. Moreover, this aggregation might be expected to show lower short-term variance than public opinion on particular issues.
An objection may be made here that in different countries the question and answers are interpreted differently: in some countries, perhaps all left-leaning individuals would reply with a 1 in a 10-point left-right self-placement question, while all right-leaning would say 10, even if they are not extremists. This is a valid concern, but that does not affect the analysis done in a time series and focused on trends. For country differences, these are captured on the synthetic case, which reproduces the trend in the outcome variable of the treated. Regarding longitudinal shifts, we may assume that if question understanding changes, it would be a slow process captured on the trend prior to the rise of the PRRP. Moreover, a sudden change caused by this rise may, for example, lead many individuals to become more cautious in answering ideological questions, moving toward the center for fear of being associated with the new extremists. If anything, such a change would increase the chances of underestimating the extent of polarization in the Netherlands after 2002, and make it more difficult to identify a growth.
Data and predictors of polarization
Data for polarization is computed from the question ‘In political matters, people talk of “the left” and “the right”. How would you place your views on this scale?’ with answers from ‘1 – Left’, to ‘10 – Right’ in Eurobarometer surveys from 1995 to 2012. This observation trend started in 1995 when data from Sweden, Austria, and Finland, were added to the survey.Footnote 9 The Eurobarometer is used because it is the only survey to field twice a year in all EU countries, which gives enough data points for a time series and to build a donor pool. The analysis is done using both the kurtosis and agreement (Van Der Eijk, Reference Van Der Eijk2001) measures of polarization.
To build the synthetic controls I use variables that have been identified as predictors of mass polarization. The first is income inequality, which was found to increase mass-level polarization in the United States (Garand, Reference Garand2010). Data for income inequality uses the Gini Household Disposable Income from Solt (Reference Solt2014). GDP per capita based on purchasing power parity is also included, and data comes from the World Bank in constant 2005 international dollars. Data from the World Bank indicators is also used for total long-term unemployment. Ezrow et al. (Reference Ezrow, Homola and Tavits2014a) propose that in new democracies, where party brands are not established, assuming extreme positions pays off to parties, by making them more readily recognizable to voters. For this reason, age of democracy is included as the number of years since 1946 a country has been rated 6 or higher in the Polity combined score from Polity IV (Marshall et al., 2016).Footnote 10 Furthermore, if individuals’ political affiliations follow divisions among other social groups, such as religious or ethnic, this might decrease the room for finding a middle ground and bipartisanship (Huber et al., Reference Huber, Kernell and Leoni2005). Following Lupu (Reference Lupu2015), I include an indicator with the average of ethnic, religious, and linguistic fractionalization based on Alesina et al. (Reference Alesina, Devleeschauwer, Easterly, Kurlat and Wacziarg2003). The effective number of parties was suggested in Andrews and Money (Reference Andrews and Money2009) as a factor that increases the dispersion of parties along a left-right continuum. It was calculated by the author based on the formula by Laakso and Taagepera (Reference Laakso and Taagepera1979) and data on electoral results and seats distribution from the ParlGov data set (Döring and Manow, Reference Döring and Manow2012).
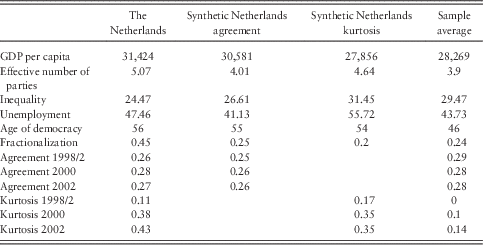
The synthetic control is built to approximate the means of GDP per capita, number of parties, and unemployment for the Netherlands between 1995 and 2001. For age of democracy and fractionalization it matches the absolute values for 2001. Regarding the path of the dependent variable, polarization, the optimization starts in 1997 and goes until 2002, meaning a total of 11 pre-treatment time points. However, for assessing fit, the root mean squared prediction error is calculated for the entire pre-treatment period starting in 1995, or 15 time points. Moreover, I match on the value of the dependent variable in three specific pre-intervention time points. This helps to create a synthetic control that best approaches the treated unit on polarization. Two synthetic controls are constructed, one for each measurement of the dependent variable. This is done because each of the measurements is intended to capture a distinct concept of polarization, and it is not expected that the two should, even ideally, give the same results. Descriptive statistics for the pre-treatment period for the Netherlands and the sample mean across these variables are in Table 1.
Description of synthetic Netherlands

Gross domestic product (GDP) per capita, effective number of parties, inequality, and long-term unemployment are averages for the 1995–2001 period. Age of democracy and fractionalization are the 2001 values. The last column reports an unweighed average of the 13 countries that compose the donor pool.
Synthetic control results
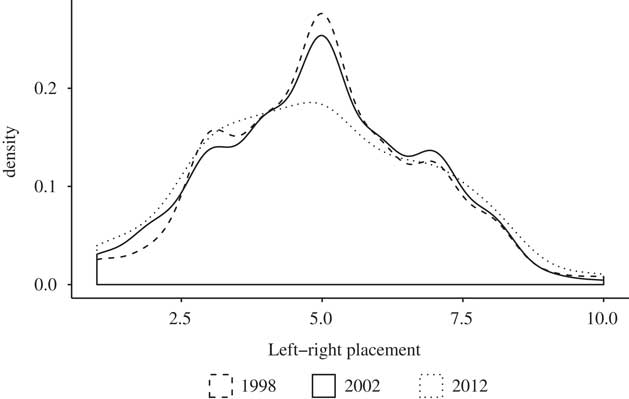
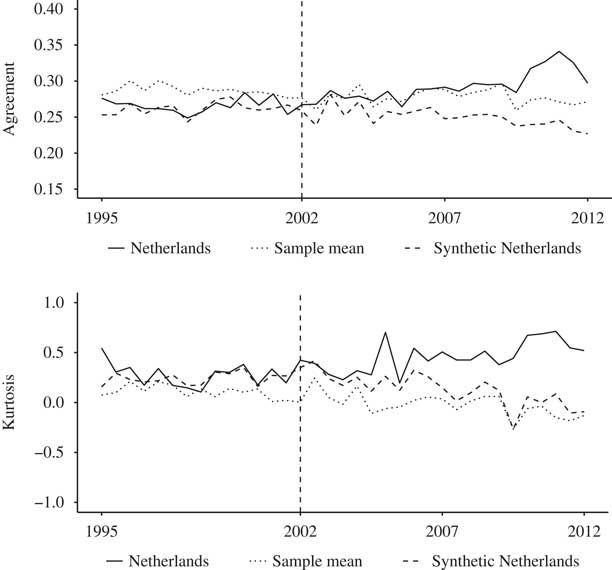
On absolute terms, public opinion in the Netherlands became more polarized between 2002 and 2012. This is shown in Figure 1. It has a density plot with the number of respondents in each category from 1 (left) to 10 (right) in Eurobarometer surveys in 1998, 2002, and 2012 (all 3 electoral years). We observe a sensitive drop of centrist respondents, who self-identified as 5 and 6 on the scale, between the surveys – they were 37.6% of the total in 2002, and 31.5% in 2012.Footnote 11 The share of those who reported to be on the extreme left (1 or 2), or the extreme right (9 or 10), on the other hand, increased between 2002 and 2012. In 2002, these composed 9.75% of respondents, going up to 12.07% in 2012 – an increase of nearly a quarter. This shift is captured by the two polarization measures used in this paper: the 2002 distribution has an agreement rate of 0.267 and kurtosis of −0.424. In 2012, agreement is 0.297 and kurtosis −0.52 (Noting that lower kurtosis means higher bimodality, while higher scores in agreement is higher polarization). Moreover, the solid lines in both panels of Figure 2 are the trends in polarization in the Netherlands for the period. Both indicate an upward movement in polarization with the two measurements. The ‘voiding of the middle’ observed on the density plot is captured by both indicators.
Ideological distribution in the Netherlands. Distribution of answers to a left-right self-placement question. Range from 1 – left to 10 – right. Eurobarometers 49.0 (1998), 57.0 (2002), and 77.2 (2012).

Polarization in the Netherlands, synthetic Netherlands, and sample mean.

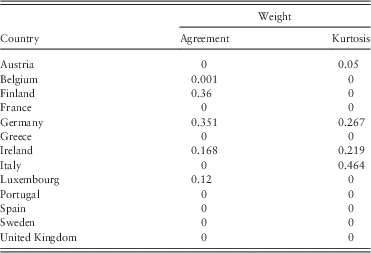
Table 2 shows country weights for making the synthetic Netherlands under both outcomes. For the first, we observe a combination of mostly Finland and Germany, accounting together for 0.71 of the weight, with Ireland and Luxembourg completing the case. With the second measure, Italy is the higher contributor, but Germany and Ireland are still in the picture, joined by Austria.
Country weights for synthetic Netherlands

Country weights assigned by the synthetic control method composing the synthetic Netherlands.
The two synthetic Netherlands produced have the characteristics described in Table 1. Numbers for the first four covariates are averages for the period 1995–2001, while age of democracy and fractionalization are the values in 2001. For agreement, the synthetic control gets closer than the sample average to the original Dutch statistics in GDP per capita, effective number of parties, inequality, and age of democracy, with no improvement when it comes to unemployment and fractionalization.Footnote 12 For kurtosis the numbers are worse: it better approaches the real Netherlands in the effective number of parties and age of democracy, but shows a distance larger than the sample average in the other covariates. A limitation when using SCM with relatively few units in the donor pool is exactly that it becomes harder to find good matches across a large number of covariates. Sensitivity checks are therefore performed to lend confidence to any results. Also, it becomes necessary to rely more on finding good matches for the Netherlands on the pre-2002 values of polarization, so that this trend is reproduced. In Figure 2, we see that in both panels lines for the Netherlands (solid) and its synthetic control (dashed) are close prior to 2002, indicating a good fit on the dependent variables. Moreover, we notice that polarization in the Netherlands was below the sample average (dotted) when measured as agreement, and above it when measured as kurtosis. It must be noted that in this and further graphs kurtosis values were multiplied by −1, so that higher values mean higher polarization and visualization is more intuitive.
Regarding treatment effects, we observe that, starting from 2002, the Netherlands was more polarized in both measures than its synthetic control in almost every year, in a gap that gradually increased. The widening happens at a faster pace especially after 2005, which may suggest a boost coming from the rise of Geert Wilders. In fact, when polarization is measured as agreement, the Netherlands not only saw an increase in relation to its synthetic control, but also crossed the sample average line: it was below for most time before 2002, and above for almost the whole period after. As kurtosis, it was always higher than the sample average, but the distance also increases after 2002 – taking a particular boost in 2006. The average treatment effect, or the average yearly post-2002 difference between the Netherlands and its synthetic controls, is 0.04 for the agreement measure, and 0.34 for kurtosis.
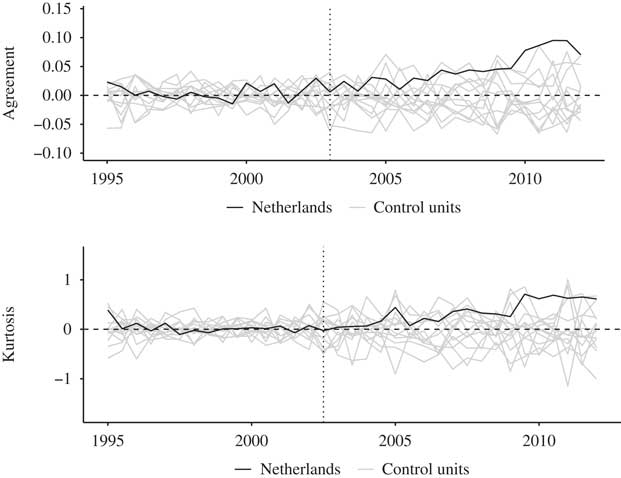
Figure 3 shows the results of placebo tests. While in Figure 2 the lines were the actual polarization trends (in the Netherlands, synthetic Netherlands, and sample), in this one lines are the difference between a country and its synthetic control. Therefore, points on the line above 0 mean that polarization is higher in the country than in its synthetic version, while points below 0 indicate higher polarization in the synthetic control. The black line refers to the Netherlands, while gray lines present the distance from each country in the donor pool – placebos – to their own synthetic controls. Gray lines’ post-treatment performance is what one should expect by random variation, under no treatment. The Netherlands is not necessarily the most distant unit from its synthetic control in every single year, but the placebo lines show much up- and downward variation, while the Dutch case is consistently higher. And, at the last time points, the Netherlands do show a gap to its synthetic control larger than the others.
Polarization gap in the Netherlands and 13 control countries.

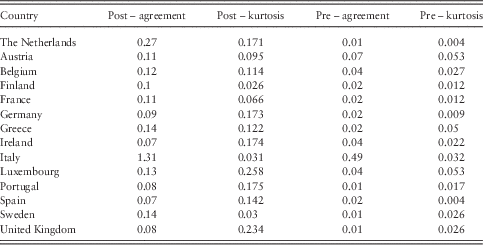
Table 3 presents a measure of these results. It contains the mean square prediction errors (MSPE) for the Netherlands and placebos in the periods before and after 2002. Larger MSPE’s indicate bigger distances between unit and synthetic control. Therefore, ideally one should observe low values in the pre-treatment period, indicating a good match, and high ones in the post-treatment, for a large treatment effect. Moreover, the lower the pre-treatment MSPE, the more confidence in post-treatment results. Both ‘post’ MSPE’s for the Netherlands are not the highest among the units: for agreement, it is lower than the Italian, while for kurtosis it only the sixth largest. However, all of these cases had also higher pre-MPSE than the Netherlands, meaning that part of the larger error from the pre-2002 period would carry on into the post-2002 numbers. Italy, in fact, shows a very high pre-2002 error for agreement, which indicates that there was no good synthetic control for it. Therefore, it is not very informative regarding how much post-treatment random variation we can expect.
Post- and pre-mean square prediction errors (MSPE) – the Netherlands and control units

Pre- and post-2002 MSPE values between each unit and their respective synthetic control.
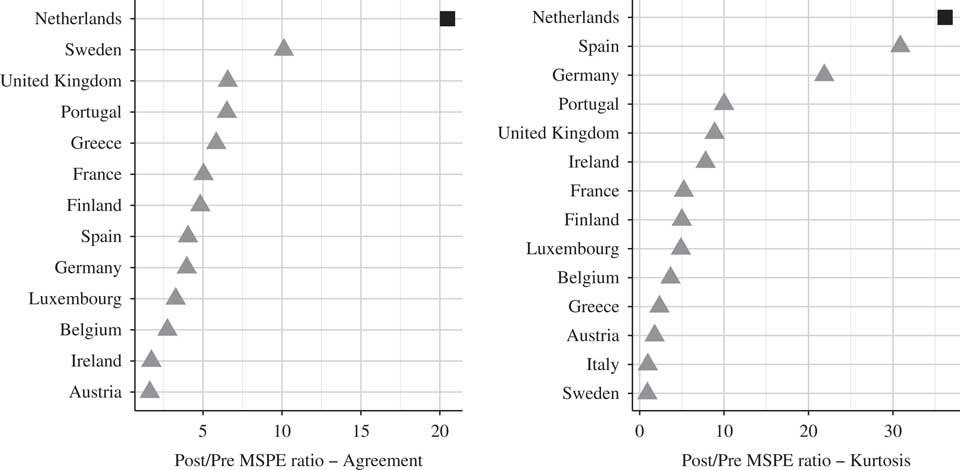
Figure 4 helps the interpretation by presenting the post-/pre-MSPE ratio (Abadie et al., 2015). This consists in dividing the post-treatment MSPE by the pre-treatment MSPE of each unit and their synthetic control. Higher ratios indicate a larger discrepancy between treated and control (high MSPE) after the event, and smaller difference (low MSPE) before the event. In this test, the Netherlands has the highest ratio of the sample in both measures of polarization. This strengthens the evidence of an actual effect being captured in the Dutch case.
Ratio of post-2002 mean squared prediction error (MSPE) to pre-2002 MSPE: the Netherlands and control countries.

Sensitivity tests
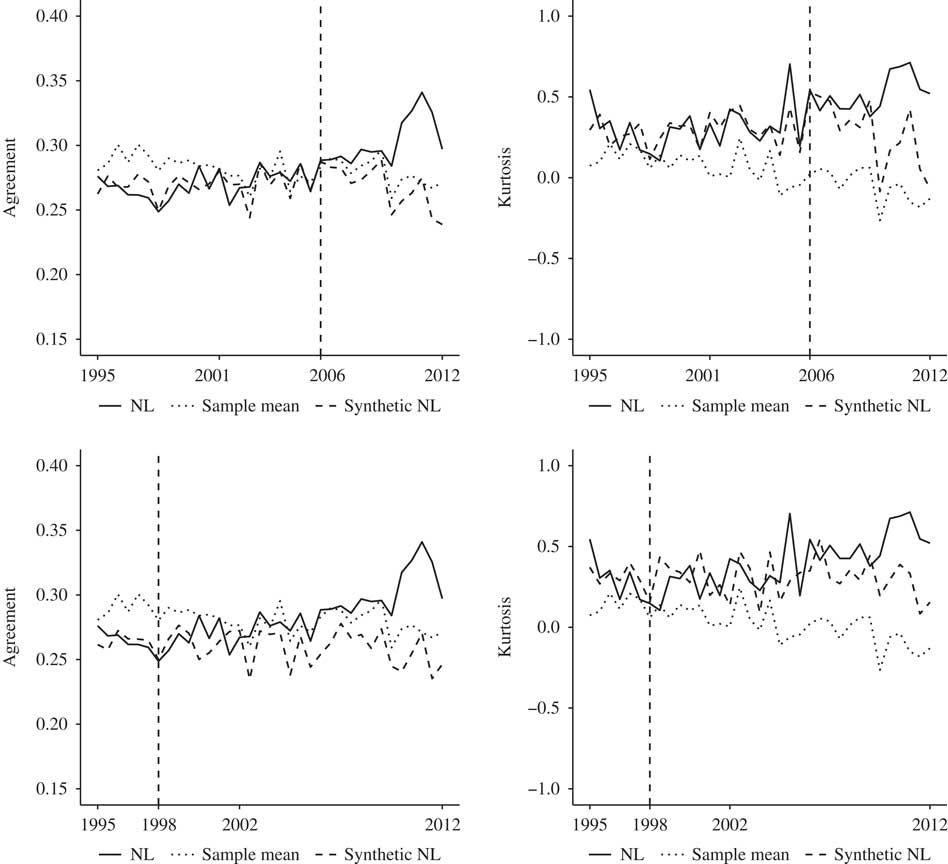
The first sensitivity test run is moving the intervention date. First it is set to 2006, the year when the PVV had its own electoral breakthrough. In Figure 2, that is when the gaps start to increase, and therefore it is necessary to verify if, moving the treatment date, they would still be there. Results are in the upper part of Figure 5. In it, the effect is small in the first observations right after the intervention, but the gaps once again gradually widen as the years pass. It might suggest that the effects of a PRRP rise might need some time before taking up speed.
Polarization in the Netherlands (NL) after 1998 and 2006, synthetic NL, and sample mean.

The second test moves the date in the opposite direction, and helps clarify the potential issue of endogeneity. In the lower part of Figure 5, the intervention date is set to 1998. If mass polarization started increasing before 2002, it would indicate that its increase precedes the rise of PRRPs, and might therefore be a cause of its success instead of consequence. However, no consistent difference between the Netherlands and a synthetic Netherlands are observed in either measure of polarization between 1998 and 2002, after which year the gap starts to increase in the agreement measure. This is in accordance with the interpretation of mass polarization being a consequence of the rise of the LPF, and not its cause.
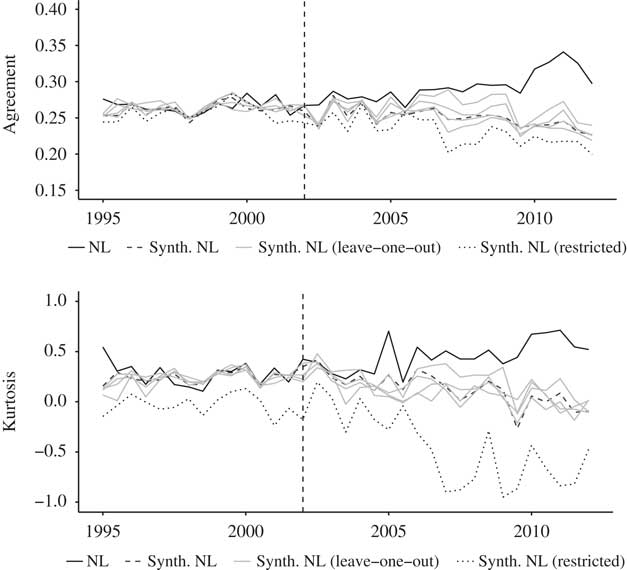
A second test checks how sensitive the findings might be to the construction of the donor pool. First, I reestimate the Dutch synthetic control with a leave-one-out procedure. In each iteration, one of the countries that received a positive weight in Table 2 is removed from the 13 that compose the donor pool, and a synthetic control constructed based on the 12 remaining ones.Footnote 13 While sacrificing fit, this procedure tests whether the results found are not caused by a single country in the donor pool that depolarized during the studied period. The results are in Figure 6. In all cases (gray lines indicating each synthetic Netherlands without one of the controls), polarization in the real Netherlands is still higher than in the synthetic one. The pre-2002 fit is not much worse in any of them, and post-2002 effects are all close to that of the original synthetic control.
Leave-one-out synthetic controls for the Netherlands (NL).

Figure 6 also includes another black line, dotted, which is a synthetic Netherlands constructed on a donor pool including only six countries: Germany, Ireland, Luxembourg, Portugal, Spain, and the United Kingdom. These are countries with no PRRPs (with more than a very small vote share, such as the British National Party or the National Democratic Party of Germany), and that form a restrictive donor pool. For the agreement measure, we observe that pre-2002 fit is a bit worse than observed with a full donor pool, as well as that from leave-one-out tests. This is expected, given the much smaller number of options from which to construct a synthetic Netherlands. Regardless, we observe a similar trend to that seen with the other cases: close pre-2002 lines, and a growing gap afterwards. In the kurtosis case, Dutch polarization is permanently higher than that of the other six countries, and therefore it is impossible, by definition, to find a weighed average from them to reproduce the pre-2002 Dutch path.
The discrepancy between the Netherlands and its synthetic controls on the covariates matched, shown in Table 1, suggests caution with interpreting the results as bullet-proof causal estimates. However, the fact that a gap between the Netherlands and synthetic controls remain after a number of sensitivity checks, and that it is higher than what would be expected by chance given the placebo tests, are evidence that there seems to be an effect taking place.
Discussion and conclusion
This paper begins with the question of whether the rise of PRRPs increased mass-level polarization in the Netherlands. After testing with a synthetic control model, there is indicative evidence that it did. First of all, polarization in 2012 was higher than in 2002 and 1998, as we observed more respondents who positioned themselves at the extremes of the ideological distribution, and fewer in the middle. Comparing the Netherlands to an unweighed average of the other 13 Western European countries shows polarization among the Dutch public increasing in relation to the rest during this time. Comparing to a counterfactual Netherlands with no PRRP rise, polarization was also consistently higher. This means that not only the Netherlands in 2012 was more polarized than in 2002, it was also more polarized than it would have been in 2012 if it were not for the emergence of the populist right a decade earlier.
The Dutch case is of importance in itself for two reasons. First, because elites in the Netherlands depolarized in a general left-right scale between the 1980s and 1990s (Adams et al., Reference Adams, De Vries and Leiter2012a), and polarized specifically on immigration issues during the 2000s (Oosterwaal and Torenvlied, Reference Oosterwaal and Torenvlied2010). While the first part was said to be followed by public depolarization in Adams et al. (Reference Adams, De Vries and Leiter2012a), Oosterwaal and Torenvlied (Reference Oosterwaal and Torenvlied2010) find that party polarization on immigration did not translate into mass polarization on the topic. As I have shown, polarization did happen when looking at a general left-right scale, instead of focusing on issues. The Dutch electorate has had an upward trend in polarization between 2002 and 2012 with a ‘voiding of the middle’. Moreover, that contrasts with a downward trend observed in the sample of other Western European democracies. Second, because the rise of a PRRP was so sudden in the Netherlands, it is more plausible to treat it as a structural transformation of the kind that the synthetic control model was designed to deal with. Moreover, the good pre-2002 fit of both synthetic Netherlands meet the assumptions of a SCM and lend confidence to the causal interpretation of the effects. While not a perfect exogenous shock, since no electoral event is, the LPF rise was quick, unexpected, and with long-lasting consequences for the Dutch party system.
A concern might be raised that the LPF emergence in itself indicates the presence of an inherent difference between the Netherlands and any of the cases in the donor pool, which had no PRRP rise at that moment. In consequence, this difference would not be captured by the synthetic control. One of the sensitivity tests addresses this issue: moving the treatment date to 1998. If the Netherlands had a polarizing potential prior to 2002, responsible for party-system polarization, it would have shown as a gap in that test. The Netherlands should have become, in the absence of a PRRP between 1998 and 2002, more polarized than its synthetic control. Given the results showing that it did not, the polarization observed after 2002 does seem to be the result of the LPF electoral success, or at least of something for which the LPF success was an excellent proxy.
While the Dutch case had some unique characteristics, the broad finding that the emergence of PRRPs may lead to higher mass polarization through increased elite polarization should be generalizable to other countries. The mechanism proposed in this link has nothing that is particular for the circumstances of the 2002–2003 Dutch electoral cycle and the shock that was the Pim Fortuyn phenomenon and assassination. However, in other countries the rise of PRRPs tends to be more gradual, and other methods would be necessary to uncover a causal dependency of one over the other. Further, in this analysis the gaps between the Netherlands and its synthetic control got larger over time, which is tentative evidence of a possible reinforcing effect: the rise of a PRRP leads to more polarization, that is conducive to the good performances of these parties, which might increase polarization even more. Further research is necessary to see if this feedback loop is indeed in place.
When it comes to the radical right literature, these findings cast some doubts on recent arguments that the rise of radical right parties has had virtually no impact on European polities and political systems (as in Mudde, Reference Mudde2013, Reference Mudde2014). The emergence of the populist radical right might have been a cause of an increase in polarization among the public in the Netherlands, with an effect far from negligible. While concerns about the radical right may be exaggerated sometimes, they are certainly not entirely unjustified.
Acknowledgments
The author thanks Alexis Diamond, Matthijs Bogaards, Levente Littvay, Zsolt Enyedi, Carsten Q. Schneider, and the five anonymous reviewers for great comments and suggestions. An earlier version of this paper was presented at the 10th Annual Doctoral Conference of the Doctoral School in Political Science, Public Policy, and International Relations from CEU in Budapest, 20–21 April 2015.