Implications
The ability to positively identify components in the diet of grazing animals via faecal analysis is the first step to enabling determination of the degree of competition between different grazers within any one environment. Ultimately, this information will enable livestock managers to make informed decisions regarding sustainable grazing management practices, including the control of native and feral animals that are competing with livestock for limited feed resources.
Introduction
The southern rangelands of Western Australia are a low-rainfall area covering 600 000 km2 of arid to semi-arid shrublands (Mitchell et al., Reference Mitchell, Wilcox and Laidlaw1994). The area experiences a dry climate with hot summers and cool winters. The average, annual rainfall is below 300 mm and usually falls in winter; however, this often varies dramatically from year to year especially with summer cyclones. Vegetation is dominated by native species, being a variable mix of annuals and perennials depending on location and seasonal conditions. Pastoral properties rely on the production of stock grazing the native vegetation in the rangelands. Economic success in the long term relies on the manager not degrading the vegetation base that supports production, but there are no established methods for easily identifying which plants are being grazed by stock (both domestic and native) in the rangelands. Kangaroo (red – Macropus rufus, and western grey – Macropus fuliginosus) numbers may be as high as four to five kangaroos per km2 (Southwell et al., Reference Southwell, Weaver and Osborn1991; Norbury et al., Reference Norbury, Norbury and Hacker1993), whereas sheep densities are in the range of 2 to 13 dry sheep equivalents (DSE) per km2 (Pringle et al., Reference Pringle, van Vreeswyk and Gilligan1994). Pastoralists consider these kangaroos as competitors of sheep, although disagreement exists within the scientific community with regards to the level of competition for feed between sheep and kangaroos. The greatest challenge to solving this debate is finding a non-invasive and effective means of determining the actual composition of the diets of these potential grazing competitors.
Determining the botanical composition of the diet of both sheep and kangaroos (and other macropods) has relied predominantly on field observation (Short, Reference Short1986), examination of stomach contents (Taylor, Reference Taylor1983; Dawson and Ellis, Reference Dawson and Ellis1996; Sprent and McArthur, Reference Sprent and McArthur2002) or epidermal tissue trace analyses of faecal material (Wann and Bell, Reference Wann and Bell1997; Holechek et al., Reference Holechek, Pieper and Herbel2004). All of these techniques are either invasive or time consuming and of little practical use in identifying the diet composition of animals grazing on the complex and (plant) species-rich rangeland ecosystems.
Another potential ‘marker’ for determining diet composition of herbivores is saturated hydrocarbons or alkanes, which are found in the cuticular wax of plants (Dove and Mayes, Reference Dove and Mayes2005). Determining diet composition from plant alkanes works best in a temperate, sown pasture containing a low number of different plant species. Furthermore, validations of the alkane method have mainly been confined to grasses or grass–legume associations (Valiente et al., Reference Valiente, Delgado, de Vega and and Guada2003). In the rangelands, browse may constitute a large proportion of the feed available to grazing animals and the validity of the alkane method for such plants has not been done. The use of alkanes is expensive and the procedure is difficult in heterogenous pastures (Lee and MacGregor, Reference Lee and MacGregor2004). Some of the issues associated with using these markers for determining diet composition include (i) alkanes can differ between stem, leaf and flower-head and seasons (Smith et al., Reference Smith, Mayes and Raats2001); (ii) alkanes may vary with the ages of some plants (Lee and MacGregor, Reference Lee and MacGregor2004); and (iii) errors in sampling and chemical analysis can yield negative answers (Newman et al., Reference Newman, Thompson, Penning and Mayes1995).
Molecular faecal analysis is a potential non-invasive alternative and the need for a greater level of discrimination has seen the recent increase in adoption of DNA-based technology, particularly PCR amplification. The exquisite sensitivity and specificity afforded by PCR are particularly useful under conditions where the target is present at low copy number and in a potentially non-permissive matrix (Saiki et al., Reference Saiki, Scharf, Faloona, Mullis, Horn, Erlich and Arnheim1985; Zhao et al., Reference Zhao, Yu, Miller, Chen, Bremer, Kabat and Yogev2002). Recently, faecal DNA amplification has been used for the evaluation of diets in sea lions (Deagle et al., Reference Deagle, Tollit, Jarman, Hindell, Trites and Gales2005) and of marine vertebrate predators (Jarman et al., Reference Jarman, Gales, Tierney, Gill and Elliot2002). In this study, faecal DNA was used as a means of determining dietary components of kangaroos grazing on the southern rangelands of Western Australia.
Material and methods
Study site
The field study was conducted between June 2006 and November 2007 on ‘Mendleyarri Station’ (121°40′E, 29°46′S), a large pastoral station in the southern rangelands of Western Australia. Mean annual rainfall is 249.6 mm and rainfall is highly variable. The area is dominated by native vegetation, consisting of variable mix of annual and perennial grasses and browse species. Sheep grazing was the primary land use.
The two paddocks chosen for this study were part of a larger study on diet selection in sheep and the impact of drought on such selection. The larger of the paddocks (10 200 ha) had not been grazed by sheep for more than 5 years, during which time plant species considered desirable for sheep grazing had become re-established in the land system. The second paddock (3700 ha) had been permanently stocked with Damara sheep for at least 3 years. Continuous overgrazing of this paddock had led to a general loss of desirable, palatable and perennial plant species.
In both paddocks, fixed dung collection sites (8.5 × 5.0 m) were installed at approximately 1 km intervals along a transect running east and west from the central water point. Four dung collection sites were installed in the unstocked paddock and seven in the stocked paddock. The sites were also part of a larger study (S. van Wyngaarden unpublished data) on the impact of distance from water on grazing pressure, with grazing density determined using the area of the collection site, the dry matter weight of faeces collection and the number of days over which the faeces accumulated.
Plant selection
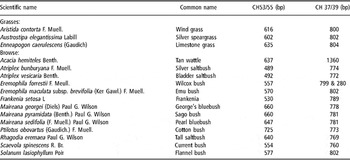
The plant species targeted for collection (Table 1) for DNA were known to be palatable to sheep based on pastoralists’ observations of sheep grazing, evidence of utilisation observed in the field and information reported in Mitchell et al. (Reference Mitchell, Wilcox and Laidlaw1994) and Russell and Fletcher (Reference Russell and Fletcher2003). Identification of the plant species was confirmed by Associate Professor Ben Norton (Curtin University of Technology) using the internet programme Flora Base (Western Australia Conservation and Land Management, 2008). Vouchers of the targeted plants have also been deposited with the Western Australian herbarium. Within 8 h of collection in the field, the samples were dried over 2 days at 60°C in a fan-forced oven, before being transported to the ChemCentre for subsequent analysis.
Rangeland plant species referenced in this study and their PCR amplification using primer pairs to the chloroplast genome

Faecal collection
Recent (retained, intact surface and some patina, therefore less than 2 days old) faecal samples were intermittently collected from the dung collection sites. Kangaroo faeces were readily distinguished from those of ruminants. Within 8 h of collection, the faecal samples were dried over 2 days at 60°C in a fan-forced oven, before being transported to the ChemCentre for subsequent analysis. A total of 63 samples were collected from the collection sites during the study period.
DNA analyses
The first requirement was the establishment of a DNA reference data bank for the selected plant species. DNA was isolated from the plants’ chloroplast and subjected to PCR amplification (as described below). DNA restriction site screening was then performed on respective PCR-amplified DNA to which the resultant restriction profiles were used to assign the reference plants. Using the same procedures, DNA was isolated from the faecal samples and PCR-amplified using the same primer pairs as used for the reference plant material.
Isolation of DNA
The dried faecal samples were individually milled, sieved through a 0.5 mm in a Retsch Model SK-100 (1100 W) cross-beater mill. Each sample was decanted into a plastic sample bottle, labelled and stored at room temperature until subsequently used for DNA analysis. To further minimise the risk of cross-over contamination, the entire mill was thoroughly cleaned in-between samples using compressed air and then wiped down with tissues.
Genomic DNA was isolated from milled faecal samples using the QIAGEN DNeasy Plant kit (QIAGEN, Hilden, Dusseldorf, Germany), with modifications. Each sample was analysed in triplicate. The 25 mg subsample was combined with 1.2 ml of Lysis buffer (Buffer AP1) and 12 μl RNase A stock solution (100 mg/ml). The mixture was incubated for 10 min at 65°C after which 390 μl of Buffer AP2 was added, mixed and the lysate placed on ice for 5 min. The lysate was centrifuged for 5 min at 20 000 × g and 560 μl from the supernatant was used for DNA isolation according to the manufacturer’s instructions, without alteration.
For the reference plants, dried leaves were placed in a plastic bag and manually ground into smaller fragments using a bottle as a rolling pin. The three 25 mg samples were taken for DNA isolation using the QIAGEN DNeasy Plant kit. A new bag was used for each reference plant. All genomic DNA were eluted to a final volume of 100 μl AE Buffer (QIAGEN) and stored at −20°C.
PCR amplification
DNA was screened for suitability for PCR by amplifying each isolate over a twofold serial dilution range. The best performing range of titres for each DNA preparation were those which produced a single and most intensely stained DNA band (DNA concentration ranging from 5 to 25 ng was optimal for PCR amplification), and these were used for subsequent studies. PCR amplifications were performed on 5.0 μl of DNA isolate in a final reaction volume of 20 μl containing 10 mM Tris-HCl, 1.5 mM MgCl2, 50 mM KCl (pH 8.3), 0.25 μM primers, 250 μM dNTPs and 0.75 U Kapa Taq DNA polymerase (Kapa Biosystems, Observatory, Cape Town, South Africa). The primer pairs used were CH 37/39 (trnL and rpl2m1) and CH 53/55 (trnL exons 1 and 2; see Table 2). DNA was denatured at 94°C for 2 min, followed by seven cycles of 94°C for 15 s (denaturation) and 72°C for 1 min (extension), in which the annealing temperature was touch downed in 1° decrements, from 65°C to 58°C. This was followed by 28 to 30 cycles of amplification in which the annealing temperature was held at 58°C and before a final extension of 72°C for 10 min. The presence of PCR-amplified products were confirmed by UV transillumination following horizontal gel electrophoresis on a 2% agarose (Bio-Rad, Hercules, CA, USA) and then accurately sized using the Agilent 2100 bioanalyzer (Agilent Technologies, Santa Clara, CA, USA) according to the manufacturer’s instructions.
Primer pairs used

F=forward primer; R=reverse primer.
Restriction enzyme analysis
Up to 10 μl of amplified DNA (250 to 500 ng) was digested with restriction enzymes (Roche Diagnostics, Indianapolis, IN, USA) in a final volume of 18 μl for 4 h at 37°C. A panel of 24 different restriction enzymes were used to generate restriction profiles from which DNA fingerprints diagnostic for each plant species were identified. The presence of restriction fragments was confirmed by UV transillumination following horizontal gel electrophoresis on 4% agarose MS (Roche Diagnostics), and the fragments were accurately sized using the Agilent 2100 bioanalyzer (Agilent Technologies) according to the manufacturer’s protocol.
Results
PCR amplification of target plant species
DNA fragments of varying sizes were obtained when the trnL intron was amplified in DNA isolates from a range of browse and grass species. The results of PCR amplification are summarised in Table 1. The limit of resolution appeared to be in the order of 5 bp as exemplified in Atriplex vesicaria and Atriplex bunburyana. It can be seen that the CH 53/55 primer pair was able to size-differentiate all of the species except for Maireana georgei and Maireana pyramidata, which both migrated at 660 bp. Amplification with the CH 37/39 primer pair produced monospecific amplicons, with the exception of Eremophila forrestii that presented a major band at 280 bp and a minor band at 799 bp. The largest recorded amplified product was Acacia hemiteles (1360 bp). Plant species that could not be differentiated with CH 37/39 were Solanum lasiophyllum, Eremophila maculata and Austrostipa elegantissima, which each presented a 802-bp PCR product and Maireana sedifolia and M. pyramidata, which both presented a 781-bp product. For these reasons, the CH 37/39 primer pair was not considered further. Overall, (plant) species prediction on the basis of PCR length heterogeneity alone was more successful with CH 53/55 than with the CH 37/39 primer pair.
Restriction enzyme analysis
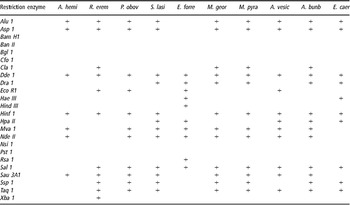
An array of DNA fragment length polymorphisms was generated by digestion with a panel of 24 restriction endonucleases, enabling the selection of DNA fingerprints, which were diagnostic for each plant species (data not shown). The restriction enzyme site profile of CH 53/55 amplified DNA on representative browse species are shown in Table 3. The presence of Mva 1 and Nde II restriction sites clearly distinguished A. hemiteles from Rhagodia eremaea. The Rsa 1 restriction sequence appeared to be unique only to E. forrestii. Two enzymes, Eco R1 and Ssp 1 could be used to differentiate between A. vesicaria and the closely related A. bunburyana. However, M. georgei and M. pyramidata could not be differentiated.
Restriction enzyme site profile of CH 53/55 amplified DNA of representative browse species from the southern rangelands of Western Australia

A. hemi = Acacia hemiteles; R. erem = Rhagodia eremaea; P. obov = Ptilotus obovartus; S. lasi = Solanum lasiophyllum; E. forre = Eremophila forrestii; M. geor = Maireana georgei; M. pyra = Maireana pyramidata; A. vesic = Atriplex vesicaria; A. bunb = Atriplex bunburyana; E. caer = Enneapogon caerulescens.
+ denotes presence of restriction enzyme site.
Diet composition as determined from PCR amplification of kangaroo faeces
DNA isolates from kangaroo faeces were extensively degraded. Nevertheless, the presence of high molecular weight fragments inferred their suitability for PCR amplification. Of the 63 faecal samples subjected to DNA analysis, seven were PCR negative. Five of the amplified ‘bands’ from the faecal samples did not conclusively match any of the reference plant species.
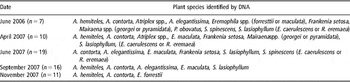
As shown in Table 4, of the plant species selected for this study, only M. sedifolia was not consumed at some stage by the kangaroos under study. Detectable differences in the molecular weights (expressed in bp) of A. bunburyana and A. vesicaria were possible with the plant samples; however, in the faecal samples, when compared against the reference plants’ DNA molecular weight ladder, it was not possible to clearly differentiate which Atriplex was being consumed. The same situation arose at times with differentiating between E. forrestii and E. maculata and also between Enneapogon caerulescens and R. eremaea in the faecal samples.
Plant species identified in the faeces of kangaroos collected from the four collection sites

Kangaroos consumed both grasses and browses throughout the study. Of the grasses, Aristida contorta consistently appeared in the faeces, and of the browse species S. lasiophyllum was also consistently consumed except for the late spring/early summer of 2007. The consumption of browses appeared to be greater (or more diverse) during autumn and winter compared to spring and early summer.
Discussion
DNA barcoding of rangeland plants
The aim of this investigation was to assess the effectiveness of molecular genetic techniques at discriminating between plant species collected from the southern rangelands of Western Australia and then using this same technology on faecal samples collected in the field to determine dietary components of kangaroos grazing on these rangelands.
The trnL non-coding chloroplast sequences of plant species were PCR amplifiable from DNA isolates from both plant and faecal samples. There was sufficient sequence divergence to enable a differentiation at the taxon level between the browse species, although with exceptions.
The critical issue has been the judicious selection of unique priming sequences that serve as markers specific for particular plant taxons. The chloroplast transfer RNA leucine (trnL) UAA gene intron is a non-coding region that possesses sufficient sequence variability enabling greater phylogenetic utility on plant species identification (Taberlet et al., Reference Taberlet, Gielly, Pautou and Bouvet1991; Gielly and Taberlet, Reference Gielly and Taberlet1994) and when combined with restriction enzyme digestion provides a further level of resolution at the genus/species level (Kojoma et al., Reference Kojoma, Kurihara, Yamada, Sekita, Satake and Iida2002; Ridgway et al., Reference Ridgway, Duck and Young2003). Compared to the CH 37/39 primer pair (Heinze, Reference Heinze2007), the CH 53/55 primer pair produced diagnostic bands of greater size variability that improved resolution for differentiation between the plant species.
Because there is the possibility that plant species other than those used here could be co-amplified, it prompted the adoption of validation by restriction enzyme site profiling. Generally, there was sufficient sequence divergence between the browse species to generate the required restriction fragment length polymorphisms. However, it was not possible to differentiate between M. georgei and M. pyramidata with the system used in this study. In this case, it appears that the trnL region did not possess the appropriate sequence polymorphism for differentiation. This could be resolved by screening other primer pairs that are accessible from current databases especially for those that are specific for the chloroplast genome (Heinze, Reference Heinze2007). Nevertheless, the presence or absence of particular plant species can be resolved by restriction enzyme digestion provided that ‘informative’ enzymes are used. It would seem from this model that, more than one primer pair would be required to correctly identify individual plant species.
The adoption of molecular techniques, for example, PCR amplification and restriction enzyme fragment profiling, further strengthens the evaluation process by enabling the accurate identification of forages species. A logical progression would be the extension of the current browse collection and discover other suitable primer pairs that enable species determination by PCR length heterogeneity.
PCR amplification of kangaroo faeces
The enormous heterogeneity of sequences presented by faecal DNA required the adoption of a priming system that excluded all except those of plant species origin. Furthermore, suitable markers were needed to accommodate the extensive degradation and sequence diversity expected in DNA isolates from faeces. A chloroplast-based PCR approach was chosen as photosynthesis is a vital survival mechanism in angiosperms; chloroplast DNA is more abundant than nuclear DNA (Timmins, Reference Timmins2003); and access to sequence information from Genbank or equivalent databases (Taberlet et al., Reference Taberlet, Gielly, Pautou and Bouvet1991; Gielly and Taberlet, Reference Gielly and Taberlet1994) increases the prospect of finding other suitable primers. Although priming domains chosen were reported to be highly conserved across plant taxa, the risk from using such primers is that non-target contaminants of plant origin could be amplified unintentionally. Prevention of such risks included the monitoring of PCR reagent blanks that are prepared under DNA-free conditions.
Specific sequences on the chloroplast genome can be PCR-amplified from a faecal DNA matrix, but at lower efficiency. That this constraint was also an effect from extremely low levels of homologous sequences was consistent with the spontaneous increase in intensity of PCR-amplified bands following spiking with plant DNA (data not shown). There are risks associated with amplification of low copy number sequences including the potential for compromising the process of plant residue identification. Therefore, we minimised such risks by adopting strategies that included: (i) monitoring carryover contamination with PCR reagent blanks; (ii) eliminating contamination from pipettors by using filtered tips; (iii) confirming identity of amplicons by size with reference to plant standards; [iv] optimising the number of amplification cycles to minimise non-specificity and to maximise sensitivity; (v) maintaining a high level of stringency by using the highest permissible annealing temperature; and (vi) using a touchdown programme to select for homologous sequences to those of the primers.
The ability to estimate relative proportions of plants in the diet would provide useful information on issues such as plant preference and palatability. Information on chloroplast content in each feed species (on the copies per cell basis) and other factors that contribute to ‘PCR bias’ are needed to standardise proceedings for quantification. In the context of this project, all PCR runs were performed to the endpoint to maximise amplification productivity, which is not quantitative. The risk of misrepresentation can be minimised by performing PCR amplification under ‘real-time’ conditions, which is the subject of a follow-up study.
Although species identification can be performed according to amplicon size alone, there is the possibility that plant species other than those used here could be represented by DNA bands on an agarose gel. This potential for misidentification prompted the adoption of another tier of validation in restriction endonuclease digestion. Moreover, there was sufficient sequence divergence to generate the required restriction fragment length polymorphisms. A set of restriction enzymes were identified that offered reliable identification of plants based on the presence or absence of cleavage sites. This library of genetic signatures simplified the species identification of plant residue, which is particularly advantageous for laboratories that do not yet have access to DNA sequencing or other equivalent resources.
Factors residing in the kangaroo faecal matrix could fortuitously co-purify with DNA and inhibit PCR amplification. It is worth exploring other PCR priming systems that are reported to amplify across highly polymorphic regions on the chloroplast genome (Taberlet et al., Reference Taberlet, Gielly, Pautou and Bouvet1991; Timmins, Reference Timmins2003). Species-specific primers to complement the ‘universal’ primers should also be considered. This could increase the likelihood of detecting (and validating) the presence or absence of adventitious levels of plant residue in faecal material. Also, a nested PCR or an equivalent system could be used to enhance the PCR signal.
The use of faecal DNA to determine components of the diet of kangaroos
Plant residue in faecal material can be detected by PCR amplification but the choice of primer pairs remains critical. The use of faecal DNA is still only in its developmental stage in terms of determining the composition of the diet of kangaroos. The technology has previously been used to determine components in the diets of sea lions (Deagle et al., Reference Deagle, Tollit, Jarman, Hindell, Trites and Gales2005) and brown bears (Murphy et al., Reference Murphy, Waits and Kendall2003). The diets of animals (and kangaroos) in which a variety of food is available are likely to be complex. Where a herbivore grazes a cultivated pasture, usually containing only a limited number of pasture species, the diet is relatively simple. The more the sources of DNA in any sample the greater the difficulty in isolating individual sources of DNA (Jarman et al., Reference Jarman, Gales, Tierney, Gill and Elliot2002).
In this study, seven samples were PCR negative and five samples each contained an amplified ‘plant’ band that could not be confidently identified. When DNA is of poor and low quantity, it can produce erroneous results (Morin et al., Reference Morin, Chambers, Boesch and Vigilant2001; Nsubuga et al., Reference Nsubuga, Robbins, Roeder, Morin, Boesch and Vigilant2004). Compared with plant material, the conditions for PCR amplification on faecal DNA are more technically demanding given the propensity for non-specific amplification. Spiking faecal DNA with plant reference DNA (data not presented) largely eliminated non-specificity, which substantiates the conclusion that low levels of target sequences is a contributing factor to diminished PCR response.
Diet selection based on faecal DNA analysis
Although kangaroos preferentially graze grasses (Taylor, Reference Taylor1983; Short, Reference Short1986; Dawson and Ellis, Reference Dawson and Ellis1996), they also consume a variety of shrubs and subshrubs (Short, Reference Short1986; Wann and Bell, Reference Wann and Bell1997), as was shown in this study. Of particular importance is that the plants selected for this study were those considered palatable to sheep, indicating that there would be direct competition between sheep and kangaroos for these particular forage species. Determining the extent of competition between sheep and kangaroos will require increasing the number of plant species DNA fingerprinted. Genetic analysis of faecal matter could potentially provide a quantitative estimate of diet composition rather than just qualitative information on the presence or absence from the diet if the amount of (faecal) DNA from each animal is proportional to the mass (of the particular plant) in the diet. Recent testing did provide a rough estimate of the proportion of the fish present in the meals fed to sea lions (Deagle et al., Reference Deagle, Tollit, Jarman, Hindell, Trites and Gales2005).
Despite the limitations of the technology, DNA fingerprinting has been a useful tool to assess diet selection by kangaroos in a rangelands environment. A logical progression would be the development of a system of quantification of plant species in the faecal matrix.
Acknowledgements
This study was made possible by funding provided by the Rural Industries Research and Development Corporation (Australia), ChemCentre and Curtin University of Technology. We thank Mr Michael Walker and Mrs Katarzyna van der Reest for their assistance in the DNA analytical work. Mrs Beverley Pratt is thanked for her assistance in the collection of plant and faecal material.