INTRODUCTION
Wheat is one of the most widely cultivated cereal crops of the world with an area of c. 217 million hectares and production of 653 million tonnes (FAO 2013). India is the second highest wheat producing country in the world. Wheat is the most important winter season crop in the country, occupying c. 0·50 of the total area under food crops and accounting for >0·70 of total grain production each season. It is grown mostly in the Indo-Gangetic Plains and central parts of India. Since the Green Revolution in the early 1960s the country has witnessed a phenomenal increase in productivity of wheat, but in recent years this has plateaued. Among the various climate factors affecting agriculture, temperature is the most important factor, as high temperature affects the growth and yield of many crops (Kurek et al. Reference Kurek, Chang, Bertain, Madrigal, Liu, Lassner and Zhu2007). High temperature stress is an important yield-limiting factor in both spring and winter wheat (Triticum aestivum L.) in most of the wheat growing areas of the world (Prasad et al. Reference Prasad, Pisipati, Ristic, Bukovnik and Fritz2008). The role of heat stress in limiting the productivity of wheat in India was first highlighted by Howard (Reference Howard1924) in his statement ‘Wheat growing in India is a gamble in temperature’. Moreover, trends of increasing temperature during the growing season have already been reported for major wheat producing regions of the world (Gaffen & Ross Reference Gaffen and Ross1998; Alexander et al. Reference Alexander, Zhang, Peterson, Caesar, Gleason, Tank, Haylock, Collins, Trewin, Rahimzadeh, Tagipour, Rupa Kumar, Revadekar, Griffiths, Vincent, Stephenson, Burn, Aguilar, Brunet, Taylor, New, Zhai, Rusticucci and Vazquez-Aguirre2006). In India, studies have also shown a trend for increasing air temperature during the last century (Rupa Kumar et al. Reference Rupa Kumar, Krishna and Pant1994; Singh & Sontakke Reference Singh and Sontakke2002).
A survey covering 19 developing countries including major wheat-growing countries concluded that heat stress is one of the most important constraints for wheat production, affecting c. 0·57 of the wheat area in the surveyed countries (Kosina et al. Reference Kosina, Reynolds, Dixon and Joshi2007). According to Joshi et al. (Reference Joshi, Mishra, Chatrath, Ortiz Ferrara and Singh2007), c. 13·5 million ha of wheat area in India experiences heat stress. In view of trends towards increased temperature and its adverse effects on wheat yield, it is necessary to provide insurance coverage for high temperature risk in wheat, as an adaptation strategy to climate change. The weather-index-based crop insurance in wheat, which is slowly replacing conventional crop insurance, requires an understanding of the relationship between yield and temperature.
The effect of higher temperature on yield of wheat has been studied extensively using three approaches (i) the traditional approach of historical data analysis, (ii) controlled environment studies and (iii) crop growth simulation models. Though there were a larger number of studies conducted under controlled environments or heat stress imposed through artificial means (Fischer & Maurer Reference Fischer and Maurer1976; Wardlaw et al. Reference Wardlaw, Dawson, Munibi and Fewster1989; Tashiro & Wardlaw Reference Tashiro and Wardlaw1990; Wheeler et al. Reference Wheeler, Batts, Ellis, Hadley and Morrison1996; Batts et al. Reference Batts, Morison, Ellis, Hadley and Wheeler1997; Ferris et al. Reference Ferris, Ellis, Wheeler and Hadley1998; Gibson & Paulsen Reference Gibson and Paulsen1999; Prasad et al. Reference Prasad, Pisipati, Ristic, Bukovnik and Fritz2008; Rahman et al. Reference Rahman, Chikushi, Yoshida and Karim2009; Talukder et al. Reference Talukder, Gill, McDonald, Hayman, Alexander, Dove and Culvenor2010; Zacharias et al. Reference Zacharias, Singh, Kumar, Harit and Aggarwal2010), the effect of increased temperature on wheat yield under controlled environment conditions cannot be extrapolated to a field situation due to limited soil volume available for root exploration and restricted solar radiation, evaporative demand and air movement. Alternatively, the impact of temperature on wheat yield can be assessed through imposition of different planting dates (Ortiz-Monasterio et al. Reference Ortiz-Monasterio, Dhillon and Fischer1994; Nahar et al. Reference Nahar, Ahamed and Fujita2010; Ottman et al. Reference Ottman, Kimball, White and Wall2012) and through long-term yield and weather regressions (Chmielewski & Potts Reference Chmielewski and Potts1995; McCaig Reference McCaig1997; Landau et al. Reference Landau, Mitchell, Barnett, Colls, Craigon, Moore and Payne1998; Lobell et al. Reference Lobell, Ortiz-Monasterio, Asner, Matson, Naylor and Falcon2005). Different planting dates during a year exposes the crop to different temperatures during its growing season, allowing an understanding of crop responses to temperature without the artificial conditions imposed by controlled environments. Crop responses to temperature vary with variety and phenological stage of the crop (Shpiler & Blum Reference Shpiler and Blum1986). Phenological stages and yield of wheat also differ in their sensitivity to minimum and maximum temperatures (Lobell & Ortiz-Monasterio Reference Lobell and Ortiz-Monasterio2007). There is a need to understand the effect of maximum and minimum temperature (separately) during all the phenological stages on the yield of different wheat cultivars. Cardinal temperatures (minimum, optimum and maximum) have been worked out for various plant processes and phenological phases in wheat (Porter & Gawith Reference Porter and Gawith1999) and for optimum yield during some of these phenological stages (Farooq et al. Reference Farooq, Bramley, Palta and Siddique2011). However, temperature thresholds in each phenological stage for obtaining above average, average and below average yield of wheat have rarely been reported in the literature.
The information on thresholds of weather parameters for optimum yield of crops and the rate of decrease of yield with increase or decrease of relevant weather parameters or their indices are essential components in weather-index-based crop insurance. Keeping the requirement of weather-based wheat insurance products in view, an attempt has been made in the present study (i) to identify temperature sensitive critical phenological stages in wheat, (ii) to quantify the response of wheat varieties to increase in temperature during critical phenological stages and (iii) to identify threshold temperatures (maximum and minimum) during each of the phenological stages for obtaining above average, average and below average yield responses.
MATERIALS AND METHODS
Experimental site
The Kanpur Centre of the All India Coordinated Research Project on Agrometeorology (26°26′N, 80°22′E and 126 m a.s.l.), whose experimental data was analysed for preparing the manuscript, is located in the Indo-Gangetic Plains of Uttar Pradesh, India. The soil of the experimental site was sandy loam in texture with a deeper profile (>100 m deep). The annual precipitation of the area is 869 mm and mean temperature of hottest and coldest months are 39 °C (May) and 7·4 °C (January), respectively.
Details of experiment
As per the mandate of the All India Coordinated Research Project on Agrometeorology (AICRPAM), the Kanpur Centre of AICRPAM conducted research on crop–weather relationships in wheat from 1996 to 2006. In every year of the study period, three cultivars of wheat were sown on three different dates to expose the cultivars to different sets of weather conditions. The field experiment was laid out in a split-plot design with four replications: main-plot treatments were the three sowing dates (first, second and third) while the three cultivars (HD-2285, K-8804 and K-9107) were the sub-plots. The actual date of sowing varied from 15 November to 2 December, 30 November to 23 December and 15 December to 12 January, respectively, for each of the three sowing dates during the 11-year study. The cultivars HD-2285, K-8804 and K-9107, respectively, were early, medium and late maturing types. The crop was raised under irrigated conditions by applying fertilizer (nitrogen (N)–phosphorus (P)–potassium (K) at 120–60–60 kg/ha) to ensure unlimited nutrient and water supply. All P and K and a half dose of N were applied at sowing as basal dose. The remaining half N dose was top dressed in two splits at crown root initiation (growth stage (GS) 14) and tillering (GS 21) stages (Zadoks et al. Reference Zadoks, Chang and Konzak1974). The crop was kept weed- and pest-free throughout the growing season. To protect the crop against fungal diseases, Dithane M-45 at 1·5–2 kg/ha was sprayed at tillering and jointing stages (GS 21 and 31, respectively). No insect pests occurred and no pesticides were applied to the crop during the study period. Weeds were controlled by weeding manually two or three times during the season, in addition to the application of 2, 4-D sodium salt at crown root initiation (CRI, GS 14) and GS 31 for control of broad-leaved weeds. The individual plot size of the 36 experimental plots was 6 × 3 m2 with row spacing of 22·5 cm.
Crop and weather data
The data on all important weather parameters were recorded at a meteorological observatory located 2 m north-west of the experimental site. For the current work, daily maximum and minimum temperatures from the date of sowing to date of harvest in all the years of experimentation were used. Dates of occurrence of eight important phenological stages viz. emergence (GS 5), crown root initiation (CRI, GS 14), tillering (GS 21), jointing (GS 31), anthesis (GS 60), milk (GS 73), dough (GS 83) and maturity (GS 91) stages recorded in each crop variety under all the three dates of sowing over all the 11 years were utilized. A brief description of these phenological stages is provided in Herbek & Lee (Reference Herbek, Lee, Lee, Herbeck, Bruening, Green, Grove, Martin, Murdock, Schwab, Van Sanford, Hershman, Johnson, Townsend, McNeill, Montross, Overhults and Trimble2009). Yield was harvested from net plot area of 5 × 2·2 m2 for plot. The grain yield was expressed at 12–14% moisture content.
Statistical methods
In order to understand the relationship between yield and phenological stage-wise temperature, both simple linear regression models and second degree polynomial models were used. For this purpose, daily maximum and minimum temperatures during each of the phenological stages were averaged for all three cultivars in all the dates of sowing and years of experimentation. These models fitted between yield of each cultivar and temperatures averaged over different phenological stages were also used for identifying critical phenological stages and quantifying the effect of temperature on yield. The models fitted in the study assumed that any positive correlation among observations in the same year is accounted for by the regressor variables, so that a random year main effect is not needed. Significance of the relations was assessed through F-test and t-test values.
In each cultivar, three critical values of yield viz. above average (M + σ), average (M) and below average (M – σ) were worked out using 11 years × 3 sowing dates data. These three categories or critical values of yield were substituted in the linear and polynomial regression models to work out the temperature (maximum or minimum) required for obtaining respective critical yield values in each cultivar. For this exercise, only statistically significant regression models (P < 0·05) were used. Between the significant linear and polynomial regression models, the model with comparatively better fit (higher adjusted R 2) was preferred to compute the temperature requirement at each phenological stage of the cultivars. All statistical tests were performed using statistical software SAS, version 9.2.
RESULTS
Weather conditions
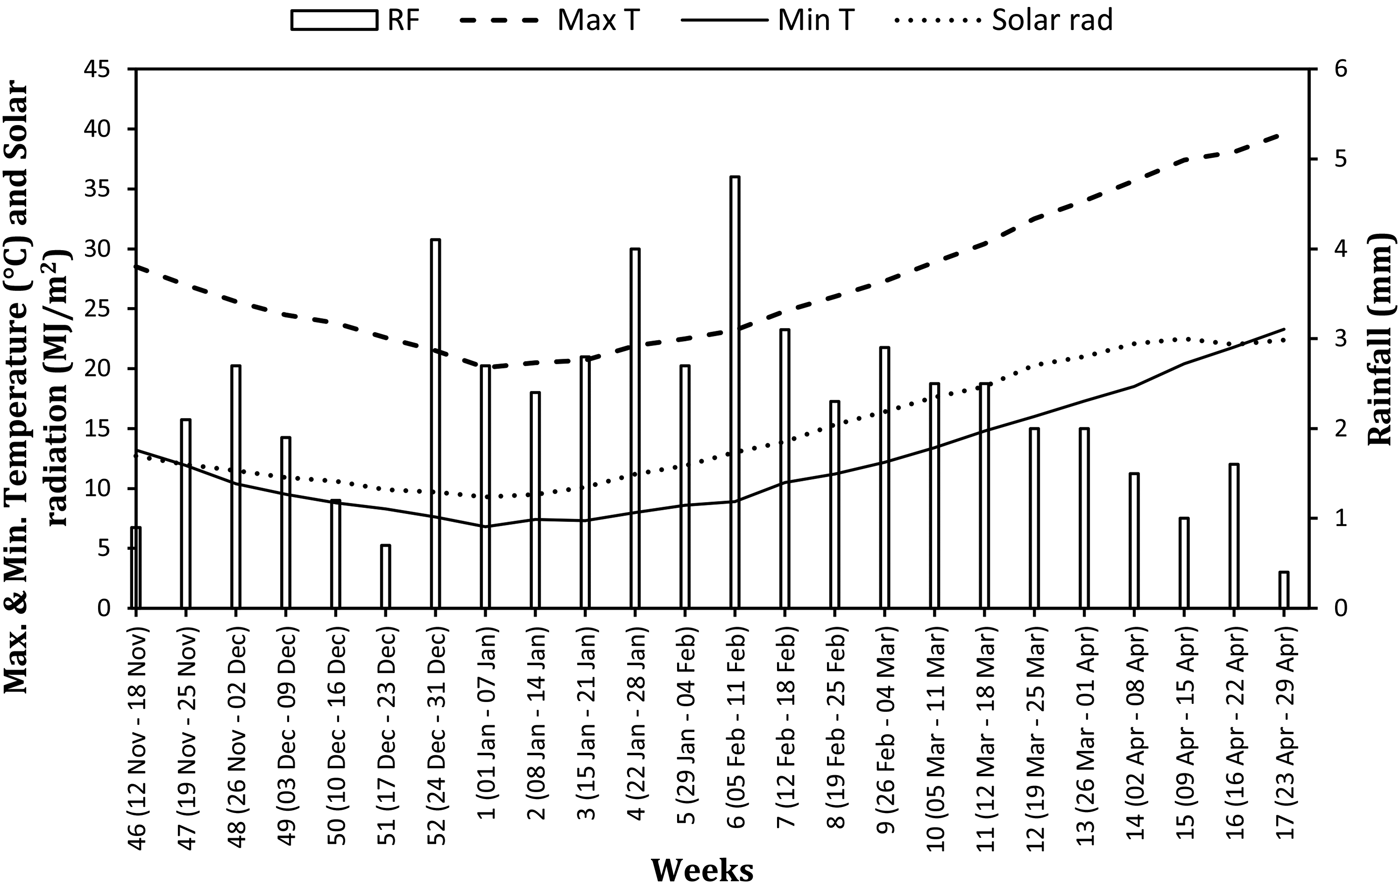
Weekly average maximum and minimum temperature, solar radiation and weekly accumulated rainfall during the growing season of wheat, i.e., from 12 November to 29 April (Fig. 1) showed that both maximum and minimum temperatures gradually decreased week after week from the 46th week (12–18 November) to reach the lowest value (20·1 and 6·8 °C) in the 1st week of the next calendar year (1–7 January). Both minimum and maximum temperatures increased with each passing week to reach their highest value (39·6 and 23·3 °C) in the 17th week (23–29 April). Average accumulated rainfall never exceeded 5 mm in any of the weeks during the growing season. Solar radiation also followed the same trend as maximum and minimum temperature, but it started to decline after the 14th week (2–8 April).
Weekly average weather parameters during wheat growing season at Kanpur (1971–2010) [Data source: Databank of All India Coordinated Research Project on Agrometeorology (AICRPAM), Central Research Institute for Dryland Agriculture].

Identification of critical phenological stages
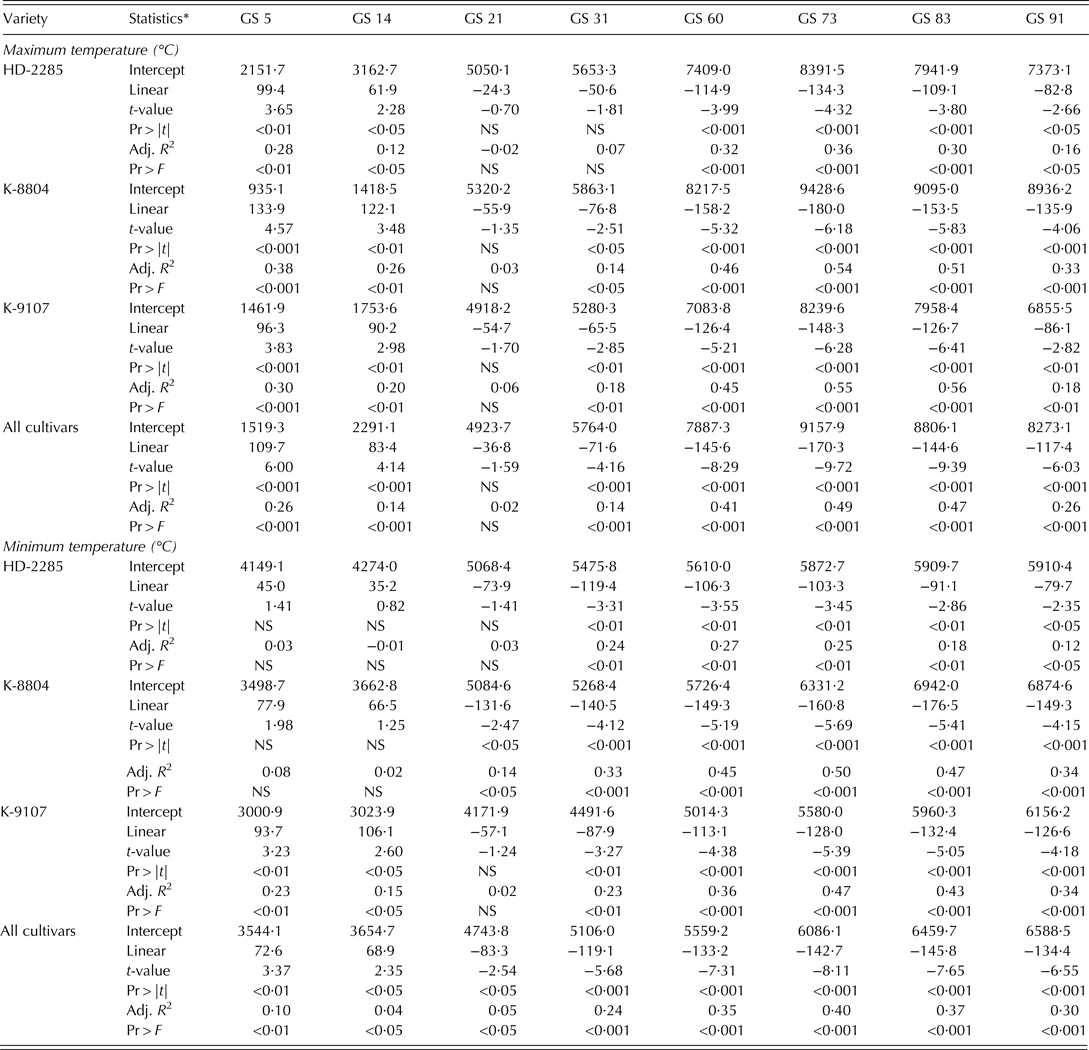
To identify the most temperature-sensitive phenological stages influencing yield of wheat, linear regression models between the yield of three cultivars viz. HD-2285, K-8804 and K-9107 over three dates of sowing and 11 years of experimentation and phenological stage-wise averages of maximum and minimum temperatures were fitted. Linear regression models of yield with temperature (maximum and minimum temperatures, separately) during all the eight phenological stages showed that maximum and minimum temperature during all the stages from GS 31–91 significantly (P < 0·05 and P < 0·01) and adversely influenced the grain yield of all three cultivars of wheat (except the maximum temperature at GS 31 of HD-2285) (Table 1). The significance of the adverse effect of maximum temperature on yield of cultivars HD-2285 and K-8804 (based on probability values associated with t statistics) was highest during GS 73, while that of K-9107 was highest during GS 83. The highest significant negative effect of minimum temperature was observed during GS 73 in K-8804 and K-9107 and during GS 60 in HD-2285. Therefore, because of its sensitivity to the maximum or minimum temperature in all the cultivars, GS 73 was identified as the critical stage for thermal stress. The model between yield and maximum or minimum temperature identified GS 83 and GS 60 as second and third most critical stages. The yield and thermal conditions, pooled over all three cultivars, also showed GS 73 to be the most sensitive phenological stage for both maximum and minimum temperature stress with absolute t-values (P-levels) 9·72 (P < 0·001) and 8·11 (P < 0·001), respectively, closely followed by GS 83 and GS 60.
Simple linear regression models for wheat yield using maximum and minimum temperature at different phenological stages of three cultivars
* Includes regression coefficients, their significance and model's fit (Adj. R 2); NS, not significant (P > 0·05).
Note: Pr > |t| and Pr > F are referred to as P-levels and linear is referred to as slope in the text.
One interesting observation from the present study was that both maximum and minimum temperature had positive impacts on the yield of all three cultivars in the initial phases of crop growth (GS 5 and GS 14); the positive effect started to decline at later phenological stages and turned negative from GS 21 onwards. The negative influence of both maximum and minimum temperature on yield, which was insignificant or less significant at GS 21, gradually gained strength and significance with each successive phenological stage to reach a peak at GS 73 in HD-2285 and K-8804 for maximum temperature and in K-8804 and K-9107 for minimum temperature and became less significant during the last stage, i.e., GS 91. The significance of positive effect of maximum temperature on yield during GS 5 and GS 14 was found to be higher than that of minimum temperature during the corresponding stages. However, the significance of negative effect of minimum temperature during GS 31 on yield was much higher than the effect of maximum temperature in all the cultivars. During stages GS 60 to GS 83, maximum temperature had a higher significant negative influence on yield than minimum temperature in all the three cultivars.
Differences were observed in the responses (both positive and negative) of different wheat cultivars to maximum and minimum temperatures during different phenological stages. Among the three cultivars, HD-2285 was less sensitive to both maximum and minimum temperature, as revealed by lower t-values (absolute) and higher P-levels in the models between its yield and temperature during most stages compared to those of other cultivars. Among the cultivars, K-8804 was found to be most sensitive to increase in minimum temperature during all the stages from GS 21–91, as t-values (absolute) were higher and P-levels lower in the models between yield and minimum temperature during all these stages than the other two cultivars. The significance of positive influence of maximum temperature during the initial growth stages, GS 5 and GS 14, on yield was also highest in K-8804 than the other two cultivars. The sensitivity of K-9107 was intermediate, with the highest significance of negative relationship of its yield with maximum temperature during GS 73 and GS 83 (t-value (absolute) = 6·28 and 6·41 in GS 73 and GS 83 and P < 0·001 in each stage).
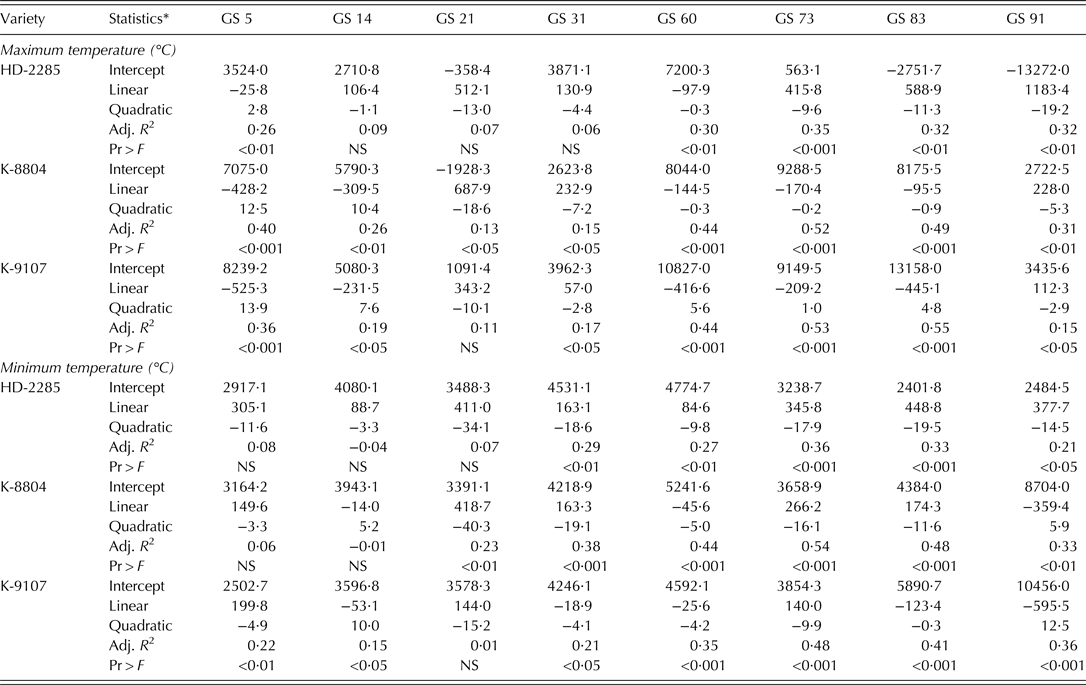
A second degree polynomial model to identify non-linearity in the response of yield to maximum or minimum temperature at different phenological stages of the three cultivars (Table 2) revealed that the polynomial models were found to have comparatively better fit than linear models at GS 21 stage (adjusted R 2 values of the quadratic equations were found to be higher than that of the linear models at GS 21) in all the cultivars. The quadratic equation at GS 21, however, was significant in K-8804 for both maximum and minimum temperature. At GS 5, the quadratic equation showed better fit for maximum temperature than the linear model in K-8804 and K-9107. Among the models involving maximum temperature at different post-anthesis stages, the quadratic relationship of yield with maximum temperature at GS 91 had higher adjusted R 2 (0·32) than that of the linear relationship (Adj. R 2 = 0·16) in HD-2285 only. The quadratic relationships of yield with minimum temperature showed better fit than linear relationships at most of the stages in HD-2285 (higher adjusted R 2). The yield and minimum temperature relationships at most of the phenological stages were linear in nature rather than quadratic in K-9107 (adjusted R 2 values being higher for linear models than quadratic models). For minimum temperature, fit of polynomial models was better than linear models at GS 73 to GS 91 in HD-2285 and GS 31 and GS 73 in K-8804.
Second degree polynomial models for wheat yield using maximum and minimum temperature at different phenological stages of three cultivars
* Includes regression coefficients and model's fit (Adj. R 2); NS, not significant (P > 0·05).
Note: Pr > F is referred to as P-level in the text.
Quantification of thermal stress on wheat yield
The slope of the linear regression models relating grain yield of cultivars HD-2285, K-8804 and K-9107 with maximum and minimum temperature during GS 73 (Table 1) revealed that the rate of yield reduction with unit increase in maximum temperature was higher (134·3–180·0 kg/ha) than the rate of reduction with increase in minimum temperature (103·3–160·8 kg/ha) in all the three cultivars.
The cultivar HD-2285 was observed to be least sensitive to thermal stress, with marginal yield reduction per unit increase in maximum and minimum temperature during GS 73 (134·3 and 103·3 kg/ha, respectively). The impact of thermal stress on K-9107 was intermediate, with yield reductions of 148·3 and 128·0 kg/ha, respectively, per unit increase in maximum and minimum temperature. Among the three cultivars, K-8804 was the most sensitive to temperature stress, with reduction in yield of 180·0 and 160·8 kg/ha per 1 °C increase in maximum and minimum temperatures, respectively.
Temperature thresholds for yield
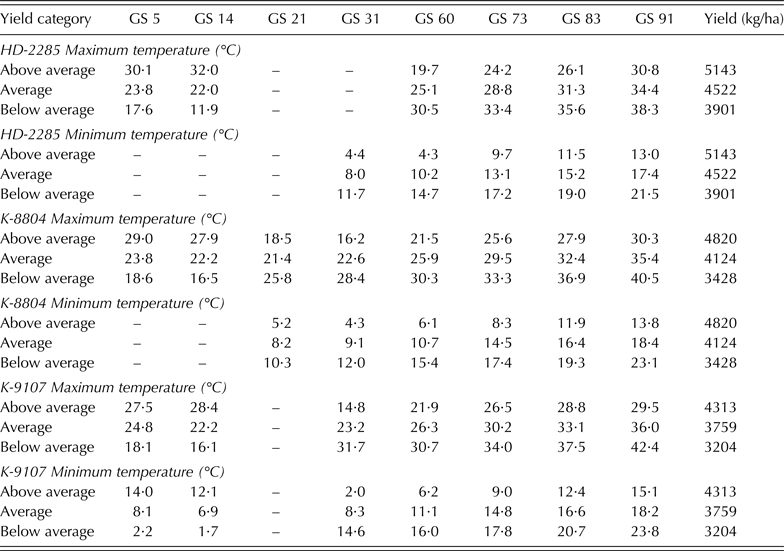
The yield under each of the three categories or critical values of yield, viz. above average, average and below average, along with the corresponding phenological stage-wise maximum and minimum temperature (obtained by solving the regression equations) in respect of all three cultivars (Table 3) showed that, in all three cultivars, the highest average yields were recorded when average maximum and minimum temperatures during GS 60–91 were lower, and vice versa.
Temperatures (°C) during different phenological stages of three wheat cultivars for obtaining three different categories of yield
These temperatures at different phenological stages served as thresholds in respective phenological stages for obtaining above average, average and below average yield in each cultivar. Decline in yield from one category to another, starting from above average (maximum) to below average (minimum) was observed to be in proportion to the increase in average maximum and minimum temperature during the anthesis to dough stages. These stages of all three cultivars in case of below average yield experienced nearly 8–13 °C increase in maximum and 7–11 °C increase in minimum temperature than the temperature (maximum or minimum) for obtaining above average yield. The reduction in below average yield compared to above average yield was 1242, 1109 and 1572 kg/ha (i.e., 24·1, 25·7 and 32·6%) in cultivars HD-2285, K-9107 and K-8804, respectively. Since it showed the highest percentage of yield loss, K-8804 was identified among these three cultivars as the one most sensitive to heat stress. Yield reductions in below average yield as well as average yield categories compared to above average yield category were also observed to be in association with maximum and minimum temperatures experienced during all the phenological stages from GS 60–91. The highest yield achieved by HD-2285 and the lowest by K-9107 in both average and above average yield categories were inferred due to the lowest maximum as well as minimum temperature experienced in most of the cases during GS 60–91 in HD-2285 and the highest temperatures during these stages in K-9107. The variety K-8804 achieved intermediate yield in both average and above average categories due to intermediate temperatures (both maximum and minimum) during GS 60–91. Also, in below average category, HD-2285 was able to maintain its superior yield achieving ability better than the other cultivars, due to the prevalence of comparatively lower maximum and minimum temperatures during most of the post-anthesis phenological stages than in other cultivars. The maximum temperatures in the range of 19·7–21·9, 24·2–26·5, 26·1–28·8 and 29·5–30·8 °C during GS 60, GS 73, GS 83 and GS 91, respectively, were found to be optimum for achieving above average yield across all three cultivars. Likewise, minimum temperatures in the range of 4·3–6·2, 8·3–9·7, 11·5–12·4 and 13·0–15·1 °C during GS 60, GS 73, GS 83 and GS 91, respectively, were found to be optimum conditions for achieving above average yield across the cultivars.
DISCUSSION
Identification of critical phenological stages
Although high temperature is a major limiting factor for wheat yield, the vulnerability of the crop and its cultivars to high temperature varies with the stage of plant development (Wahid et al. Reference Wahid, Gelani, Ashraf and Foolad2007; Nahar et al. Reference Nahar, Ahamed and Fujita2010). Understanding the effect of high temperature on crop productivity across various phenological stages will help in identifying critical phenological stages for focus-oriented impact assessment and adaptation. Plant responses to high temperature vary not only with phenological stages, but also with crop cultivar (Wardlaw & Moncur Reference Wardlaw and Moncur1995; Rahman et al. Reference Rahman, Chikushi, Yoshida and Karim2009). In the present study, variations in the responses of wheat to temperature stress during different phenological stages and cultivars were observed.
The highly significant adverse relationship of maximum and minimum temperatures during GS 31–91 on yield partly agreed with previously reported higher adverse influence of temperature on yield during the reproductive period than during the vegetative period (Stone & Nicolas Reference Stone and Nicolas1995; Wheeler et al. Reference Wheeler, Batts, Ellis, Hadley and Morrison1996; Gibson & Paulsen Reference Gibson and Paulsen1999; Wollenweber et al. Reference Wollenweber, Porter and Schellberg2003). Heat stress during the reproductive period can cause pollen sterility, lower carbon dioxide (CO2) assimilation and increased photorespiration resulting in yield loss. The identification of GS 73 as the most temperature-sensitive phenological stage, followed by GS 83 and GS 60, is similar to earlier research findings (McDonald et al. Reference McDonald, Sutton and Ellison1983; Stone & Nicolas Reference Stone and Nicolas1994; Rahman et al. Reference Rahman, Chikushi, Yoshida and Karim2009) in which heat stress at grain filling (comprising GS 73 and GS 83) was reported to be the key factor affecting yield and yield components under controlled environment experiments. Reduced grain yield due to heat stress during grain filling has been reported due to reductions in both duration and rate of grain filling (Wardlaw et al. Reference Wardlaw, Sofield and Cartwright1980). Heat stress during grain filling affects mainly the availability of assimilates and their translocation to the grain, resulting in lower grain yield (Farooq et al. Reference Farooq, Bramley, Palta and Siddique2011). Contrary to earlier reported results of a stronger adverse impact of minimum temperature on yield than maximum temperature (Lobell et al. Reference Lobell, Ortiz-Monasterio, Asner, Matson, Naylor and Falcon2005; Lobell & Ortiz-Monasterio Reference Lobell and Ortiz-Monasterio2007; Prasad et al. Reference Prasad, Pisipati, Ristic, Bukovnik and Fritz2008), the present study found that the negative impact of maximum temperature was more significant than minimum temperature during GS 60–83 in all three cultivars. The comparatively stronger relationship of maximum temperature than minimum temperature on yield observed was similar to the results reported for wheat in Turkey (Tonkaz et al. Reference Tonkaz, Dogan and Kocyigit2010).
Quantification of thermal stress on wheat yield
Once the most sensitive stage(s) to temperature is/are identified, it is important to know how seed set (grain yield) responds to intensity and duration of heat stress (Craufurd et al. Reference Craufurd, Vadez, Jagadish, Prasad and Zaman-Allah2013). Although the observation in the present study of a higher rate of yield reduction with unit increase in maximum temperature (daytime temperature) compared to the rate of reduction with unit increase in minimum temperature (night time temperature) (when assessed individually) is contrary to the findings of Lobell et al. (Reference Lobell, Ortiz-Monasterio, Asner, Matson, Naylor and Falcon2005) and Prasad et al. (Reference Prasad, Pisipati, Ristic, Bukovnik and Fritz2008), the higher rate of yield reduction with maximum temperature than minimum temperature observed in the present study was similar to the results reported by Ferris et al. (Reference Ferris, Ellis, Wheeler and Hadley1998). The decline in yield of wheat with 1 °C increase in maximum temperature of the present study (134·3–180·0 kg/ha) is much lower than that of 350 kg/ha reported by Ferris et al. (Reference Ferris, Ellis, Wheeler and Hadley1998). The differences in response of three different wheat cultivars to heat stress are in line with the results reported earlier in India and elsewhere (Dhillon & Ortiz-Monasterio Reference Dhillon and Ortiz-Monasterio1993; Stone & Nicolas Reference Stone and Nicolas1995; Rane & Nagarajan Reference Rane and Nagarajan2004; Rane et al. Reference Rane, Pannu, Sohu, Saini, Mishra, Shoran, Crossa, Vargas and Joshi2007). The differential responses of cultivars to temperature can help in identifying genotypes tolerant to thermal stress and fixing different rates of payment of indemnity for loss in yield of different crop cultivars.
Temperature thresholds for yields
The identification of temperature thresholds for crop productivity is an urgent requirement to provide a starting point for assessing extreme temperature-related risks and trigger values for weather-index-based crop insurance. The current paper presents for the first time thresholds of both maximum and minimum temperatures at each phenological stage of the crop for obtaining above average, average and below average yield. A study with a somewhat similar approach but an entirely different objective was made by Rane et al. (Reference Rane, Pannu, Sohu, Saini, Mishra, Shoran, Crossa, Vargas and Joshi2007) for evaluating genotypes under three types of environments. In the present study, thresholds of maximum and minimum temperatures during GS 60–91 of all three cultivars for achieving above average yield were identified. These thresholds will serve as triggers for weather-index-based insurance in wheat. Thresholds of temperature during these four critical stages for obtaining above average yields are somewhat similar to the cardinal temperatures (base, optimum and maximum) reported by Farooq et al. (Reference Farooq, Bramley, Palta and Siddique2011). However, these reported cardinal temperatures, which were mostly based on data from controlled conditions, cannot be applied to actual field conditions for their use in weather-based insurance. The thresholds developed in the current paper, based on long-term experimental work, fulfil more degrees of freedom and rigorous statistical analysis required for developing weather-index-based insurance products.
CONCLUSIONS
Conclusions drawn from the present study are that GS 73 is the most sensitive stage for both maximum and minimum temperatures to adversely influence yield of each individual cultivar and pooled yield of all three cultivars. Among the cultivars, HD-2285 was less sensitive to both maximum and minimum temperature during most of the phenological stages and K-8804 was most sensitive to minimum temperature during GS 21–91. The rates of yield reduction with 1 °C increase in maximum and minimum temperature during the critical phenological stage (GS 73) were highest, 180·0 and 160·9 kg/ha, respectively, in K-8804 and lowest, 134·3 and 103·3 kg/ha, respectively, in HD-2285. The optimum ranges of maximum temperature during GS 60–91 for obtaining above average yield across all the cultivars were 19·7–21·9, 24·2–26·5, 26·1–28·8 and 29·5–30·8 °C, respectively. Similarly, optimum minimum temperatures during these four stages were worked out to be in the range of 4·3–6·2, 8·3–9·7, 11·5–12·4 and 13·0–15·1 °C. These results will provide weather indices for weather-based crop (wheat) insurance and will also be useful for identifying temperature-sensitive traits for breeding thermal-stress-resistant wheat cultivars. This methodology of working out weather indices through long-term crop and weather analysis can be attempted in other crops and crop varieties.
The authors thank the authorities of Indian Council of Agricultural Research (ICAR) for supporting the research work through the project ‘National Initiative on Climate Resilient Agriculture (NICRA)’. Services rendered by Dr G. Ch Satyanarayana for analysis of data are gratefully acknowledged. We thank Dr B. M. K. Raju, Senior Scientist (Ag. Statistics), Central Research Institute for Dryland Agriculture, Hyderabad for his help in statistical analysis.