INTRODUCTION
Dairy farming in Europe and in particular in the UK is facing numerous pressures related to its lack of sustainability. Economic, environmental, ecological and sociological aspects of dairy farming need to be balanced to provide for more sustainable systems. Over the last 30 years within the EU the situation has developed such that milk production is regulated via milk quota, while an increasing number of environmental policies are required to be implemented (Oenema & Berentsen Reference Oenema and Berentsen2004). These environmental policies force farmers to use nutrients more efficiently and to decrease nutrient losses to the wider environment. Currently, the most important environmental policy in the EU affecting nutrient management is the Nitrates Directive (EC 1991).
However, there are many more legislations and protocols affecting dairy systems. With the implementation of the EU Water Framework Directive (WFD; EC 2000) farmers will have to further decrease the use of nitrogen (N) and phosphorus (P) and to further decrease N and P losses to surface waters. The Air Quality Directive (EC 2000) also sets limits to the emission of ammonia (NH3) and N oxides into the atmosphere, so as to abate acidification, eutrophication and tropospheric ozone (O3). The increasing concentration of greenhouse gases (GHG) (Kyoto Protocol: UNFCCC 1997), NH3 and nitric oxide+nitrogen dioxide (NOx) (Gothenburg Protocol: UNECE 1999) is also of international environmental concern. Agenda 2000 and the reform of the EU Common Agricultural Policy (CAP) have changed the production-based subsidies system to a single farm payment (SFP) decoupled from production. In order to receive this SFP, farmers have to meet statutory environmental and animal welfare regulations and must maintain their land in good agricultural and environmental condition.
Up to now, there have been many studies which have investigated the effect of management, environment or genetic variation (i.e. plant varieties) on the main issues that affect sustainability (e.g. plant genetics and environment on diffuse pollution: Macleod et al. Reference Macleod, Binley, Hawkins, Humphreys, Turner, Whalley and Haygarth2007; management and environment on GHG pollution: Schils et al. Reference Schils, Verhagen, Aarts, Kuikman and Sebek2006). However, most of these studies considered parts of the system in isolation and hence were unable to explain the interactions between the parts. Therefore, there is a need to develop approaches that view the system as a whole and that are able to interrogate the system about the potential scope to reach desirable targets. Systems modelling is a useful approach to integrate all the relevant issues that affect the sustainability of a dairy farm and it may also be used to explore the effect of different combination of measures on such sustainability. However, appropriate models to determine objectively the sustainability of dairy farming systems are still lacking. Some integrated modelling approaches have been developed as decision support that considers both biophysical and socio-economic approaches (e.g. Rossing et al. Reference Rossing, Jansma, De Ruijter and Schans1997; Vereijken Reference Vereijken1997; Van Calker et al. Reference Van Calker, Berentsen, Romero, Giesen and Huirne2006). However, they generally lack process-based mechanisms and thereby lack sensitivity to major factors that affect sustainability and show only a partial reflection of the complex chain of causes and effects (Van Cauwenbergh et al. Reference Van Cauwenbergh, Biala, Bielders, Brouckaert, Franchois, Garcia Cidad, Hermy, Mathijs, Muys, Reijnders, Sauvenier, Valckx, Vanclooster, Van der Veken, Wauters and Peeters2007). They also lack the capability of simulating the introduction of more nutrient efficient plants or animal types, which may need to be evaluated against merely improving nutrient management. In order to fill these gaps, a new model (Sustainable and Integrated Management Systems for Dairy Production (SIMSDAIRY): del Prado et al. Reference Del Prado, Scholefield, Chadwick, Misselbrook, Haygarth, Hopkins, Dewhurst, Jones, Moorby, Davison, Lord, Turner, Aikman and Schröder2006b) has been developed.
Plant growth and nutrient use efficiency is generally limited by a combination of genotype and environmental factors. New genotypic varieties with increased nutrient use efficiency have been recently developed and may indirectly result in decreasing pollution to the wider environment (e.g. Wilkins et al. Reference Wilkins, Allen and Mytton2000). These existing as well as possible new varieties may assist the full realization of the potential of crop improvement to multifunctional agriculture, where both productivity and ecosystems services are major goals (Abberton et al. Reference Abberton, Fothergill, Collins and Marshall2006).
Manipulating the scope for future animal traits such as the ability to yield milk and the ability to excrete different proportions of ingested N as urine or dung (irrespective of diet N ingested), although useful in reducing losses per unit of product, may have important trade-off implications for animal welfare (fertility and mastitis), animal replacements and milk quality. Enhanced focus on traits that balance milk yield, milk quality and animal health could potentially improve the sustainability of dairy farming systems.
In the current study, SIMSDAIRY is used to compare the scope to improve the overall sustainability of a dairy farm by: (i) future system changes aimed at improving genetic characteristics of plant and animal with (ii) current system structural changes aimed at improving nutrient management efficiency (e.g. manure application techniques, silage making quality and optimized fertilizer distribution).
MATERIALS AND METHODS
General SIMSDAIRY modelling framework description
SIMSDAIRY is a new modelling framework which integrates existing models for N (NARSES: Webb & Misselbrook Reference Webb and Misselbrook2004; NGAUGE: Brown et al. Reference Brown, Scholefield, Jewkes, Lockyer and Del Prado2005), P (PSYCHIC: Davison et al. Reference Davison, Withers, Lord, Betson and Stromqvist2008; Stromqvist et al. Reference Davison, Withers, Lord, Betson and Stromqvist2008) and farm economics (A. Butler, personal communication), equations to simulate NH3 losses from manure application (Chambers et al. Reference Chambers, Lord, Nicholson and Smith1999), predict CH4 losses (Chadwick & Pain Reference Chadwick and Pain1997; Giger-Reverdin et al. Reference Giger-Reverdin, Morand-Fehr and Tran2003) and nutrient requirements (Feed into Milk (FiM) (Thomas Reference Thomas2004)), as well as ‘score matrices’ for measuring sustainability attributes of biodiversity, landscape, product quality, soil quality and animal welfare.
The modelling framework has been fully described by del Prado et al. (Reference Del Prado, Scholefield, Chadwick, Misselbrook, Haygarth, Hopkins, Dewhurst, Jones, Moorby, Davison, Lord, Turner, Aikman and Schröder2006b) and A. del Prado et al. (unpublished). SIMSDAIRY has been used for a number of desktop studies in order to investigate abatement options at farm scale for GHG emissions from ruminant livestock systems (Schils et al. Reference Schils, Olesen, Del Prado and Soussana2007), investigate possible trajectories towards UK dairy sustainable farming systems (del Prado & Scholefield Reference Del Prado and Scholefield2006), assess the impact of NO3 leaching abatement measures on N2O and CH4 emissions from a UK dairy system (del Prado et al. Reference Del Prado, Cardenas and Scholefield2006a) and evaluate CH4 mitigation measures for long-term national CH4 emissions from ruminants (J. Mills et al., unpublished).
The model is very sensitive not only to management but also weather, topography and soil characteristics and is capable of optimizing farm management practices to meet user multiweighted criteria and to explore the possible impact of application of mitigation options on (i) emissions of pollutants such as: N2O, CH4, NH3, NOx, NO3 and P; (ii) economic profitability; (iii) milk quality; (iv) biodiversity; (v) landscape; (vi) soil quality; and (vii) animal welfare.
The effect of management practices on N, P and CH4 losses are predicted within different components and through different processes in the soil–plant–animal system using a monthly time step and applying the principle of mass conservation. These practices can be defined in terms of management for instance of: (i) manure (i.e. straw-or slurry-based system, storage type, application method, incorporation time and technique, timing of application, rate, manure dry matter (DM) g/kg content and spatial distribution), (ii) mineral fertilizer (e.g. rate, type and spatial distribution), (iii) animal (i.e. milk target/cow, fat content target in milk, protein content target in milk, calving month, grazing time, diet profile and animal breeds) and (iv) forage area (i.e. spatial distribution, sward age, history, tillage, plant varieties and silage making technique).
The effect of incorporating either current or theoretical future plant and animal varieties with changed traits on the different components that define the sustainability of a dairy farm can also be simulated with SIMSDAIRY, where relevant functional characteristics of either plants or animals can be modified.
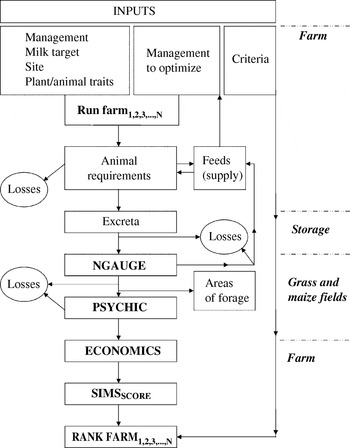
The structure of the framework is shown in Fig. 1. The main data inputs required to run the model are: farm management (e.g. animal, grassland and maize), milk target (e.g. milk protein and butterfat contents), site characteristics (e.g. coordinates that define average climatic conditions and soil types), plant/animal traits, management to optimize (e.g. number of grazing days) and criteria used as a basis to optimize (e.g. environmental).
The structure of the SIMSDAIRY modelling framework.

SIMSDAIRY scope focuses on strategic and tactical management levels and is capable of optimizing dairy management factors in order to find more sustainable systems (del Prado & Scholefield Reference Del Prado and Scholefield2006). The whole framework operates automatically and, except for the SIMSPSYCHIC submodel which is an external link through a Visual Basic (VB) Dynamic Linking Library (DLL) file, has been coded into a program compiled with Borland Delphi 5. SIMSDAIRY's final users are currently those involved in strategic research (e.g. policymakers); however, it is likely to be extended to include user-friendly input and output screens for farmers' advisors to use it.
Description of stream of calculations made in SIMSDAIRY
These can be subdivided into the calculations related to: (1) animal nutrient and energy flows, (2) manure nutrient flows, transformations and losses, (3) plant and soil nutrient flows, transformations and losses and (4) economic and attributes of sustainability.
Animal calculations
Prediction of feed voluntary DM intake during the housing and grazing period is calculated as a function of forage intake potential (FIP), concentrate dry matter intake (CDMI), animal condition score (CS), animal weight (W), milk energy output (MEO), week of lactation (WOL) and forage starch (FS) concentration. Calculations are based on the FiM system (Thomas Reference Thomas2004). Total metabolizable energy (ME) and true protein (MP) requirements are defined as the energy and proteins needed for body weight change, pregnancy post 250 days, maintenance, milk production and activity (e.g. grazing). For any given diet comprising silage (grass and/or maize) and concentrates, SIMSDAIRY optimizes the concentrates characteristics in order to ensure that: (i) feed supply matches dairy cow requirements (DM, energy and N), (ii) rumen does not become acidic, (iii) amino acids in the diet are optimum for milk protein synthesis and (iv) the effect of diet composition on the composition of milk is predicted.
Manure calculations
The N and P contents of both manure produced during housing and excreta deposited during grazing, are then calculated for each type of cow and subsequently in total (applying number of animals of each type) by subtracting N and P in milk and net body change from those ingested by both housing and grazing young and lactating cows. The N and P contents of manure produced during housing and storage are simulated to be applied to the different farm fields. Prior to application, gaseous N and CH4 losses (from housing and storage) and straw N from bedding are calculated and computed with the total existing pool of N in manure. Manure N losses are simulated according to the approach from Webb & Misselbrook (Reference Webb and Misselbrook2004), by which NH3, N2O, NO and N2 emissions are calculated from the pool of total ammonium nitrogen (TAN) in manure N according to different Emission factors (Efs) for different manure management stages.
The manure N that is not lost through NH3 losses during the housing or storage period is assumed to be applied in the soil. Efs for NH3 volatilization from slurry were determined for application on grassland and maize land according to: (i) properties of the slurry (DM content), (ii) its application date (for soil moisture content), (iii) incorporation timing after application, (iv) method of application and (v) method of incorporation. Equations from MANNER (Chambers et al. Reference Chambers, Lord, Nicholson and Smith1999) were used for this purpose. Efs for NH3 volatilization from farm yard manure (FYM) were also incorporated from MANNER taking incorporation delay and technique as the main driving factors for controlling NH3 losses from application.
Plant and soil calculations
The nutrient requirements (N and DM) for cows from different sources must match harvested and grazed N and DM plant yields (after allowing losses from grass and maize conservation). Land on the farm is used to grow grass and maize in order to fulfil those animal requirements not covered by the ingestion of concentrates. This land is defined in terms of use and four classes are allowed: (i) grass area grazed by dairy herd, (ii) grass area grazed by followers, (iii) area for grass conservation and (iv) maize. Using the submodel NGAUGE, N and P flows are simulated on a per hectare basis for each land use, given soil types, sward age, pest management and for given rates of manure and mineral fertilizer applications. DM, N and P plant yields together with losses of N [N2, N2O, NH3, nitric oxide+nitrogen dioxide (NOx) and nitrate (NO3−) leaching] and CH4 are predicted and the surface required for each land use is hence calculated by simply dividing the total predicted animal requirements from grass and maize (previous stages) over plant yield (once silage making losses have been accounted for) of each crop source.
The submodel PSYCHIC predicts the risk of P diffuse pollution from a source area by estimating source, mobilization and delivery of P and sediment: P inputs in manure and fertilizers and soil residual P, the mobilization of P and sediment through dissolution and soil detachment and the delivery of dissolved and particulate P and associated sediment, to watercourses in surface and subsurface runoffs.
Economic and attributes of sustainability calculations
The net farm margin is then calculated by subtracting the total fixed costs and overheads from the gross margin. Variables costs are calculated by the model as a function of management variables (i.e. £ per unit of applied manure volume). Some management strategies (e.g. those resulting in enhancing landscape), because of large variability in their costs, are user-proposed inputs and hence are not intended to reflect an accurate value. Subsequently, sustainability matrices are scored by the submodel SIMSSCORE, which simulates the effect of both nutrient management variables (e.g. effect of unsaturation of fatty acids in the diet on milk yield) and non-nutrient management variables (e.g. available surface per cow during housing) on the sustainability of the farm in terms of biodiversity, landscape, milk quality, soil quality and animal welfare. The scores assigned reflect poor (0) to very satisfactory (6) sustainability. The farm sustainability is then evaluated by the submodel RANK.
Design of simulation study
A baseline conventional dairy farm was defined for testing the different management and genetic changes proposed in the current study.
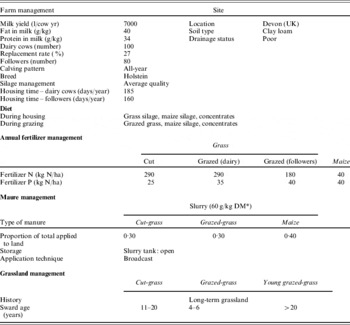
The main characteristics of the farm are shown in Table 1. A conventional dairy farm in the South West of England which typically relies on on-farm grass and maize production and bought-in concentrates for sustaining animals. Dairy cows graze around half a year (from April till September) and remain housed during the rest of the year. Some assumptions were made to the dairy system in order to simplify the simulations. For instance, any cow other than dairy was simulated with the assumption that it would be represented by an average follower of a bodyweight size of 300 kg with no body-weight change during the year. The grassland area was split into cut-only fields (three cuts for silage) and cut-and-grazed fields (one cut). The timing and proportion of annual mineral fertilizer applied per month were designed to follow the UK fertilizer recommendations for agricultural crops (RB209) (MAFF 2000) and timing for the manure applied to land followed the distribution patterns described by Smith et al. (Reference Smith, Brewer, Crabb and Dauven2001), in which the proportion of manure applied of the annual total is as follows: from February to April (0·40), May to July (0·10), August to October (0·25) and November to January (0·25). The NVZ closed periods were taken into account and no manure was spread to grassland fields from 1 September to 1 November.
Main characteristics of the typical dairy farm used as baseline

* DM, dry matter.
Simulating improved management towards sustainability
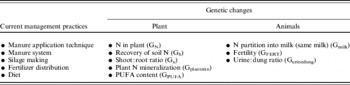
The specific management factors and plant and animal new traits characteristics modified are shown in Table 2.
Management factors and plant and animal characteristics modified in order to improve the sustainability of UK dairy farms

Among the changes in current management, SIMSDAIRY tested the following alternative practices to those used in the baseline scenario: (i) different manure application techniques (e.g. deep injection, shallow injection and band-spread), (ii) different timing of incorporation of manure, (iii) different manure system (e.g. straw-based system), (iv) different g/kg DM content in manure, (v) different quality of silage making, (vi) different mineral fertilizer distribution (with the target to produce the same herbage or maize per hectare), (vii) different timing and spatial distribution of manure and (viii) different diet strategies (e.g. changing concentrates/litre) milk produced or adding fat supplementation).
The following changes were investigated at the plant genetic level: (i) the crude protein (CP) of the plant (GN), (ii) recovery of soil-available N by the plants (Gh), (iii) harvest index (Gu), (iv) plant dead N mineralization (Gplantmin), (v) polyunsaturated fatty acids (PUFA) content in the plant (GPUFA) and at the animal genetic level: (vi) diet N partition into milk (producing the same amount of milk) (Gmilk), (vii) fertility (GFERT) and (viii) urine:dung ratio (Gurinedung).
Changes were either simulated singly or introduced in a stepwise process by which each step introduced a new different management or genetic change; this change being optimized by the SIMSDAIRY modelling framework. The changes, acting singly, or in combination, are evaluated on farms. The SIMSDAIRY optimization procedure, for most parameters, was set to adjust the hectares needed for forage instead of adjusting the number of cows that certain reductions in plant production per hectare could trigger. This is not the case for mineral fertilizer, where changes are obtained by adjusting the fertilizer rate and supposing the same amount of forage surface and CP plant production per hectare. These assumptions do not intend to emulate the most probable decision made by farmers but are used only as an example of the most probable way to achieve sustainability.
In order to assess environmental sustainability seven indices were used as the criteria of SIMSDAIRY optimization. One of these indices (environmental index) accounts for the impacts of farming on eutrophication potential per hectare, acidification potential per hectare, global warming potential per tonne of milk and water use per hectare and comprises predicted outputs of CH4, N2O, NOx, NH3 and NO3 leaching and water use (index adapted from Van Calker et al. Reference Van Calker, Berentsen, Romero, Giesen and Huirne2006). The score assigned reflect poor (0·0) to very satisfactory (1·0) environmental sustainability. The rest of the indices are as follows: (i) economic: farm net profit £0.03/litre of milk), (ii) quality of milk: defined as milk with enhanced PUFA composition, (iii) animal welfare status, (iv) level of biodiversity and landscape aesthetics and (v) soil quality. A set of desirable sustainable targets for the predicted farms was also defined. Targets associated to impacts on water quality were set to comply with the Nitrates Directive (<11·3 mg/l in the leachate) and to reduce the P threshold for eutrophication (<100 μg/l). A GHG reduction (12·5%) from the baseline farm was proposed in order to comply with Kyoto Protocol targets both individually and as a whole. Gothenburg Protocol set emission ceilings for 2010 for NH3 and NOx (Gothenburg Protocol: UNECE 1999) in Europe. According to this protocol, a reduction from the baseline farm was proposed at 17 and 41% for NH3 and NOx, respectively. An adequate net farm income for standard living and acceptable standards (score of 4 out of 6) of quality of milk, animal welfare, level of biodiversity and landscape aesthetics and soil quality were also set as sustainable targets. The acceptable net farm income was assumed to be net profit of £0.03/litre of milk. This value was arbitrarily chosen for the purposes of this modelling exercise as no data were available to support any specific value.
It must be pointed out that, although not explored in the current study, the results are not intended to cover the whole range of possible conditions in the UK. Results cannot be extrapolated to the different climatic and soil conditions in the UK because sustainability indicators, especially environmental losses are likely to vary, not only in total but also in different forms of pollutants. Economic results would also be very sensitive to herd size and thereby farms with larger herds than those simulated in the current study would be likely to result in greater net farm margins.
RESULTS AND DISCUSSION
Baseline farm scenario results
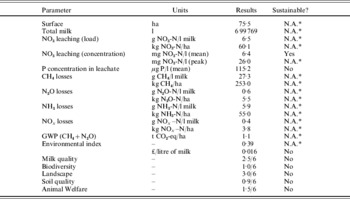
Table 3 shows the results from the simulated baseline farm scenario. For all the variables studied, except for the mean concentration of NO3− leaching (in relation to the Nitrates Directive threshold), the baseline farm scenario failed to meet previously defined desirable targets for sustainability. The baseline results for GHG and acidifying gases were used as starting values and were not subject to assessment at this point. Of all the rest of variables studied, only the net farm profit reached at least half of the value required to meet the desirable sustainable targets (0.016/0.03 £/litre of milk).
Units, predicted results and assessment of sustainability for the different variables studied

* N.A., not applicable.
The predicted score for biodiversity was very low (1/6), partly due to frequent grazing and cutting. Frequent grazing and cutting have been found by other authors (e.g. Benton et al. Reference Benton, Vickery and Wilson2003) to result in lack of spatial and structural heterogeneity, which is widely recognized as a key factor influencing farmland birds and overall biodiversity. Other factors that greatly influenced this low biodiversity score were the fertilizer and stocking rates. The high level of N fertilizer rates simulated in the current study's baseline scenario (>300 kg N/ha at the farm level), together with predicted N from mineralized soil organic matter and animal excreta, has been found by many studies (e.g. Firbank Reference Firbank2005) to encourage the growth of competitive species, resulting in the loss of many species which are of substantial ecological significance. Stocking rates greater than 2·0 LU/ha combined with a heavy textured soil and very wet conditions have been found to increase the likelihood of soil compaction and structural damage (Whitmore Reference Whitmore2001). This was the main factor affecting the predicted low soil quality score. Soil structural damage caused also contributed to the low score for biodiversity as it can have both direct and indirect negative consequences for grassland fauna and biodiversity. Sanderson (Reference Sanderson, Quigley and Tiedemann1989), for example, found that compaction of soil by cattle made the habitat unsuitable for some invertebrates. The challenge to reverse the negative trend of biodiversity levels would be substantial as studies suggest that changing to more extensive practices does not necessarily yield to restore grassland biodiversity in the short term and methodologies for incorporation of patches for biodiversity within the farm are not as well developed for grassland fields as they are for arable systems (Smart et al. Reference Smart, Robertson, Shield and Van De Poll2003).
Management-based changes acting singly
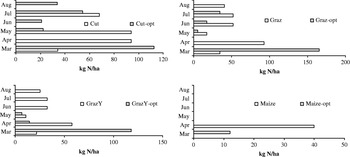
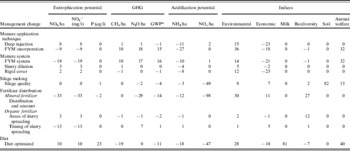
As expected, changes in management practices led to improvements in the overall sustainability over the baseline dairy farm. Table 4 shows the predicted percentage change in the different sustainability indices for the five most environmentally sustainable overall management practices acting singly. SIMSDAIRY optimization predicted that the three best management changes to improve the value of the environmental index were: (i) changing to an FYM-based system where the manure was rapidly incorporated into the soil (+36%), (ii) optimization of the mineral N fertilizer rate and timing (+30%) and (iii) optimization of diet (+28%). Of these three changes, optimization of mineral N fertilizer was the only measure that, while improving the environmental index, did not result in trade-offs to any of the other indices or pollutants in isolation. By tactically matching the plant N requirements to the rate and temporal distribution of mineral N fertilizer (Fig. 2), the changed farm reduced environmental losses by 29% in GHG production or 98% in NOx output while improving economic output by 11%, through saving costs on fertilization, and increasing the biodiversity index by 27%. This predicted increase was mainly a result of reducing the inorganic N flows in the soil (data not shown). It must be pointed out that SIMSDAIRY incorporates different relationships by Herrmann et al. (Reference Herrmann, Dabbert and Schwarz-Von Raumer2003) that relate nutrient input (mineral fertilizer and manure) with biodiversity (del Prado et al., unpublished). Based on these relationships, biodiversity level increases with decreasing amount of nutrient (N and P) inputs (McAdam et al. Reference McAdam, Kerr, Fisher and Tallowin2001). For this particular baseline farm the optimized fertilizer distributions indicated that higher doses in early spring would improve the N use efficiency of grass. In terms of maize fields, manure application in February or March released enough available N to reach a more efficient match for maize plant N uptake requirements (Fig. 2).
Mineral fertilizer distribution and rate for the farm areas under cut grass (Cut), grazed grass by dairy cattle (Graz), grazed grass by followers (GrazY) and maize (maize) for baseline and SIMSDAIRY's optimized (-opt) farms, respectively.

Predicted change (%) in the different sustainability indices after optimizing management changes acting singly

* GWP=global warming potential (CO2 eq/ha yr).
Currently, there is an ongoing process to revise the existing Fertiliser Recommendations for Agricultural and Horticultural Crops (RB209). Changes will be made to improve advice on reducing losses to the environment through fertilizer management. However, although it has been assumed in the baseline scenario that current farmers would follow the RB209 guidelines, there is little evidence to support this assumption and there is great suspicion that most farmers are still far behind these guidelines.
Changing to an FYM-based system where the manure was rapidly incorporated into the soil reduced losses related to eutrophication and acidification potential but increased losses of GHG (N2O and CH4), most of these emissions coming from storage prior to spreading (data not shown). The use of additional straw in animal housing and the rapid incorporation of manure into the soil have been recognized in experimental studies as potential techniques to reduce NH3 emissions (Webb et al. Reference Webb, Menzi, Pain, Misselbrook, Dammgen, Hendriks and Dohler2005) but increase N2O and CH4 emissions (Yamulki Reference Yamulki2006), i.e. ‘pollution swapping’. However, there is still not much experimental evidence that incorporation of manure into the soil will always result in increasing N2O emissions compared with broadcast spreading. This will possibly be regulated by site-specific conditions (i.e. weather and soil conditions) (Thorman et al. Reference Thorman, Chadwick, Harrison, Boyles and Matthews2007). A better solution, as proposed by Thorman et al. (Reference Thorman, Chadwick, Harrison, Boyles and Matthews2007), would possibly be either bypassing the storage phase, or to use a N2O mitigation measure specifically targeted at storage, e.g. the addition of high C substrates (Yamulki Reference Yamulki and Weiske2004). Changing to an FYM-based system also had positive implications for the animal welfare score. The use of straw substantially improved the bedding conditions for dairy cows. Unfortunately, it caused a reduction in net farm income (−18%), mainly from increased cost through manure handling and incorporation into the soil. Although not reflected in the current study, this type of system implies harder working conditions as management complexity is generally greater in FYM-based than in cubicle-based systems. For instance, FYM is assumed to be cleared out in suitable weather after the cows have gone out to grass and sometimes FYM must be removed by a contractor.
Diet changes to minimize overall environmental index included a shift towards more maize and less concentrates and grass silage, and changes in the concentrate characteristics. These changes affected the nutrient composition of the diet by increasing total starch, fat and low degradable protein, and decreasing energy and CP. As a consequence of decreasing dietary CP content and increasing low degradable protein content, urinary N excretion decreased and the cow N use efficiency increased, which is in line with experimental studies (e.g. Kebreab et al. Reference Kebreab, France, Beever and Castillo2001; Colmenero & Broderick Reference Colmenero and Broderick2006). The inclusion of fat supplements with a high degree of unsaturation in their fatty acids profile increased the milk quality score (+81%) and animal welfare index (+40%). Although some studies have found that elevated levels of unsaturated fat supplementation may have a negative impact on the rumen function and DM intake (Jenkins & Jenny Reference Jenkins and Jenny1989; Pantoja et al. Reference Pantoja, Firkins, Eastridge and Hull1994) other studies have not found such evidence (Palmquist & Conrad Reference Palmquist and Conrad1978). Therefore, since SIMSDAIRY cannot predict any of these consequences, simulated results assume that the level of fat supplementation would be such that it would not adversely affect the rumen function and DM intake.
These fat supplements were rich in PUFA and enhanced the PUFA composition in the milk. This milk characteristic has a potentially positive effect on the health of the milk consumers (Parodi Reference Parodi1997). In experimental studies (e.g. Dewhurst et al. Reference Dewhurst, Scollan, Lee, Ougham and Humphreys2003), concentrations of conjugated linoleic acids (CLA), trans-vaccenic acid (TVA) and n−3 PUFA have been found to increase after PUFA cow supplementation. This positive impact on dietetic quality of milk results in an improved image of this product by the consumer as indicated by Dewhurst et al. (Reference Dewhurst, Scollan, Lee, Ougham and Humphreys2003). Moreover, high levels of some of these PUFA in the diet have been described as having a positive effect on fertility (Ambrose et al. Reference Ambrose, Kastelic, Corbett, Pitney, Petit, Small and Zalkovic2006). Predicted GHG were reduced through the reduction of CH4 output from rumination. This effect has been described by numerous studies (e.g. Machmüller et al. Reference Machmüller, Ossowski, Wanner and Kreuzer1998) as one of the best ways to mitigate CH4 outputs from the rumen as some fats alter the ruminal microbial ecosystem and, in particular, the competition for metabolic hydrogen (H2) between the CH4 and propionate production pathways (Czerkawski Reference Czerkawski1972). Addition of fat supplements in the diet, in addition to increasing dietary energy and suppressing methanogenesis, can under certain circumstances decrease gaseous nitrogen emission from the manure (Machmüller et al. Reference Machmüller, Ossowski and Kreuzer2006). However, this cannot be simulated by SIMSDAIRY since experimental studies (e.g. Machmüller et al. Reference Machmüller, Ossowski and Kreuzer2006) still find no evidence to relate the effect of this type of supplementation on NH3 or N2O emission from manure storage and application to the soil. The predicted acidification potential, especially through NH3 mitigation, was also reduced, which agrees with experimental studies, such as that from Misselbrook et al. (Reference Misselbrook, Powell, Broderick and Grabber2005). Misselbrook et al. (Reference Misselbrook, Powell, Broderick and Grabber2005) showed that manipulating the concentration and form of protein in the diet of lactating cows influenced the amount and form of N excretion and subsequent NH3 emissions from the barn floor and manure management. However, the predicted eutrophication potential increased through increase in both NO3− and P losses and, moreover, the economic returns were 10% worse than the baseline farms due mainly to the increased costs of fat supplementation. The costs associated with fat supplementation may discourage farmers from adopting this change. However, this trend could be overturned if an increased milk payment to farmers is established through production of higher value milk directly from the farm (del Prado & Scholefield Reference Del Prado and Scholefield2006) or/and sustainable deliverables to the environment.
Other manure-based changes were either too costly (e.g. deep injection) or did not improve the environmental index (e.g. timing of manure spreading:+1%). Most of the changes in manure management generally led to a certain degree of pollution swapping. For instance, those changes aimed at reducing NH3 emissions from application of manure to the soil resulted in increased NO3− leaching losses (e.g. deep injection). Many other studies have also found this pollution swapping effect (e.g. Webb et al. Reference Webb, Henderson and Anthony2001). Improving the quality of silage making resulted in decreasing most of the environmental losses, especially NOx, and increased (+7%) the economic returns and the level of soil quality (through a shift from surface dedicated to grazing to surface dedicated to high quality silage) and animal welfare.
Genetic-based changes acting singly
SIMSDAIRY optimization of genetic-based changes resulted in varieties (data not shown) that increased: (i) the recovery of the available soil N by the plants (Gh), (ii) harvest index of plants (Gu), (iii) the PUFA content in the plant (GPUFA), (iv) the diet N partition into milk (Gmilk) and the fertility of the cow (GFERT) and decreased: (i) the CP of the plant (G%N), (ii) plant dead N mineralization (Gplantmin) and (iii) the urine:dung ratio (Gurinedung).
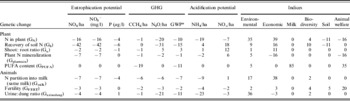
Table 5 shows the predicted percentage change in the different sustainability indices after introducing genetic changes in terms of plant and animal functional traits acting singly.
Predicted change (%) in the different sustainability indices after optimizing genetic changes in terms of plant and animal functional traits acting singly

* GWP=Global warming potential (CO2 eq/ha yr).
SIMSDAIRY optimization predicted that the best changes to improve the value of the environmental index (percentage improvement compared with the baseline scenario as shown in brackets) were by manipulating the following traits: (i) Gurinedung (+36%), (ii) G%N (+35%), (iii) Gmilk (+17%) and (iv) Gh (+9%). Both Gurinedung animal trait and G%N plant trait resulted in reductions in all of the other indices or pollutants in isolation. Whereas G%N was more effective in reducing NO3− leaching losses than Gurinedung, the opposite result was found in terms of reducing the NH3 losses. Gmilk was also an effective trait to decrease values from most of the indices or pollutants in isolation; however, reductions were always below 10%. Incorporating the Gh plant trait resulted in great reductions in both NO3− leaching (−42%) and N2O emissions (−31%). However, it resulted in some amount of pollution swapping with NH3 and NOx. The main differences in terms of the non-environmental indices were found in the economic performance of the farm. Both G%N and Gmilk resulted in economic improvements of almost 40% and Gh improved the economic performance in a smaller way (16%). The biodiversity index was only improved by introducing the Gh trait, by which the amount of annual inorganic N flows in the soil were reduced and, hence, potentially with greater opportunities for improving the botanical diversity. This fact, however, needs further testing as the temporal variation of inorganic N flows in the soil within a year may have different implications for different potential plant species.
As expected, traits related to increasing the PUFA content in plant (GPUFA) and that related to increasing the fertility of the animal (GFERT) improved the index of animal welfare. GPUFA increased greatly the quality of milk index. The scope for these traits would be obviously related to the amount these new varieties can increase these PUFA-rich content without trade-offs in other aspects affecting the sustainability of the farm (e.g. yield production). Variation between grass varieties and species in content of PUFA and in susceptibility to biohydrogenation in the rumen has already been identified (Elgersma et al. Reference Elgersma, Ellen, Van Der Horst, Muuse, Boer and Tamminga2003). However, so far, the effects of this genetic variation are small compared with variation through the growing season (Dewhurst et al. Reference Dewhurst, Scollan, Youell, Tweed and Humphreys2001).
As current trends in grass breeding already focus on increasing the amount of DM yield per unit of fertilizer applied by either reducing the CP concentration of the herbage (G%N) or by increasing the proportion of the available soil N recovered (Gh) (Wilkins & Humphreys Reference Wilkins and Humphreys2003), it is realistic to think that some of the traits predicted in this study are feasible to be available for farmers in the nearby future. There is, however, less scope for altering the harvest index (Gu) of grasses (except perhaps a little between root:shoot ratio) (Wilkins & Humphreys Reference Wilkins and Humphreys2003), which, considering the small effect found in the current study on either environmental or/and economic performance, should discourage any plant breeding in that direction. The likelihood of finding either plant varieties which could reduce rates of mineralization of dead plant material (Gplantmin) or cow varieties which may favour excretion as dung over urine (Gurinedung) is still unknown. It is worth mentioning that most of the studies on decreasing dung over urine so far (e.g. Castillo et al. Reference Castillo, Kebreab, Beever and France2000; Kebreab et al. Reference Kebreab, France, Beever and Castillo2001; Marini & Van Amburgh Reference Marini and Van Amburgh2005) have focused the effect of diet on this urine: dung output ratio and so this paper considers such a trait as purely theoretical.
Management- and genetic-based changes acting in combination: a general comparison
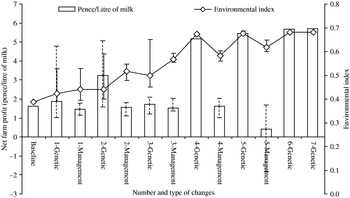
The results of the single and combined management and genetic changes are summarized in Fig. 3. This figure shows the mean, and maximum and minimum values for each number and type (management or genetic) of combinations in terms of economics and environmental index performance of the farms. As expected, as the number of changes increased, the environmental losses decreased (as the environmental index increased) both with management and with genetic derived changes. However, the net farm income increased only when the changes were genetically based ones and not management-based ones. Obviously, this scenario is assuming that no increased cost would be involved in, for example, new varieties of grass seeds or animal insemination.
Comparison of net farm profit and environmental predicted indices results for the baseline farm and those farms under different number (from 1 to 7) and type of changes (management-derived or genetically derived). Vertical columns and rhomboids represent means of up to eight predicted results for net farm profit and environmental indices, respectively. Vertical bars represent maximum and minimum values.

The environmental performance increased quite constantly as increasing number of management-based changes was considered. This increase in environmental performance for the genetic-based changes, however, was large only for the first four cumulative combinations and thereafter, no substantial improvement was observed (Fig. 3). Net farm incomes resulting from combinations of management-based changes were in most cases, very similar both in average and maximum–minimum values (Fig. 3).
Only when five management changes were combined, did net farm income decrease considerably. The fact that the net farm income greatly increased when the genetic-based changes were upgraded from three to four implies that the scope for obtaining the most balanced system in terms of environmental losses and economic performance through genetic-based changes would be generated from four of the genetic combinations. The fact that the ranges of minimum–maximum values are large in all the genetic-based changes with fewer than four combinations would support this selection of combinations of four.
Management- and genetic-based changes acting in combination: best combinations
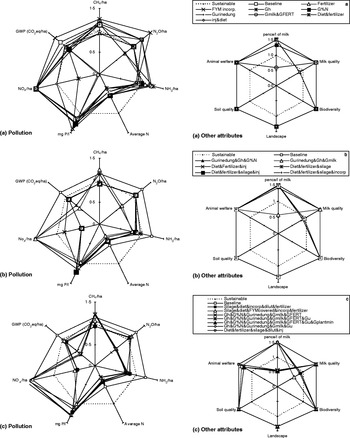
Examples of the predicted results from the three best combinations in terms of overall environmental performance (environmental index) from one to two measures together, three to four and over five measures for management and genetic changes, respectively, are shown in Fig. 4.
Comparison between baseline, sustainable and combinations of management- and genetic-based change scenarios for variables indicating environmental pollutants and variables indicating other attributes that define the overall sustainability of a dairy farm. The combinations of measures are as follows: (a) 1–2 measures; (b) 3–4 measures and (c) >4 measures. *dilut, diluted slurry; inj, slurry injection; covered, covered manure storage; incorp, incorporation of manure into the soil.

Results from these combinations are compared with those results from the baseline scenario and the targeted sustainable scenario (as defined in the material and methods section). Figures were plotted as radar graphs (Fig. 4). Two different graphs were plotted for each combination: one with seven variables for pollutants and another with six variables for other sustainability attributes (net farm income, milk quality, biodiversity, landscape, soil quality and animal welfare). The expected values for the sustainable scenario were transformed to a 1 unit basis and the predicted results from the different combinations were proportionally transformed to this value of 1. Values <1 implied meeting the threshold of individual sustainability indices. For clarity, all values ⩾1·5 were assumed to be 1·5. Thereby, the closer the value was to the centre of the diagram, the more sustainable the farm scenario was for that particular variable.
The different pollutants met the required individual targets for sustainability after different number of combinations of changes: for these particular climatic and soil conditions, farms always resulted in mean NO3−-N concentration in the leachate well below the Nitrate Directive threshold and P concentrations around the 100 μg/l value threshold. However, it must be pointed out that ecological targets in accordance with the WFD may actually require lower total N concentrations than 11·3 mg/l (Camargo & Alonso Reference Camargo and Alonso2006) and possibly much lower P concentrations than 100 μg/l. Moreover, evidence suggests that a further quantification of the different bioreactive forms of P is required to link P losses to actual eutrophication (Turner & Haygarth Reference Turner and Haygarth2000). Potential P sources vulnerable to mobilization and delivery to surface or groundwaters were involved in some changes, either genetic-based or management-based. However, P losses could not be substantially decreased as no changes affected mobilization and transport of P in the dairy farm system in the short-medium term.
In terms of GHG, both management and genetic measures showed great potential to reduce N2O emissions to below the sustainability threshold values. However, in terms of management combinations, this threshold was actually only reduced through measures that included fertilizer as a single measure or fertilizer and diet optimization together. Most of the combinations from genetic measures shown in Fig. 4 resulted in decreasing N2O emissions further than the targeted values for sustainability. The reduction of CH4 losses below the sustainable threshold was achieved when fatty supplements were used in the diet only or when genetic changes that increase PUFA content in the grass were introduced. Targets of GHG values as a combined result of CH4 and N2O were met with almost any of the combinations plotted in Fig. 4, both management and genetic-based. Ammonia sustainability threshold was reduced in most cases especially when over two measures, either management-based or genetic-based, were used. The NOx threshold value was only reduced by means of management measures that combined fertilizer optimization and silage process improvements.
The studied management or genetic changes did not have a substantial effect on sustainable indices such as those related to landscape aesthetics, soil quality or biodiversity. Whereas landscape was not affected at all, soil quality and biodiversity were mainly affected by combinations which had an effect on soil flows of N and P (biodiversity) and grazing time and intensity (soil quality and biodiversity). Management-based changes, such as those incorporating diet and fertilizer changes, resulted in complying with all the environmental targets except for the P threshold and offered large scope to meet the desired milk quality standards. However, unless this type of milk is priced as a premium product, these management-based changes resulted in financial shortages.
CONCLUSIONS
In the current study, management-based changes in the baseline farm scenario offer smaller scope to satisfy both environmental and economic targets than genetic-based ones. Most management-related changes imply some technical improvements and, hence, large costs. Among the management-based changes, optimizing N mineral fertilizer rate and timing is the only management-based measure that, while improving most of the environmental and biodiversity indices, can improve economic results. Diet-based changes, although they can considerably reduce environmental losses and increase milk quality, will result in economic penalties to the farm unless a market niche is created for milk naturally enhanced with PUFA. Optimization in manure management results in overall environmental benefits but increases both the risk of pollution swapping and economic penalties.
Some genetic-based changes offer substantial scope for improving environmental losses while having economic benefits. However, only those decreasing the CP of the plant and increasing the diet N cow partition into milk seem to both satisfy feasibility of bringing out these varieties in the nearby future and absence of pollution swapping caused.
Only the measures which include genetic changes that result in a combination of greater feed N use efficiency and increased cow fertility performance improve the threshold economic value proposed in this study. Therefore, animal breeding strategies directed towards sustainable dairy farming at the systems level should be focused on achieving these traits in combination.
The authors gratefully acknowledge the financial support provided by the DEFRA (project IS0214) and BBSRC. Thanks are also extended to Elaine Jewkes and two anonymous referees for their constructive comments.