1 Introduction
Numerous animals including fish, whales, dolphins, birds, bats and insects use appendages (fins and wings) with varying levels of flexibility and/or compliance, to provide propulsion and/or weight support as they move through either air or water (e.g. Childress Reference Childress1981; Blake Reference Blake1983). Scientists have explored many different aspects of biological swimming and flying, such as flapping and flexibility effects, in an attempt to understand the underlying physical mechanisms and to apply them to engineering applications. Compliant membranes, used by bats, flying squirrels, lemurs and other animals define a specific subset of this class of flexible aerodynamic structures. These wings are of particular interest due to their negligible thicknesses and large shape deformations in both steady and unsteady conditions. In this paper, we discuss the aerodynamic characteristics of a flapping, compliant membrane wing.
1.1 Fixed membrane wings
The analysis of membrane wings dates back to the classical work of Thwaites (Reference Thwaites1961) and Nielsen (Reference Nielsen1963), who derived and solved the ‘sail equation’, which describes the relationship between tension, aerodynamic load and deflection for inextensible sails. Newman (Reference Newman1987) provides a review of these early works, which use attached potential flow to predict the steady membrane shape. More recently, Smith & Shyy (Reference Smith and Shyy1995b , Reference Smith and Shyy1996) developed a computational model for the coupled membrane and fluid (Navier–Stokes) equations, and used it to obtain steady solutions for extensible membranes with and without pretension, as well as for inextensible membranes with excess length. Comparing their full viscous solution with a potential-based model and with experimental results, they showed that a potential flow model can provide a good solution for small camber and incidence angles.
Song et al. (Reference Song, Tian, Israeli, Galvao, Bishop, Swartz and Breuer2008) suggested a simple analytic model linking the steady membrane deformation to the aerodynamic force. By assuming that load distribution is uniform, a simple expression for the maximum camber versus coefficient of lift was found to agree surprisingly well with experimental data over a wide range of aerodynamic and membrane prestretch conditions. They also demonstrated that, due to their self-cambering property, compliant membrane wings exhibit several beneficial characteristics, such as a steeper lift slope, larger maximum lift coefficient and delayed and softer stall characteristics as compared with their inextensible counterparts. Waldman & Breuer (Reference Waldman and Breuer2017) further expanded Song et al.’s approach by adding an inviscid, aerodynamic model for the coefficient of lift (assuming a Joukowski airfoil) while maintaining the uniform load assumption. This allowed maximum camber to be predicted with surprising good fidelity, knowing only the membrane and fluid properties and the angle of attack.
1.2 Rigid flapping wings
Forces associated with flapping (either heaving and/or pitching) rigid foils have been extensively studied experimentally (e.g. Triantafyllou, Triantafyllou & Gopalkrishnan Reference Triantafyllou, Triantafyllou and Gopalkrishnan1991; Godoy-Diana, Aider & Wesfreid Reference Godoy-Diana, Aider and Wesfreid2008; Bohl & Koochesfahani Reference Bohl and Koochesfahani2009), theoretically (e.g. Theodorsen Reference Theodorsen1935; Garrick Reference Garrick1936; Fernandez-Feria Reference Fernandez-Feria2016) and numerically (e.g. Das, Shukla & Govardhan Reference Das, Shukla and Govardhan2016; Deng et al. Reference Deng, Sun, Teng, Pan and Shao2016; Andersen et al. Reference Andersen, Bohr, Schnipper and Walther2017), yielding an extensive body of literature outlining flow regimes associated with both propulsion and drag. In potential flow, and allowing for vortex shedding, a rigid, heaving foil generates thrust at all frequencies, while a pitching foil generates drag at low frequencies, which transitions to thrust as the frequency is increased (Garrick Reference Garrick1936). At low Reynolds numbers, rigid foils operated in pure heave or pure pitch experience drag at low frequencies due to viscous effects (Das et al. Reference Das, Shukla and Govardhan2016). In a combination of pitching and heaving motion, the propulsion/drag depends on the phase difference between pitching and heaving (Jones & Platzer Reference Jones and Platzer1997).
1.3 Flexible flapping wings
The introduction of flexibility adds a new degree of complexity, and most efforts have focused on inextensible structures with a finite bending stiffness actuated at the leading edge, but free to move at the trailing edge. We refer to these as flexible plates, in contrast to compliant membranes, that are extensible but with zero bending stiffness. Numerous studies have identified enhanced propulsive performance associated with a finite bending stiffness (e.g. Heathcote & Gursul Reference Heathcote and Gursul2007; Dewey et al. Reference Dewey, Boschitsch, Moored, Stone and Smits2013; Moored et al. Reference Moored, Dewey, Boschitsch, Smits and Haj-Hariri2014; Quinn, Lauder & Smits Reference Quinn, Lauder and Smits2015; Olivier & Dumas Reference Olivier and Dumas2016; Paraz, Schouveiler & Eloy Reference Paraz, Schouveiler and Eloy2016). Similarly, for the less-studied case of flapping, compliant membrane wings with both leading and trailing edge support and zero bending stiffness, compliance has been shown to increase the average lift (Attar et al. Reference Attar, Gordnier, Johnston, Romberg and Parthasarathy2011), thrust and efficiency (Banerjee & Patil Reference Banerjee and Patil2008; Jaworski & Gordnier Reference Jaworski and Gordnier2012, Reference Jaworski and Gordnier2015), as compared to rigid wings. All of these studies on flapping membranes focused on relatively low flapping frequencies, well below any resonant frequency inherent in the structure. Flapping flexible plates were shown to exhibit a peak in thrust at the resonant frequency (e.g. Michelin & Llewellyn Smith Reference Michelin and Llewellyn Smith2009; Moore Reference Moore2014, Reference Moore2015; Paraz et al. Reference Paraz, Schouveiler and Eloy2016; Moore Reference Moore2017). However, increasing the flexibility, so that the flapping frequency lies above the resonance frequency, results in a transition to drag, as observed in the numerical simulation by Michelin & Llewellyn Smith (Reference Michelin and Llewellyn Smith2009) and in the analytical model by Moore (Reference Moore2014).
There have also been some efforts to develop theoretical models for the fluid–structure interaction with flapping flexible foils, which may shed light on the underlying physics without the need for a time-consuming, high fidelity numerical simulation. Alben (Reference Alben2008, Reference Alben2009) proposed such a model based on potential flow theory with a vortex sheet wake coupled with a structural beam model. More recently, Moore (Reference Moore2014, Reference Moore2015, Reference Moore2017) suggested a more computationally efficient formulation for the problem, where the coupling is based on pressure instead of vorticity. In recent work by Medina & Kang (Reference Medina and Kang2018), an analytic solution allows closed-form expressions for the lift, thrust and required input power to the problem of a flapping elastic plate. These low-amplitude models allow for extensive exploration of basic mechanisms in the fluid–structure interaction, including the improved aerodynamic performance around resonance, and the degradation in performance at higher flapping frequencies. However, to our knowledge, no such model has been extended to compliant tension-dominated membranes.
1.4 Damped resonant systems
It is also useful to analyse the problem of a flapping flexible or compliant wing in terms of a damped resonant system. Even in the absence of structural damping, the interaction with the fluid introduces added damping (as well as added mass) which may have a significant effect on the system response. A common approach to incorporate these forces is by using the semi-empirical Morison equation (Morison, Johnson & Schaaf Reference Morison, Johnson and Schaaf1950; Kang & Shyy Reference Kang and Shyy2014). In this formulation, the added mass effect is based on an analytic solution for a heaving, rigid plate (Katz & Plotkin Reference Katz and Plotkin2001), while the damping term is assumed to be quadratic in velocity, accounting for the effect of inertial fluid forces due to the transverse motion of the wing. In these models, the damping coefficient is found empirically, and may be a function of the Reynolds number, flapping frequency and flapping amplitude. Richards & Oshkai (Reference Richards and Oshkai2015) performed a damped oscillator analysis on a flapping flexible foil, and replaced the quadratic damping term with an equivalent linear term, which is simpler mathematically but maintains the energy dissipation over a flapping cycle. They were able to fit this model to experimental results, and used it to explain trends in the propulsive performance; for example, the higher thrust of stiffer and heavier foils, when compared to more flexible and lighter foils with equivalent resonant frequency. Alben (Reference Alben2008) also analysed the motion of a pitching flexible foil as a damped resonant system, using an analytical model. In the limit of large reduced frequency, he found that the damping coefficient scales with
 $1/k$
, where
 $k$
is the reduced frequency.
1.5 Wake structure
The generation of thrust or drag by any flapping structure is also reflected in a vortex wake structure; traditionally, drag is associated with a von Kármán vortex wake while thrust is associated with a reverse von Kármán wake (Pederzani & Haj-Hariri Reference Pederzani and Haj-Hariri2006). However, it has been observed that in some cases the transition between thrust and drag does not coincide with the transition in the wake structure. Godoy-Diana et al. (Reference Godoy-Diana, Aider and Wesfreid2008) used particle image velocimetry (PIV) to explore the wake structure and the propulsive performance of a pitching rigid foil, and reported that the transition in the wake structure precedes the thrust/drag transition. This has been confirmed by Bohl & Koochesfahani (Reference Bohl and Koochesfahani2009), who measured the thrust from the measured velocity field using a control-volume approach which accounted for the unsteady fluctuations in velocity and pressure. Recent numerical studies on pure pitching and pure heaving rigid foils (Das et al.
Reference Das, Shukla and Govardhan2016; Deng et al.
Reference Deng, Sun, Teng, Pan and Shao2016) at low Reynolds numbers (
 $Re\leqslant 2000$
) also showed that the thrust/drag transition frequency exceeds the one for wake structure transition.
The focus of the current paper is to extend the approach of Moore (Reference Moore2014, Reference Moore2015, Reference Moore2017) to the case of compliant membrane wings over a wide range of parameters that define the structural and flapping conditions. Using this approach we will explore the thrust/drag characteristics of these wings, and its relationship to the vortex wake structure. In § 2, we outline a general theoretical approach for treating the fluid–structure interaction with compliant membranes, both at a fixed angle of attack and subject to sinusoidal heaving and/or pitching motions. We use a high-order numerical technique to solve the resulting system of linear ordinary differential equations. In the current manuscript we only consider the cases of static, and heaving wings. The effect of wing compliance, inertia and flapping frequency are systematically explored in § 3, where we also develop a simple damped oscillator model to quantify the effects of added mass and fluid damping on the flapping membrane. The semi-empirical analytic model is used to characterize the behaviour near resonance, identifying the resonant frequency, added mass and fluid damping, as well as the conditions governing the generation of thrust or drag.
2 Analytic formulation
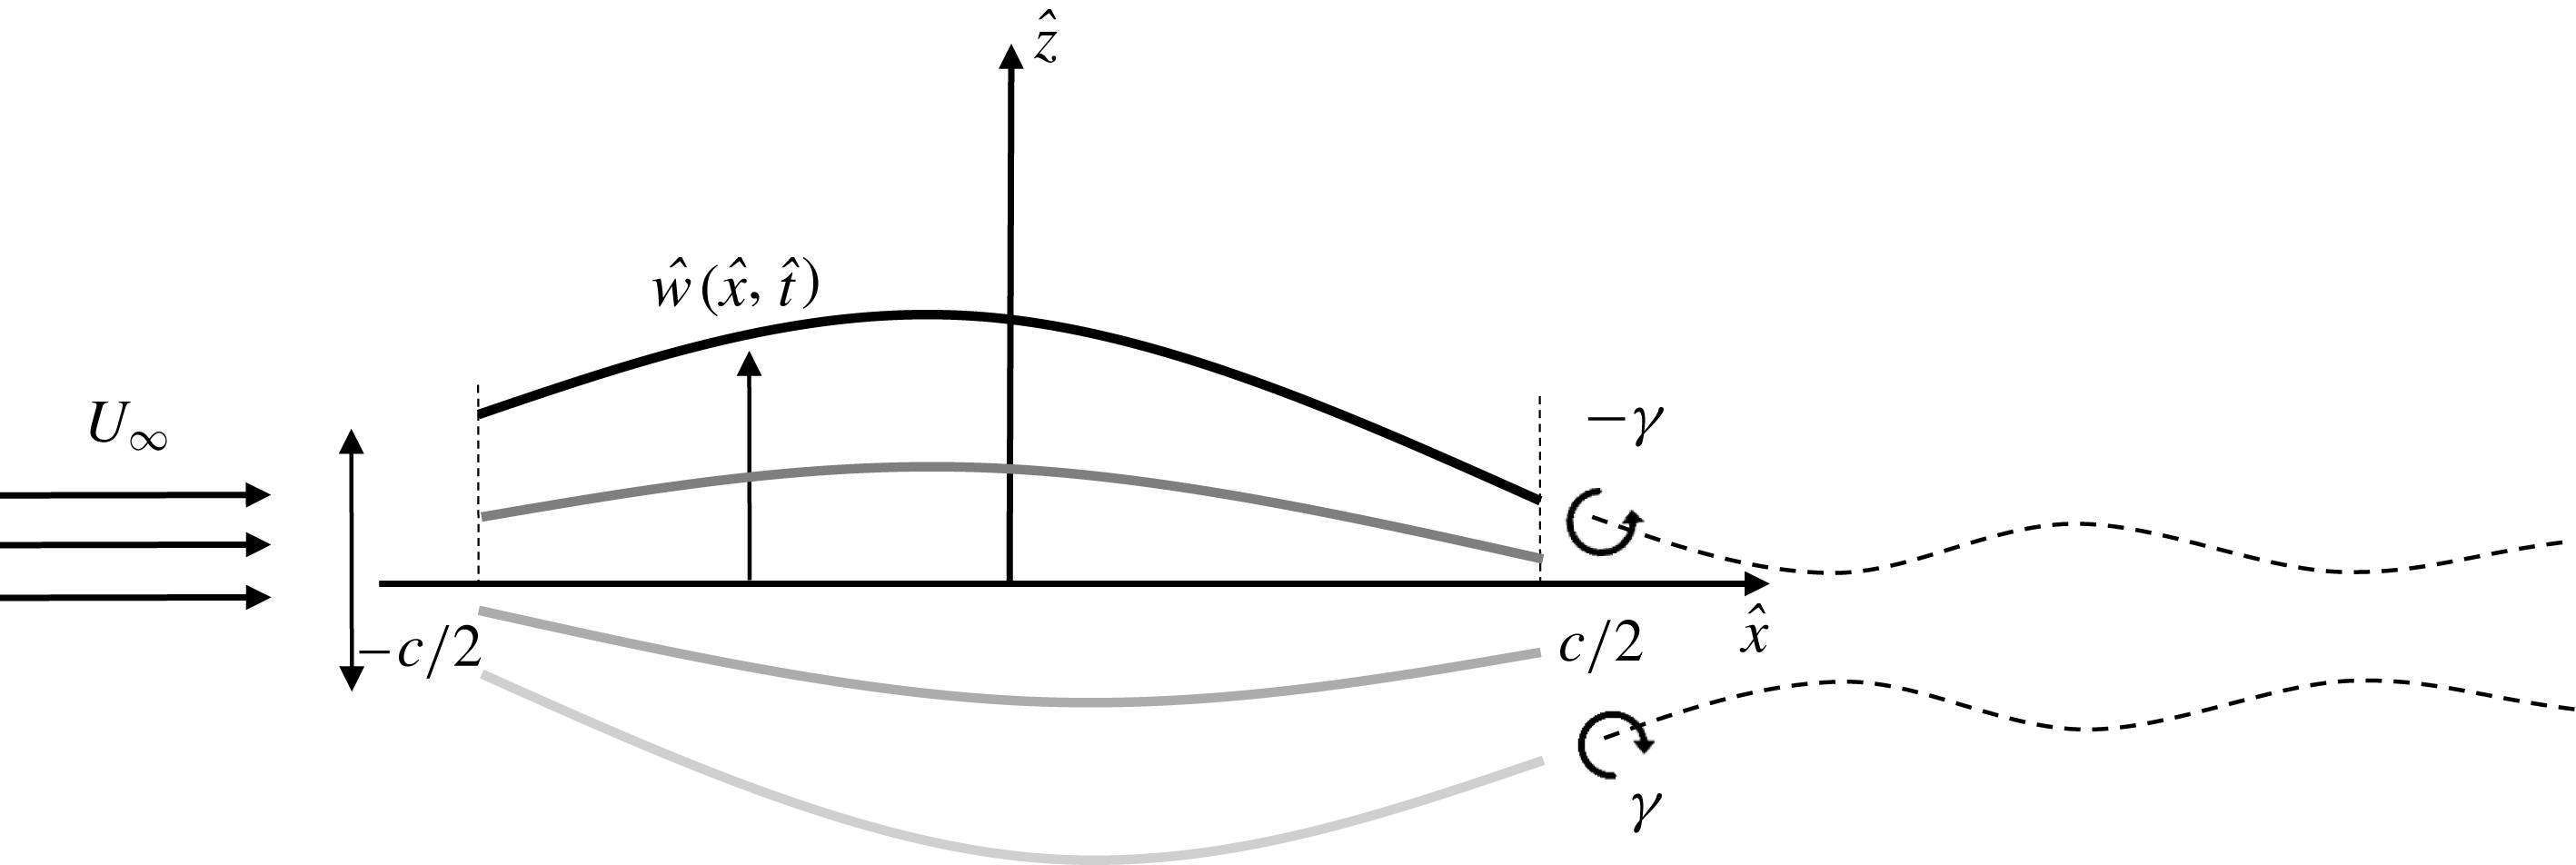
Consider a one-dimensional, linear elastic membrane wing of chord
 $c$
in a uniform flow field with free-stream velocity
 $U_{\infty }$
. The leading and trailing edges of the membrane may be stationary, or perform a prescribed periodic motion as illustrated in figure 1. In general, the membrane deflection,
 ${\hat{w}}(\hat{x},\hat{t})$
, is governed by the nonlinear, unsteady structural equation (Smith & Shyy Reference Smith and Shyy1995a
; Gordnier Reference Gordnier2009):
 $$\begin{eqnarray}\unicode[STIX]{x1D70C}_{m}h\frac{\unicode[STIX]{x2202}^{2}{\hat{w}}}{\unicode[STIX]{x2202}\hat{t}^{2}}-\unicode[STIX]{x1D70F}\unicode[STIX]{x1D705}=\unicode[STIX]{x0394}\hat{p}(\hat{x},\hat{t}),\end{eqnarray}$$
where
 $\unicode[STIX]{x1D70C}_{m},h,\unicode[STIX]{x1D70F}$
and
 $\unicode[STIX]{x1D705}$
are the membrane density, thickness, tension and curvature, respectively, and we denote dimensional variables using the hat symbol.
 $\unicode[STIX]{x0394}\hat{p}$
is the aerodynamic pressure acting on the membrane, which is obtained using thin airfoil theory, and will be described below. The curvature,
 $\unicode[STIX]{x1D705}$
, and the tension,
 $\unicode[STIX]{x1D70F}$
, of the membrane can be expressed in terms of its deflection,
 ${\hat{w}}(x)$
:
 $$\begin{eqnarray}\displaystyle & \displaystyle \unicode[STIX]{x1D705}=\frac{\unicode[STIX]{x2202}^{2}{\hat{w}}}{\unicode[STIX]{x2202}\hat{x}^{2}}\left[1+\left(\frac{\unicode[STIX]{x2202}{\hat{w}}}{\unicode[STIX]{x2202}\hat{x}}\right)^{2}\right]^{-3/2}, & \displaystyle\end{eqnarray}$$
 $$\begin{eqnarray}\displaystyle & \displaystyle \unicode[STIX]{x1D70F}=Eh\left[\frac{\unicode[STIX]{x1D706}_{0}}{c}\int _{-c/2}^{c/2}\sqrt{1+\left(\frac{\unicode[STIX]{x2202}{\hat{w}}}{\unicode[STIX]{x2202}\hat{x}}\right)^{2}}\text{d}\hat{x}-1\right], & \displaystyle\end{eqnarray}$$
where
 $\unicode[STIX]{x1D706}_{0}$
is the membrane prestretch:
 $$\begin{eqnarray}\unicode[STIX]{x1D706}_{0}=\frac{c}{L_{0}},\end{eqnarray}$$
and
 $L_{0}$
is the initial length of the membrane.
Schematic of the flapping membrane wing. The shading of the membrane indicate the different phases of the flapping cycle. A reverse von Kármán street is shed behind the membrane, illustrated by a dashed line. Although the theoretical model assumes that the wake lies along the
 $x$
-axis, a wavy line is shown to represent the spatio-temporal fluctuations of vorticity.

We scale all parameters with the half-chord,
 $c/2$
, and the convective time scale,
 $c/(2U_{\infty })$
; pressure is scaled by the dynamic pressure,
 $\unicode[STIX]{x1D70C}U_{\infty }^{2}/2$
. The resulting non-dimensional equation for the membrane becomes:
 $$\begin{eqnarray}4R\frac{\unicode[STIX]{x2202}^{2}w}{\unicode[STIX]{x2202}t^{2}}-2Ae\left[\frac{\unicode[STIX]{x1D706}_{0}}{2}\int _{-1}^{1}\sqrt{1+\left(\frac{\unicode[STIX]{x2202}w}{\unicode[STIX]{x2202}x}\right)^{2}}\text{d}x-1\right]\left[1+\left(\frac{\unicode[STIX]{x2202}w}{\unicode[STIX]{x2202}x}\right)^{2}\right]^{-3/2}\frac{\unicode[STIX]{x2202}^{2}w}{\unicode[STIX]{x2202}x^{2}}=\unicode[STIX]{x0394}C_{p},\end{eqnarray}$$
where the aeroelastic number,
 $Ae$
, and the mass ratio,
 $R$
, are given by:
 $$\begin{eqnarray}\displaystyle Ae=\frac{Eh}{{\textstyle \frac{1}{2}}\unicode[STIX]{x1D70C}U_{\infty }^{2}c},\quad R=\frac{\unicode[STIX]{x1D70C}_{m}h}{\unicode[STIX]{x1D70C}c}. & & \displaystyle\end{eqnarray}$$
To solve this equation, we explore two limiting cases. Firstly, we take the time derivative to be zero and solve the case of a steady membrane at a fixed angle of attack. Secondly, we linearize the unsteady problem to study a membrane flapping at low amplitude. Details of the two solutions are given below.
2.1 Steady membrane at fixed angle of attack
In the steady case, the membrane equation (2.1) reduces to the Young–Laplace equation, which governs the static equilibrium shape of a membrane under a pressure load (see Waldman & Breuer Reference Waldman and Breuer2017):
 $$\begin{eqnarray}\unicode[STIX]{x1D705}+\frac{\unicode[STIX]{x0394}\hat{p}}{\unicode[STIX]{x1D70F}}=0.\end{eqnarray}$$
In non-dimensional form, the Young–Laplace equation (2.7) is written:
 $$\begin{eqnarray}\frac{\text{d}^{2}w}{\text{d}x^{2}}=-\unicode[STIX]{x0394}C_{p}\left[1+\left(\frac{\text{d}w}{\text{d}x}\right)^{2}\right]^{3/2}\cdot \left\{2Ae\left[\frac{\unicode[STIX]{x1D706}_{0}}{2}\int _{-1}^{1}\sqrt{1+\left(\frac{\text{d}w}{\text{d}x}\right)^{2}}\text{d}x-1\right]\right\}^{-1}.\end{eqnarray}$$
In the present analysis, the pressure term,
 $\unicode[STIX]{x0394}C_{p}$
, is obtained from thin airfoil theory (Katz & Plotkin Reference Katz and Plotkin2001) for a given angle of attack
 $\unicode[STIX]{x1D6FC}$
. Using the transformation
 $x=-\text{cos}\,\unicode[STIX]{x1D703}$
, the pressure coefficient can be written as:
 $$\begin{eqnarray}\unicode[STIX]{x0394}C_{p}=4\left[\left(\unicode[STIX]{x1D6FC}-\frac{1}{\unicode[STIX]{x03C0}}\int _{0}^{\unicode[STIX]{x03C0}}\frac{\text{d}w}{\text{d}x}\,\text{d}\unicode[STIX]{x1D703}\right)\cot \frac{\unicode[STIX]{x1D703}}{2}+\frac{2}{\unicode[STIX]{x03C0}}\mathop{\sum }_{n=1}^{\infty }\left(\int _{0}^{\unicode[STIX]{x03C0}}\frac{\text{d}w}{\text{d}x}\cos n\unicode[STIX]{x1D703}\,\text{d}\unicode[STIX]{x1D703}\cdot \sin n\unicode[STIX]{x1D703}\right)\right].\end{eqnarray}$$
The structural and aerodynamic equations ((2.8) and (2.9)), together with the boundary conditions
 $w(0)=w(1)=0$
, are solved iteratively using a Chebyshev collocation method (Mason & Handscomb Reference Mason and Handscomb2002) for any combination of the input parameters: the angle of attack,
 $\unicode[STIX]{x1D6FC}$
, the membrane prestretch,
 $\unicode[STIX]{x1D706}_{0}$
, and the aeroelastic number,
 $Ae$
.
2.2 Pitching and heaving membrane
For the unsteady case, we linearize the membrane equation (2.5) for small deflections:
 $$\begin{eqnarray}4R\frac{\unicode[STIX]{x2202}^{2}w}{\unicode[STIX]{x2202}t^{2}}-2Ae(\unicode[STIX]{x1D706}_{0}-1)\frac{\unicode[STIX]{x2202}^{2}w}{\unicode[STIX]{x2202}x^{2}}=\unicode[STIX]{x0394}C_{p}.\end{eqnarray}$$
The leading and trailing edges of the membrane perform a periodic motion of reduced frequency
 $k=\unicode[STIX]{x03C0}\hat{f}c/U_{\infty }$
, where
 $\hat{f}$
is the dimensional frequency.
Following Wu (Reference Wu1961), the pressure difference across the membrane is obtained from unsteady thin airfoil theory, under the assumptions of two-dimensional potential flow with small-amplitude deflections. The model includes the shedding of a planar vortex wake from the trailing edge. We assume the wing is performing time-harmonic motion of the form:
 $$\begin{eqnarray}w(x,t)=W(x)\text{e}^{jkt}=\left[\frac{\unicode[STIX]{x1D6FD}_{0}}{2}+\mathop{\sum }_{n=1}^{\infty }\unicode[STIX]{x1D6FD}_{n}\cos (n\unicode[STIX]{x1D703})\right]\text{e}^{jkt},\end{eqnarray}$$
in which case the resulting pressure jump on the membrane is also time harmonic and given by
 $\unicode[STIX]{x0394}C_{p}(x,t)=P(x)\text{e}^{jkt}$
, where
 $$\begin{eqnarray}P(x)=a_{0}\sqrt{\frac{1-x}{1+x}}+2\mathop{\sum }_{n=1}^{\infty }a_{n}\sin (n\arccos x)\end{eqnarray}$$
and the coefficients,
 $a_{n}$
, depend linearly on the deflection,
 $W(x)$
(Wu Reference Wu1961; Moore Reference Moore2014). Using this result from thin airfoil theory, (2.12), a linear ordinary differential equation (ODE) is obtained:
 $$\begin{eqnarray}[-4Rk^{2}-2Ae(\unicode[STIX]{x1D706}_{0}-1){\mathcal{D}}^{2}]W(x)=P(x),\end{eqnarray}$$
where
 ${\mathcal{D}}\equiv \text{d}/\text{d}x$
.
Boundary conditions for a pitching and heaving wing are defined by the motion of the chord line, connecting the leading and trailing edges. After non-dimensionalization, linearization and the assumption of harmonic motion, these are given by:
 $$\begin{eqnarray}\displaystyle \left.\begin{array}{@{}c@{}}W(-1)=A_{0}+(1+x_{h})\tan (\unicode[STIX]{x1D703}_{0}\cos (\unicode[STIX]{x1D719}))-j(1+x_{h})\tan (\unicode[STIX]{x1D703}_{0}\sin (\unicode[STIX]{x1D719})),\\ W(1)=A_{0}-(1-x_{h})\tan (\unicode[STIX]{x1D703}_{0}\cos (\unicode[STIX]{x1D719}))+j(1-x_{h})\tan (\unicode[STIX]{x1D703}_{0}\sin (\unicode[STIX]{x1D719})),\end{array}\right\} & & \displaystyle\end{eqnarray}$$
where the amplitude of the motion is defined by the heaving amplitude
 $A_{0}$
, the pitching amplitude
 $\unicode[STIX]{x1D703}_{0}$
, the phase difference
 $\unicode[STIX]{x1D719}$
and the pitching reference point
 $x_{h}$
. Note that these boundary conditions do not constrain the membrane angle at the leading and trailing edge. The current study focuses on membranes performing pure heaving motion (
 $\unicode[STIX]{x1D703}_{0}=0$
). Since the unsteady analysis is linear, the normalized flapping amplitude,
 $A_{0}$
, is arbitrary and chosen to be one for convenience. We note that the commonly used Strouhal number,
 $St=2\hat{f}A_{0}/U_{\infty }$
(Triantafyllou et al.
Reference Triantafyllou, Triantafyllou and Gopalkrishnan1991), is equivalent to the reduced frequency,
 $k$
.
The spatial ODE (2.13), together with the boundary conditions (2.14), is discretized using a Chebyshev collocation method, and the resulting linear system is solved iteratively, following the procedure described by Moore (Reference Moore2015, Reference Moore2017). The solution is obtained using the generalized minimal residual method (GMRES) (Saad & Schultz Reference Saad and Schultz1986) with a tolerance of
 $10^{-12}$
and using 32 collocation points, which was confirmed to be sufficient to achieve fully resolved solutions.
Once the membrane deflections and the corresponding pressure distribution are obtained, we can find the lift and thrust acting on the membrane. The lift coefficient is calculated as
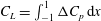 $C_{L}=\int _{-1}^{1}\unicode[STIX]{x0394}C_{p}\,\text{d}x$
. The thrust coefficient is the sum of two components:
 $C_{T}=C_{T_{P}}+C_{T_{S}}$
, where
 $C_{T_{P}}=\int _{-1}^{1}\unicode[STIX]{x0394}C_{p}(\unicode[STIX]{x2202}w/\unicode[STIX]{x2202}x)\,\text{d}x$
results from pressure differences over the membrane, and
 $C_{T_{S}}$
represents the leading edge suction (Wu Reference Wu1961; Moore Reference Moore2014). To evaluate the aerodynamic performance of the membrane, we calculate the maximum lift and average thrust coefficients over a cycle (note that the average lift over a heaving cycle is zero).
The aerodynamic model includes the shedding of a vortex sheet from the trailing edge, and its strength can be found from the tangential velocity jump across the wake (Wu Reference Wu1961). The planar wake in this model has a sinusoidal vorticity distribution, and is advected downstream at the free-stream velocity. This leads to the following form of the vortex sheet strength:
 $$\begin{eqnarray}\displaystyle \unicode[STIX]{x1D6FE}_{wake}=H(k)\text{e}^{jk[t-(x-1)]}, & & \displaystyle\end{eqnarray}$$
where
 $H(k)$
is a complex transfer function relating the wake vorticity to the flapping motion. The phase of the transfer function determines the wake structure: if
 $\text{Re}\{H(k)\}<0$
(or a phase between
 $\unicode[STIX]{x03C0}/2$
and
 $3\unicode[STIX]{x03C0}/2$
), then the shed vorticity is negative at the beginning of the downstroke and positive at the beginning of the upstroke, corresponding to a reverse von Kármán wake that is generally associated with thrust. This case is illustrated in figure 1. Conversely,
 $\text{Re}\{H(k)\}>0$
corresponds to a ‘regular’ von Kármán wake, generally associated with drag. A transition in the wake structure is identified as
 $\angle H(k)=\unicode[STIX]{x03C0}/2$
.
3 Results and discussion
3.1 Steady membrane at fixed angle of attack
As suggested by Song et al. (Reference Song, Tian, Israeli, Galvao, Bishop, Swartz and Breuer2008), a useful non-dimensional number to parameterize the deformation of a membrane is a Weber number, which compares the aerodynamic pressure with the membrane tension:
 $$\begin{eqnarray}We=\frac{F_{L}}{Eh}=\frac{C_{L}}{Ae},\end{eqnarray}$$
where
 $F_{L}$
is the lift force per unit length, and
 $C_{L}$
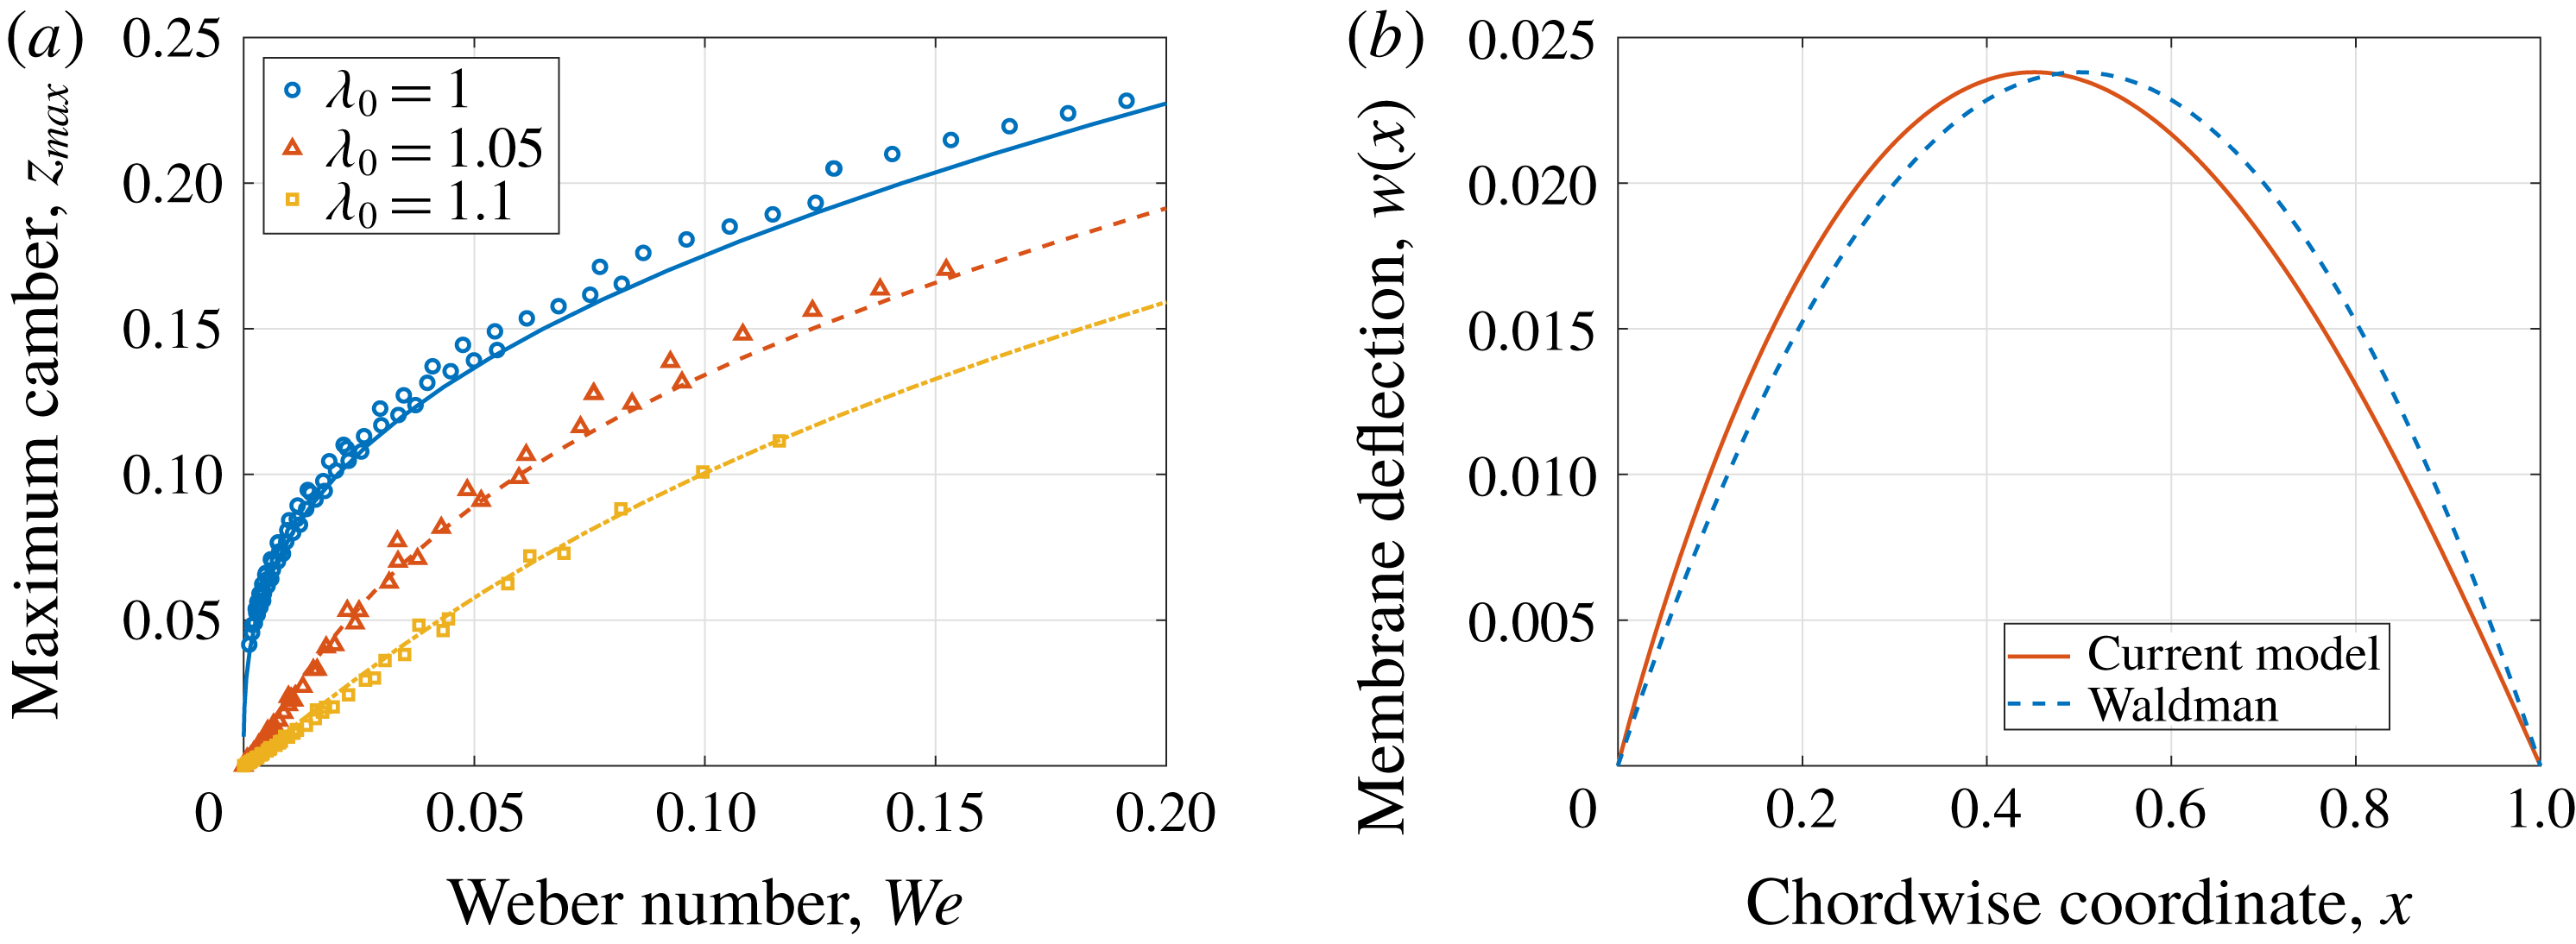
is the lift coefficient. Variation of the maximum camber with Weber number is presented in figure 2(a) for different values of prestretch,
 $\unicode[STIX]{x1D706}_{0}$
, and compared with the uniform-pressure model developed by Waldman & Breuer (Reference Waldman and Breuer2017). In that model, defining the aeroelastic number and the angle of attack uniquely determines both the maximum camber and the lift coefficient, and hence establishes a unique relationship between Weber number and maximum camber. However, in the current solution the lift coefficient also depends on the aeroelastic number through the coupled fluid–structure interaction. Therefore, different combinations of the aeroelastic number and the lift coefficient may lead to slightly different predictions of the maximum camber for the same value of the Weber number. This weak dependency was also seen by Waldman & Breuer (Reference Waldman and Breuer2017) in their numerical simulations that used XFOIL (Drela Reference Drela and Mueller1989) for the aerodynamic model coupled to a membrane model for the structure.
(a) Variation of maximum camber with Weber number, for different prestretch values. Symbols: current model, solid lines: model by Waldman & Breuer (Reference Waldman and Breuer2017). There is good agreement between the two models, validating the assumption of a uniform-pressure distribution along the chord. (b) Difference in membrane shape between the model by Waldman & Breuer (Reference Waldman and Breuer2017), assuming uniform-pressure distribution, and the current model. Solution obtained for
 $\unicode[STIX]{x1D6FC}=3^{\circ }$
,
 $Ae=30$
,
 $\unicode[STIX]{x1D706}_{0}=1.1$
.

Nonetheless, there is good general agreement between the two models, validating the simplified assumption of a uniform pressure distribution, at least for predictions of maximum camber. Not surprisingly, the differences lie in the membrane’s shape: while Waldman and Breuer’s model assumes that the membrane has the form of a circular arc, the current model allows an arbitrary shape for the deflection, resulting in a more complex shape with the maximum camber closer to the leading edge (figure 2 b).
3.2 Heaving membrane
The power of the current approach lies in its ability to predict the unsteady aero-mechanical performance of a compliant membrane. In order to explore the effect of the different parameters on the flapping membrane’s performance, the aeroelastic number,
 $Ae$
, the mass ratio,
 $R$
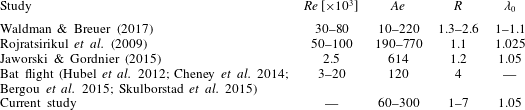
, and the reduced frequency were varied over a wide range, summarized in table 1. This range includes the experiments conducted by Rojratsirikul, Wang & Gursul (Reference Rojratsirikul, Wang and Gursul2009) and Waldman & Breuer (Reference Waldman and Breuer2017), both of whom measured the deformations of a fixed membrane in air, the numerical simulation by Jaworski & Gordnier (Reference Jaworski and Gordnier2015) for a two-dimensional flapping membrane at a Reynolds number of 2500, as well as an estimate of the parameters representing a biological flyer – a bat during steady flight (Hubel et al.
Reference Hubel, Hristov, Swartz and Breuer2012; Cheney et al.
Reference Cheney, Konow, Middleton, Breuer, Roberts, Giblin and Swartz2014; Bergou et al.
Reference Bergou, Swartz, Vejdani, Riskin, Reimnitz, Taubin and Breuer2015; Skulborstad, Swartz & Goulbourne Reference Skulborstad, Swartz and Goulbourne2015).
Summary of parameter ranges used in previous and current studies.

3.2.1 Membrane kinematics
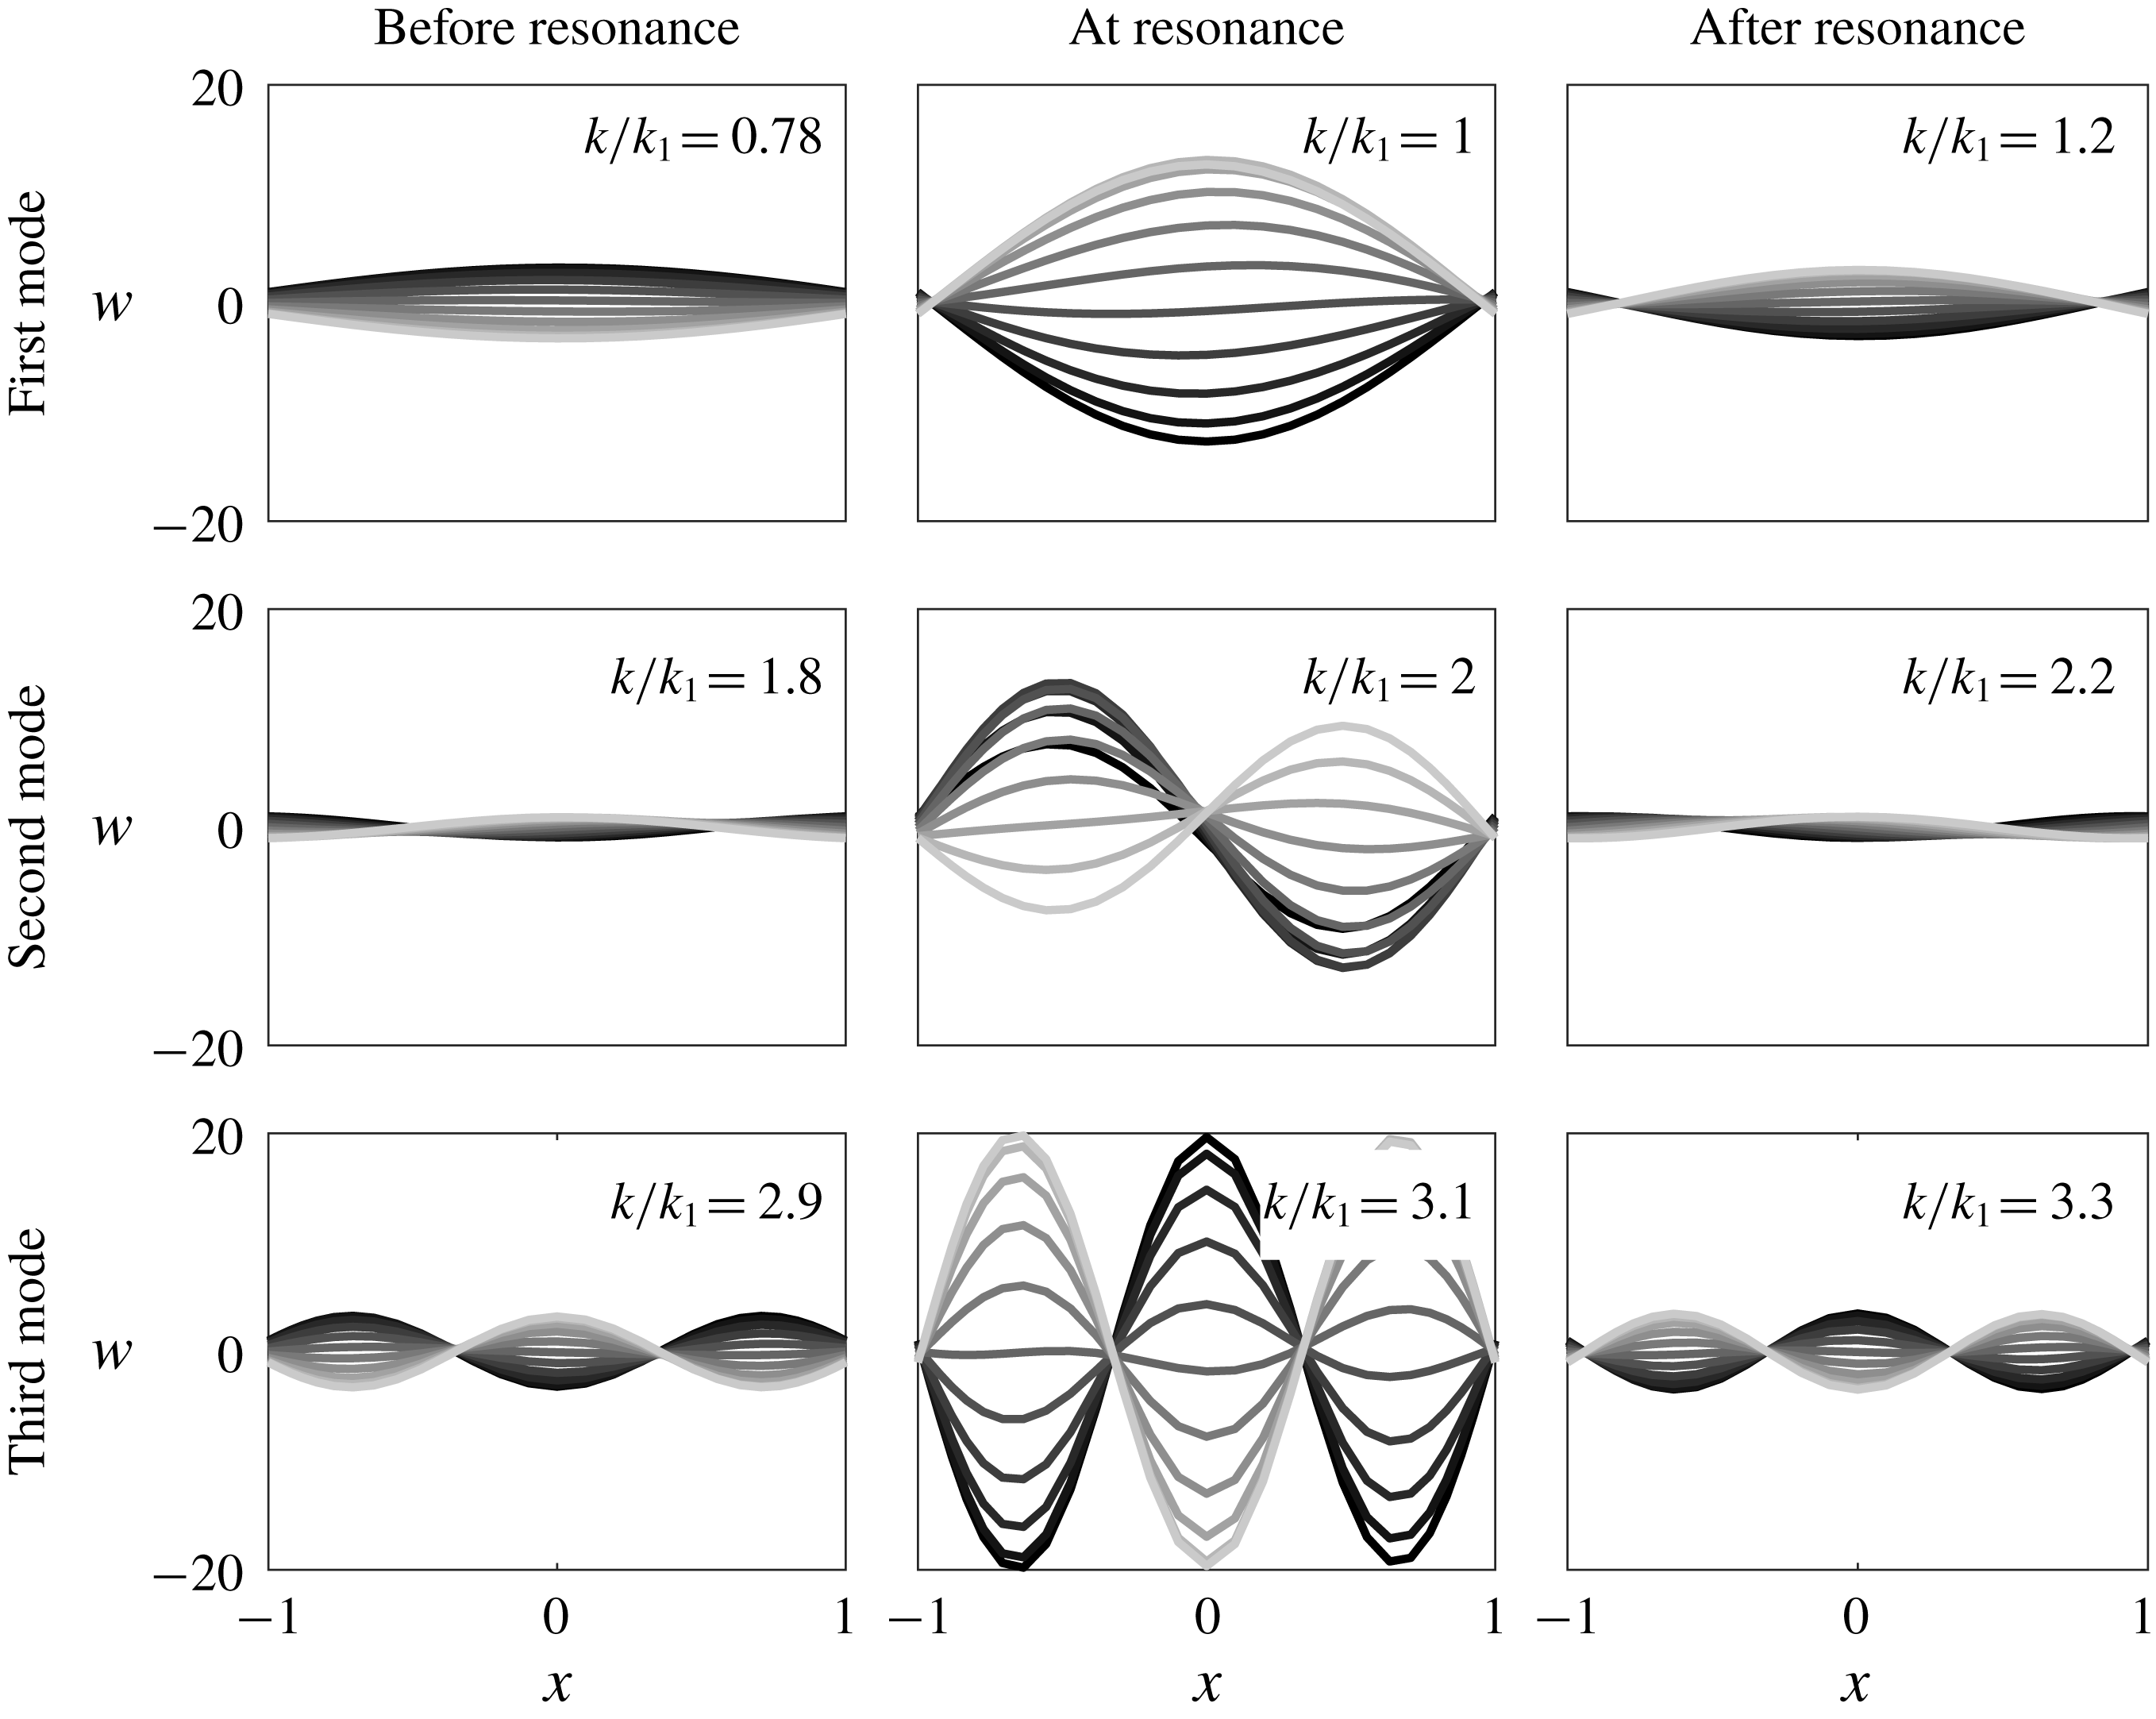
The deflections of a membrane in pure heave over half a cycle are presented in figure 3 for different values of the reduced frequency,
 $k$
, normalized by the natural frequency,
 $k_{1}$
, which is defined later (3.5). The amplitude of the membrane deflection is scaled by the amplitude of the leading and trailing edges’ motions. The central column corresponds to a membrane flapping at a resonant frequency, where the deflections are visibly larger. Note that the phase of the membrane deflection with respect to the motion of the leading and trailing edges changes as the frequency passes through the resonant condition.
Membrane in pure heave, deflections during downstroke for different values of the normalized frequency
 $k/k_{1}$
. Dark: beginning of the downstroke,
 $t/T=0$
; light: end of the downstroke,
 $t/T=0.5$
. Case parameters:
 $A_{0}=1$
,
 $Ae=120$
,
 $\unicode[STIX]{x1D706}_{0}=1.05$
,
 $R=4$
,
 $k_{1}=1.3$
. The different rows correspond to the first three resonant frequencies. For each row, the first plot is before resonant frequency, the middle plot is close to resonance (note the large deflections) and the third is after resonance. The different modes of vibrations become dominant at the different resonant frequencies. A phase shift in the membrane’s deflection occurs as the membrane passes through resonance.

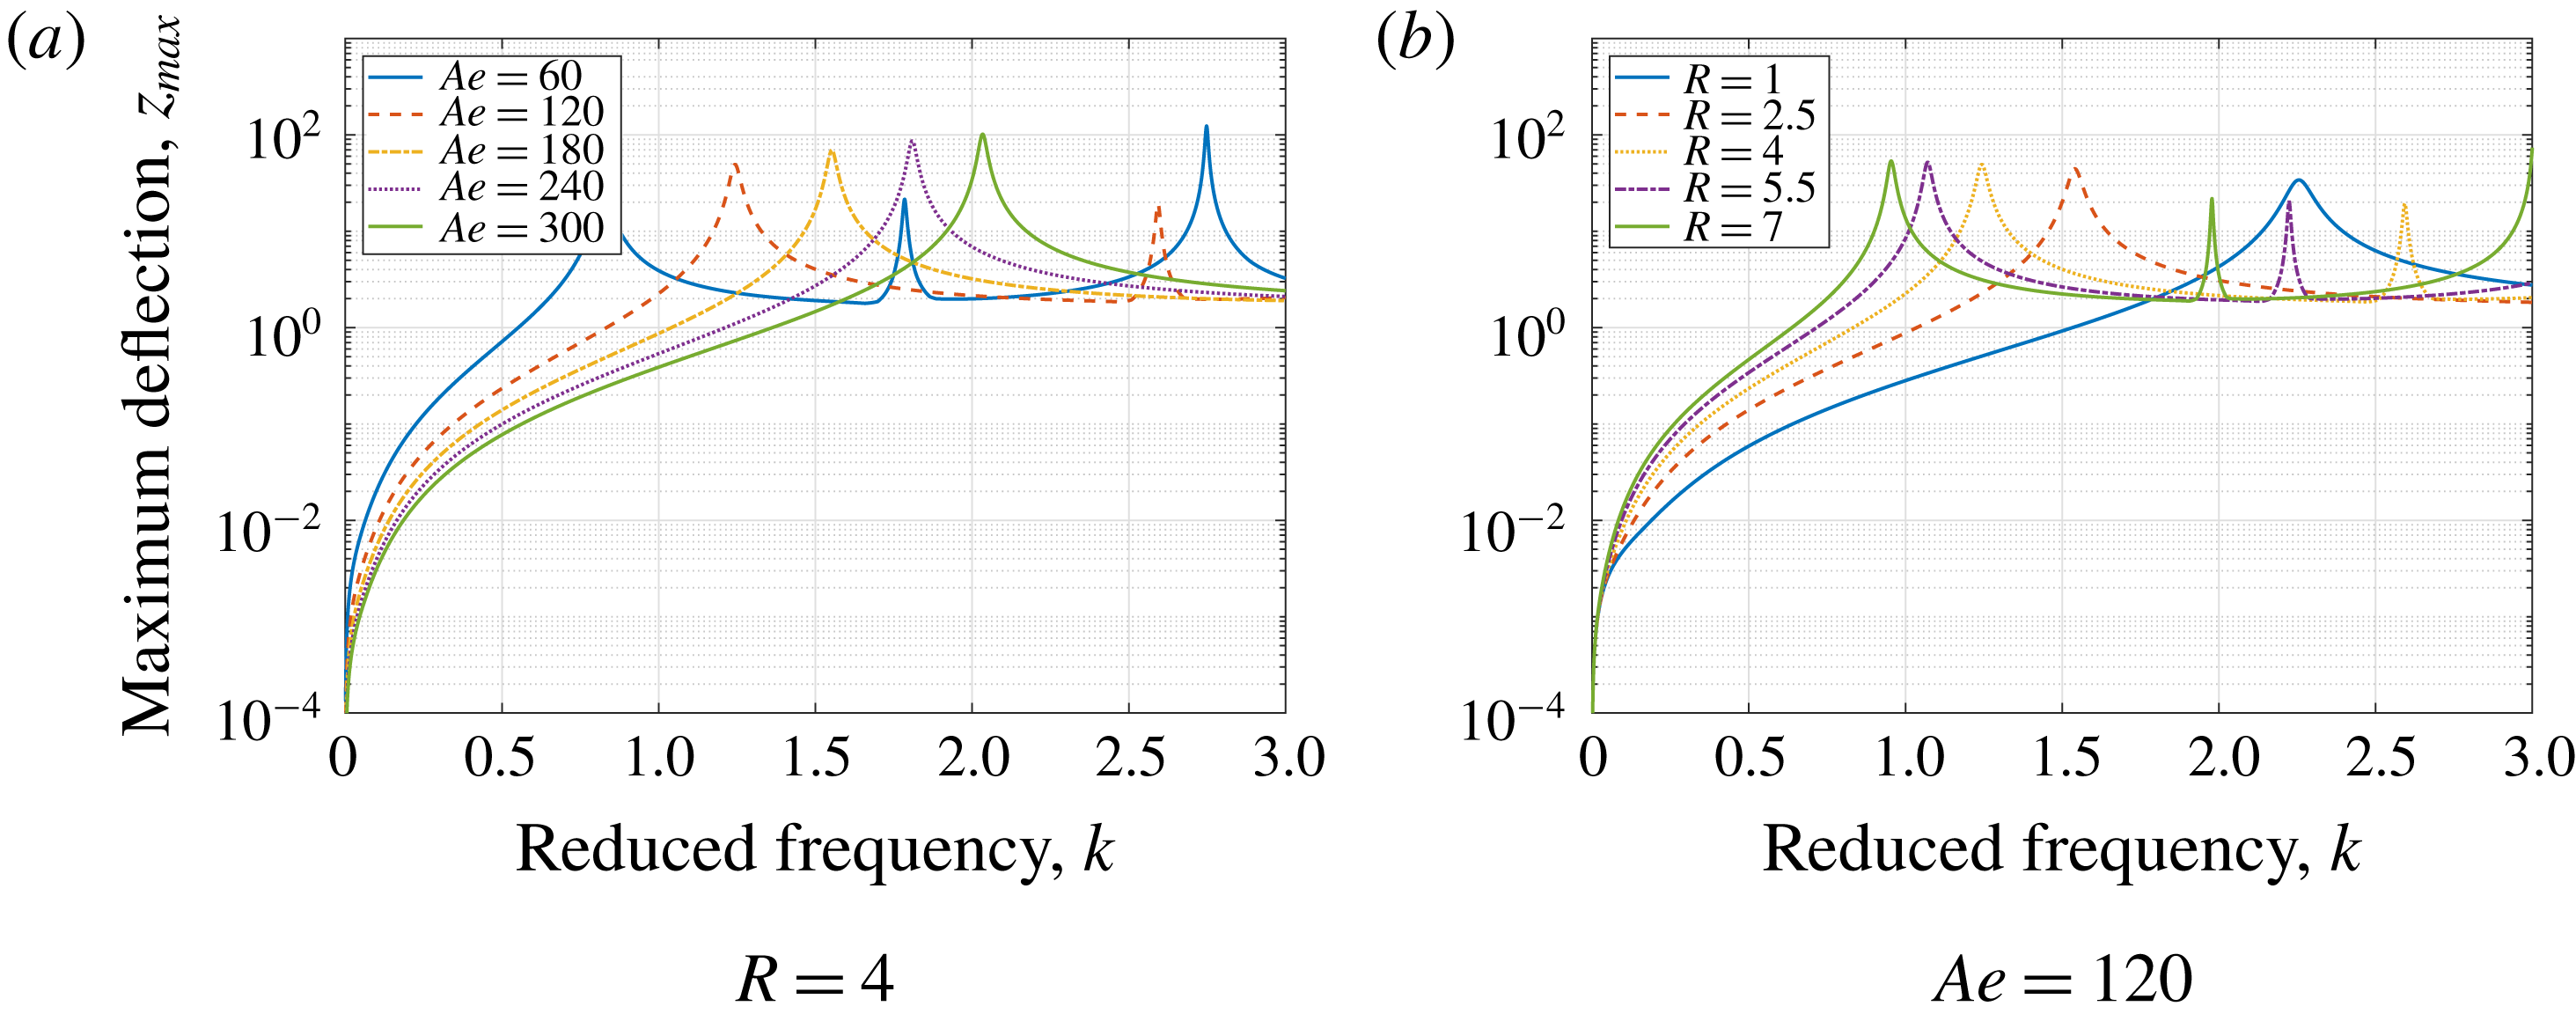
Membrane in pure heave, maximum deflection for different values of the reduced frequency
 $k$
. A clear resonant peak is observed for all membranes, and for some the second and third resonances also appear in the plotted range of flapping frequencies. The resonant frequency increases as the aeroelastic number is increased, and decreases when increasing the mass ratio.

The maximum deflection throughout the flapping cycle is defined as the maximum difference, over a cycle, between the membrane position and the position of a rigid plate performing the same heaving motion:
 $Z_{max}=\max (w(x,t)-w_{rigid}(x,t))$
. In figure 4, we display the maximum deflection for different values of the aeroelastic number (figure 4
a) and mass ratio (figure 4
b). For a low flapping frequency, the deflection in all cases is small, but increases with the reduced frequency until a resonant peak is observed. In some cases, a second and even third resonant peak is seen within the range of frequencies plotted.
The resonant frequency increases as the aeroelastic number is increased (figure 4
a), and decreases when increasing the mass ratio (figure 4
b). This suggests a connection between resonance and the natural frequency, as was also reported by Michelin & Llewellyn Smith (Reference Michelin and Llewellyn Smith2009). It is also apparent that the width of the resonant peak, which is related to damping in the system, depends on the parameters. In particular, the damping appears to be larger for low values of the mass ratio,
 $R$
.
To model the effect of the resonance and damping we employ a simple damped oscillator model, following the conceptual analysis suggested by Païdoussis, Price & de Langre (Reference Païdoussis, Price and de Langre2010). Considering the membrane equation (2.10), we assume sinusoidal deflection modes. Focusing on the first resonant frequency, where the first mode
 $w(x,t)\approx \unicode[STIX]{x1D702}(t)\cos (\unicode[STIX]{x03C0}x/2)$
is dominant (figure 3), we can then write a forced damped oscillator equation for the amplitude of the first mode,
 $\unicode[STIX]{x1D702}(t)$
:
 $$\begin{eqnarray}4R\ddot{\unicode[STIX]{x1D702}}+\frac{\unicode[STIX]{x03C0}^{2}}{2}Ae(\unicode[STIX]{x1D706}_{0}-1)\unicode[STIX]{x1D702}=F_{f}(\dot{\unicode[STIX]{x1D702}},\ddot{\unicode[STIX]{x1D702}}),\end{eqnarray}$$
where
 $F_{f}$
is the fluid forcing, which depends on the motion of the membrane. Suppose further that the fluid forcing,
 $F_{f}$
, may be expressed as the sum of two terms, dependent on the acceleration and velocity of the membrane:
 $$\begin{eqnarray}F_{f}(\dot{\unicode[STIX]{x1D702}},\ddot{\unicode[STIX]{x1D702}})=-4R_{A}\ddot{\unicode[STIX]{x1D702}}-2C_{damp}\dot{\unicode[STIX]{x1D702}},\end{eqnarray}$$
where the first and the second term represent the added mass and the fluid damping, respectively. The coefficients
 $R_{A}$
and
 $C_{damp}$
are unknown, and may or may not be constant with respect to the relevant parameters of the system. Using this form for the fluid forcing,
 $F_{f}$
, leads to the following damped oscillator equation:
 $$\begin{eqnarray}2(R+R_{A})\ddot{\unicode[STIX]{x1D702}}+C_{damp}\dot{\unicode[STIX]{x1D702}}+\frac{\unicode[STIX]{x03C0}^{2}}{4}Ae(\unicode[STIX]{x1D706}_{0}-1)\unicode[STIX]{x1D702}=0.\end{eqnarray}$$
Here we can identify the respective mass, damping and stiffness coefficients of the total system, which consists of both the membrane and the surrounding fluid. The natural frequency of this oscillator is written as:
 $$\begin{eqnarray}k_{1}=\frac{\unicode[STIX]{x03C0}}{\sqrt{8}}\sqrt{\frac{Ae(\unicode[STIX]{x1D706}_{0}-1)}{R+R_{A}}}.\end{eqnarray}$$
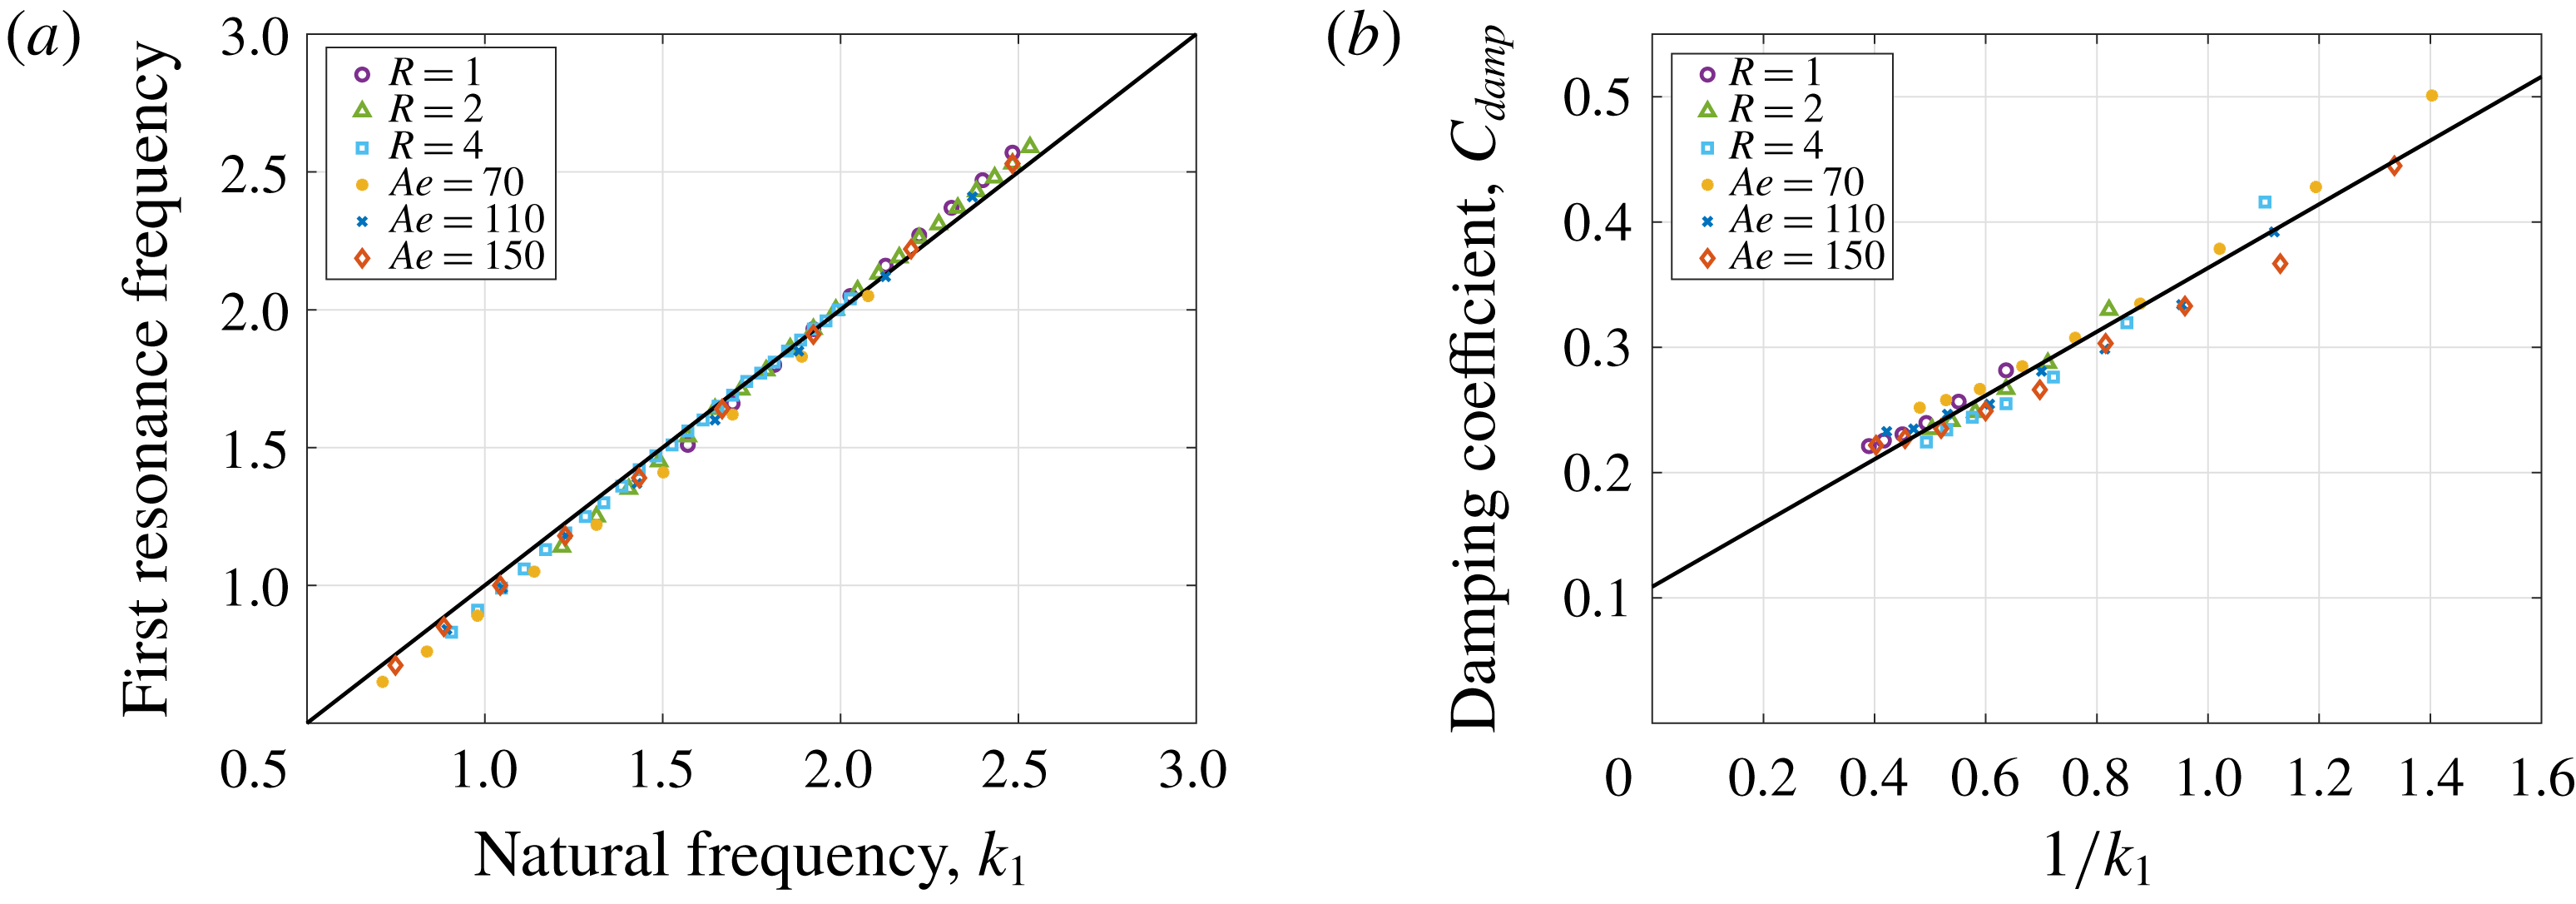
(a) Comparison of first resonant frequency with the membrane’s natural frequency, for membranes with different values of the aeroelastic number and mass ratio. Symbols: current model, solid line:
 $k_{1}$
. The added mass parameter is
 $R_{A}=0.5$
. (b) The damping coefficient, obtained from the deflection response using the half-power bandwidth method, plotted against
 $1/k_{1}$
for membranes with different parameters.

By comparing the observed value for the first natural frequency,
 $k_{1}$
, with the predicted value (3.5) we find that a value of
 $R_{A}=0.5$
is able to collapse the data over a range of values for
 $Ae$
and
 $R$
(figure 5
a). This is somewhat lower than the values calculated for a rigid heaving plate (
 $R_{A}=\unicode[STIX]{x03C0}/4$
, Katz & Plotkin Reference Katz and Plotkin2001) and for a vibrating membrane in still air (
 $R_{A}=0.68$
, Minami Reference Minami1998). The current model cannot be used to estimate
 $R_{A}$
for either a rigid plate or a membrane in still air, as these conditions lead to an infinite value of the aeroelastic number, and consequently, an infinite value of the natural frequency (3.5), regardless of the added mass coefficient.
From the simplified damped oscillator model (3.4) we can also find the relationship between the damping coefficient,
 $C_{damp}$
, and the damping ratio,
 $\unicode[STIX]{x1D701}$
:
 $$\begin{eqnarray}2\unicode[STIX]{x1D701}k_{1}=\frac{C_{damp}}{2(R+R_{A})}.\end{eqnarray}$$
Using the half-power bandwidth method (Thomson Reference Thomson1996), we obtain the damping coefficient around the first resonance from the deflection response for the range of parameters tested. The damping coefficient was found to scale with
 $1/k_{1}$
(figure 5
b). This is in agreement with Alben (Reference Alben2008) who developed an analytic model for a pitching flexible foil with a free trailing edge and found that, in the limit of large reduced frequency, the damping coefficient also scales with
 $1/k$
.
3.2.2 Aerodynamic performance
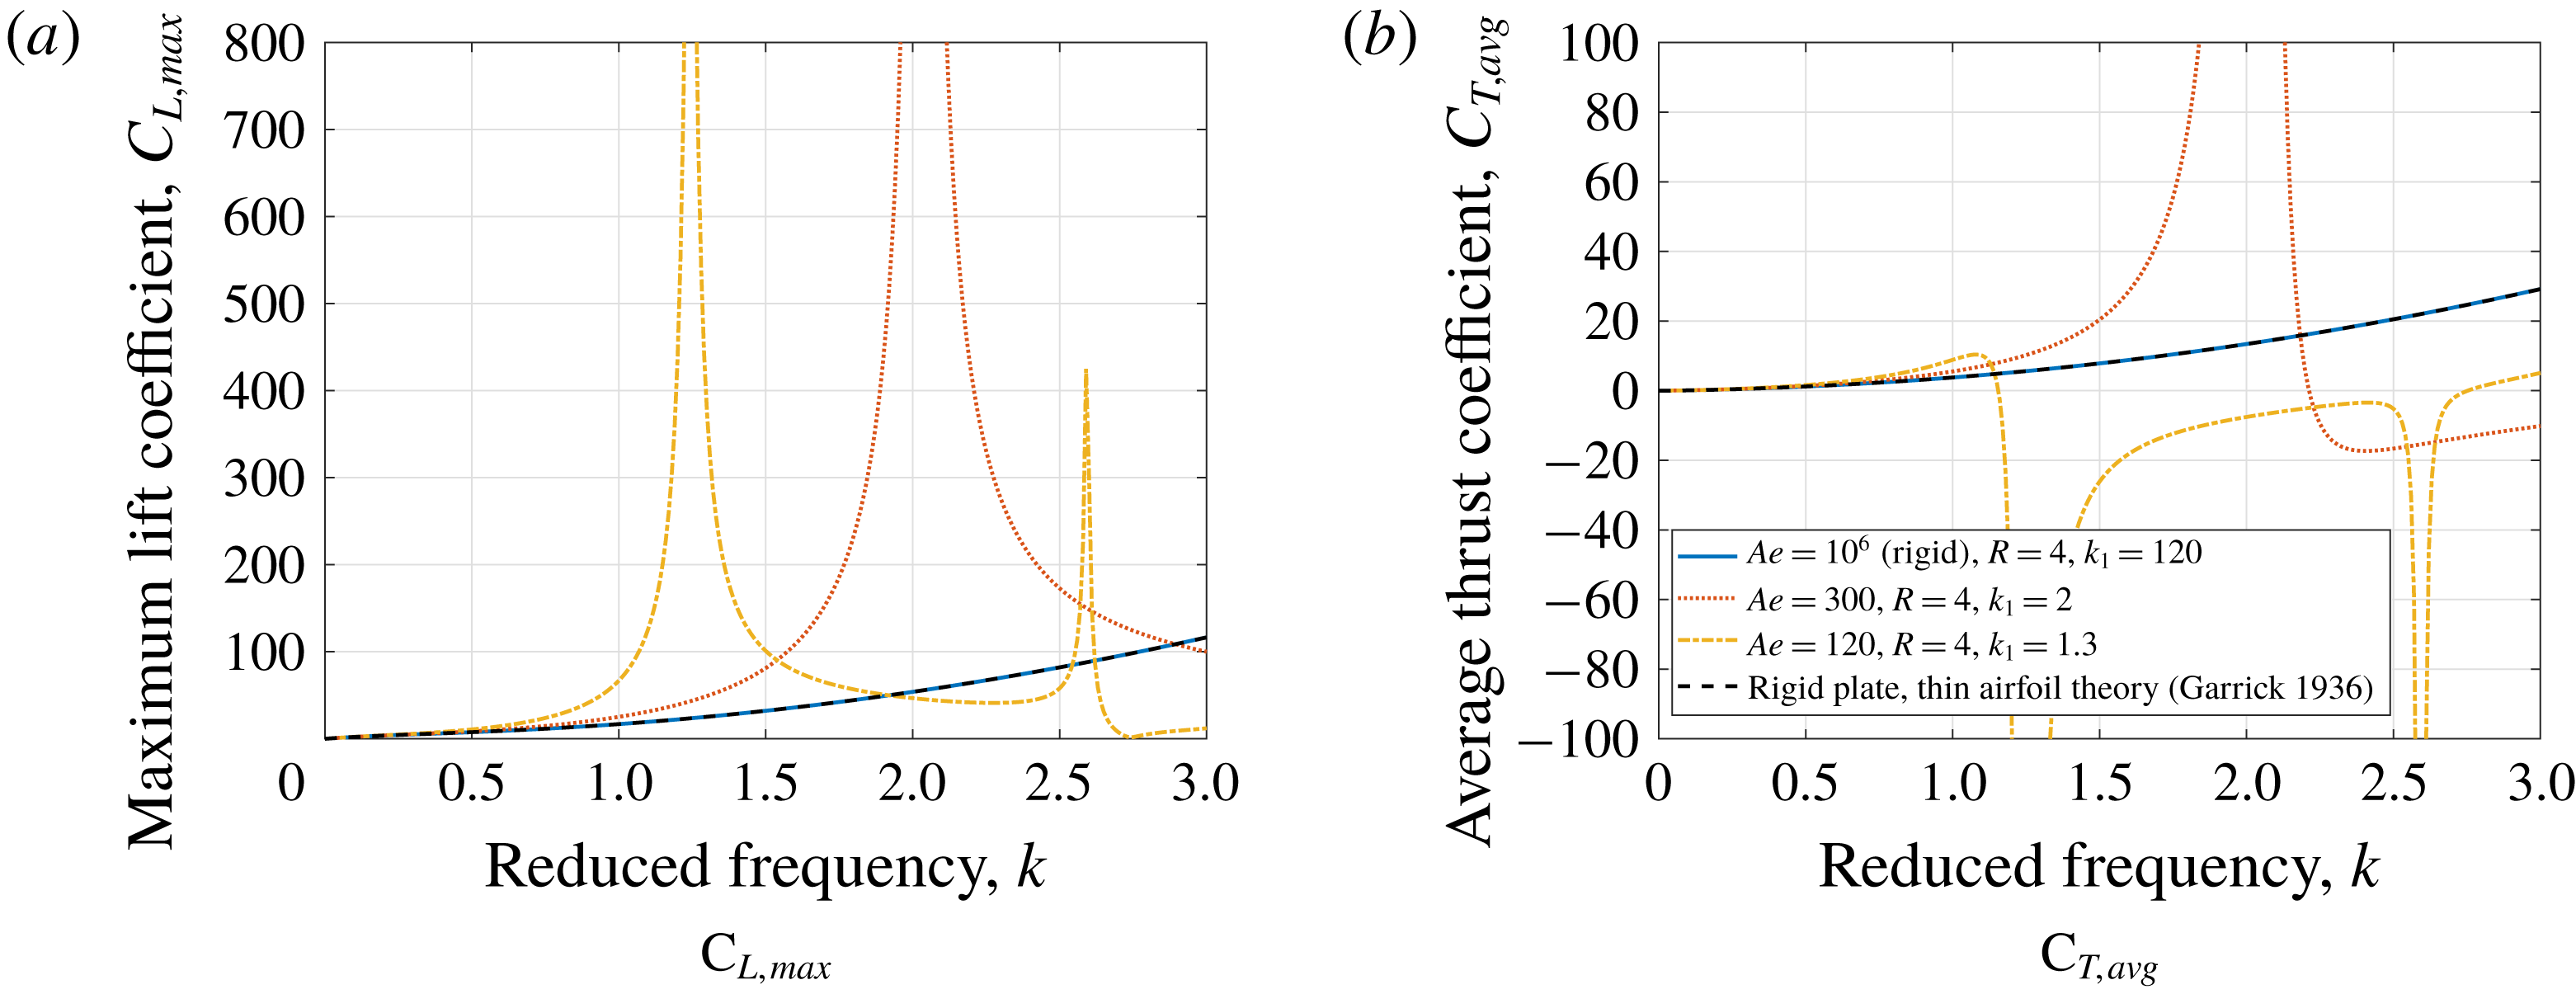
In figure 6, the variation of the maximum lift and average thrust coefficients with the reduced frequency is shown for three cases: a rigid wing, a compliant wing with
 $Ae=300$
and a very compliant wing with
 $Ae=120$
. The rigid wing solution agrees with the analytic solution by Garrick (Reference Garrick1936). The two compliant wings show increase in the magnitude of the aerodynamic coefficients at resonance, although the average thrust response is quite different: the less compliant wing,
 $Ae=300$
, produces high thrust at resonance; in contrast, increasing the compliance,
 $Ae=120$
, results in drag production at resonance. A similar phenomenon was shown by Moore (Reference Moore2014) for a flexible wing with a free trailing edge and a torsional spring at the leading edge: as the spring’s flexibility increases, the flapping wing produces less thrust at resonant frequency – even to the point of transition to drag.
Variation of (a) maximum lift coefficient, and (b) average thrust coefficient with the reduced frequency for a membrane in pure heave;
 $A=1$
,
 $\unicode[STIX]{x1D706}_{0}=1.05$
,
 $R=4$
. The dashed line represents classical thin airfoil theory for a rigid plate (Garrick Reference Garrick1936), in agreement with the current model. Lift and thrust magnitude increase at the resonant frequency. A stiffer membrane (higher aeroelastic number, red) generates thrust at low frequencies, which increases at the resonant frequency and then drops and transitions to drag at a higher frequency. For a more compliant membrane (yellow), the transition from thrust to drag occurs earlier, below resonance.

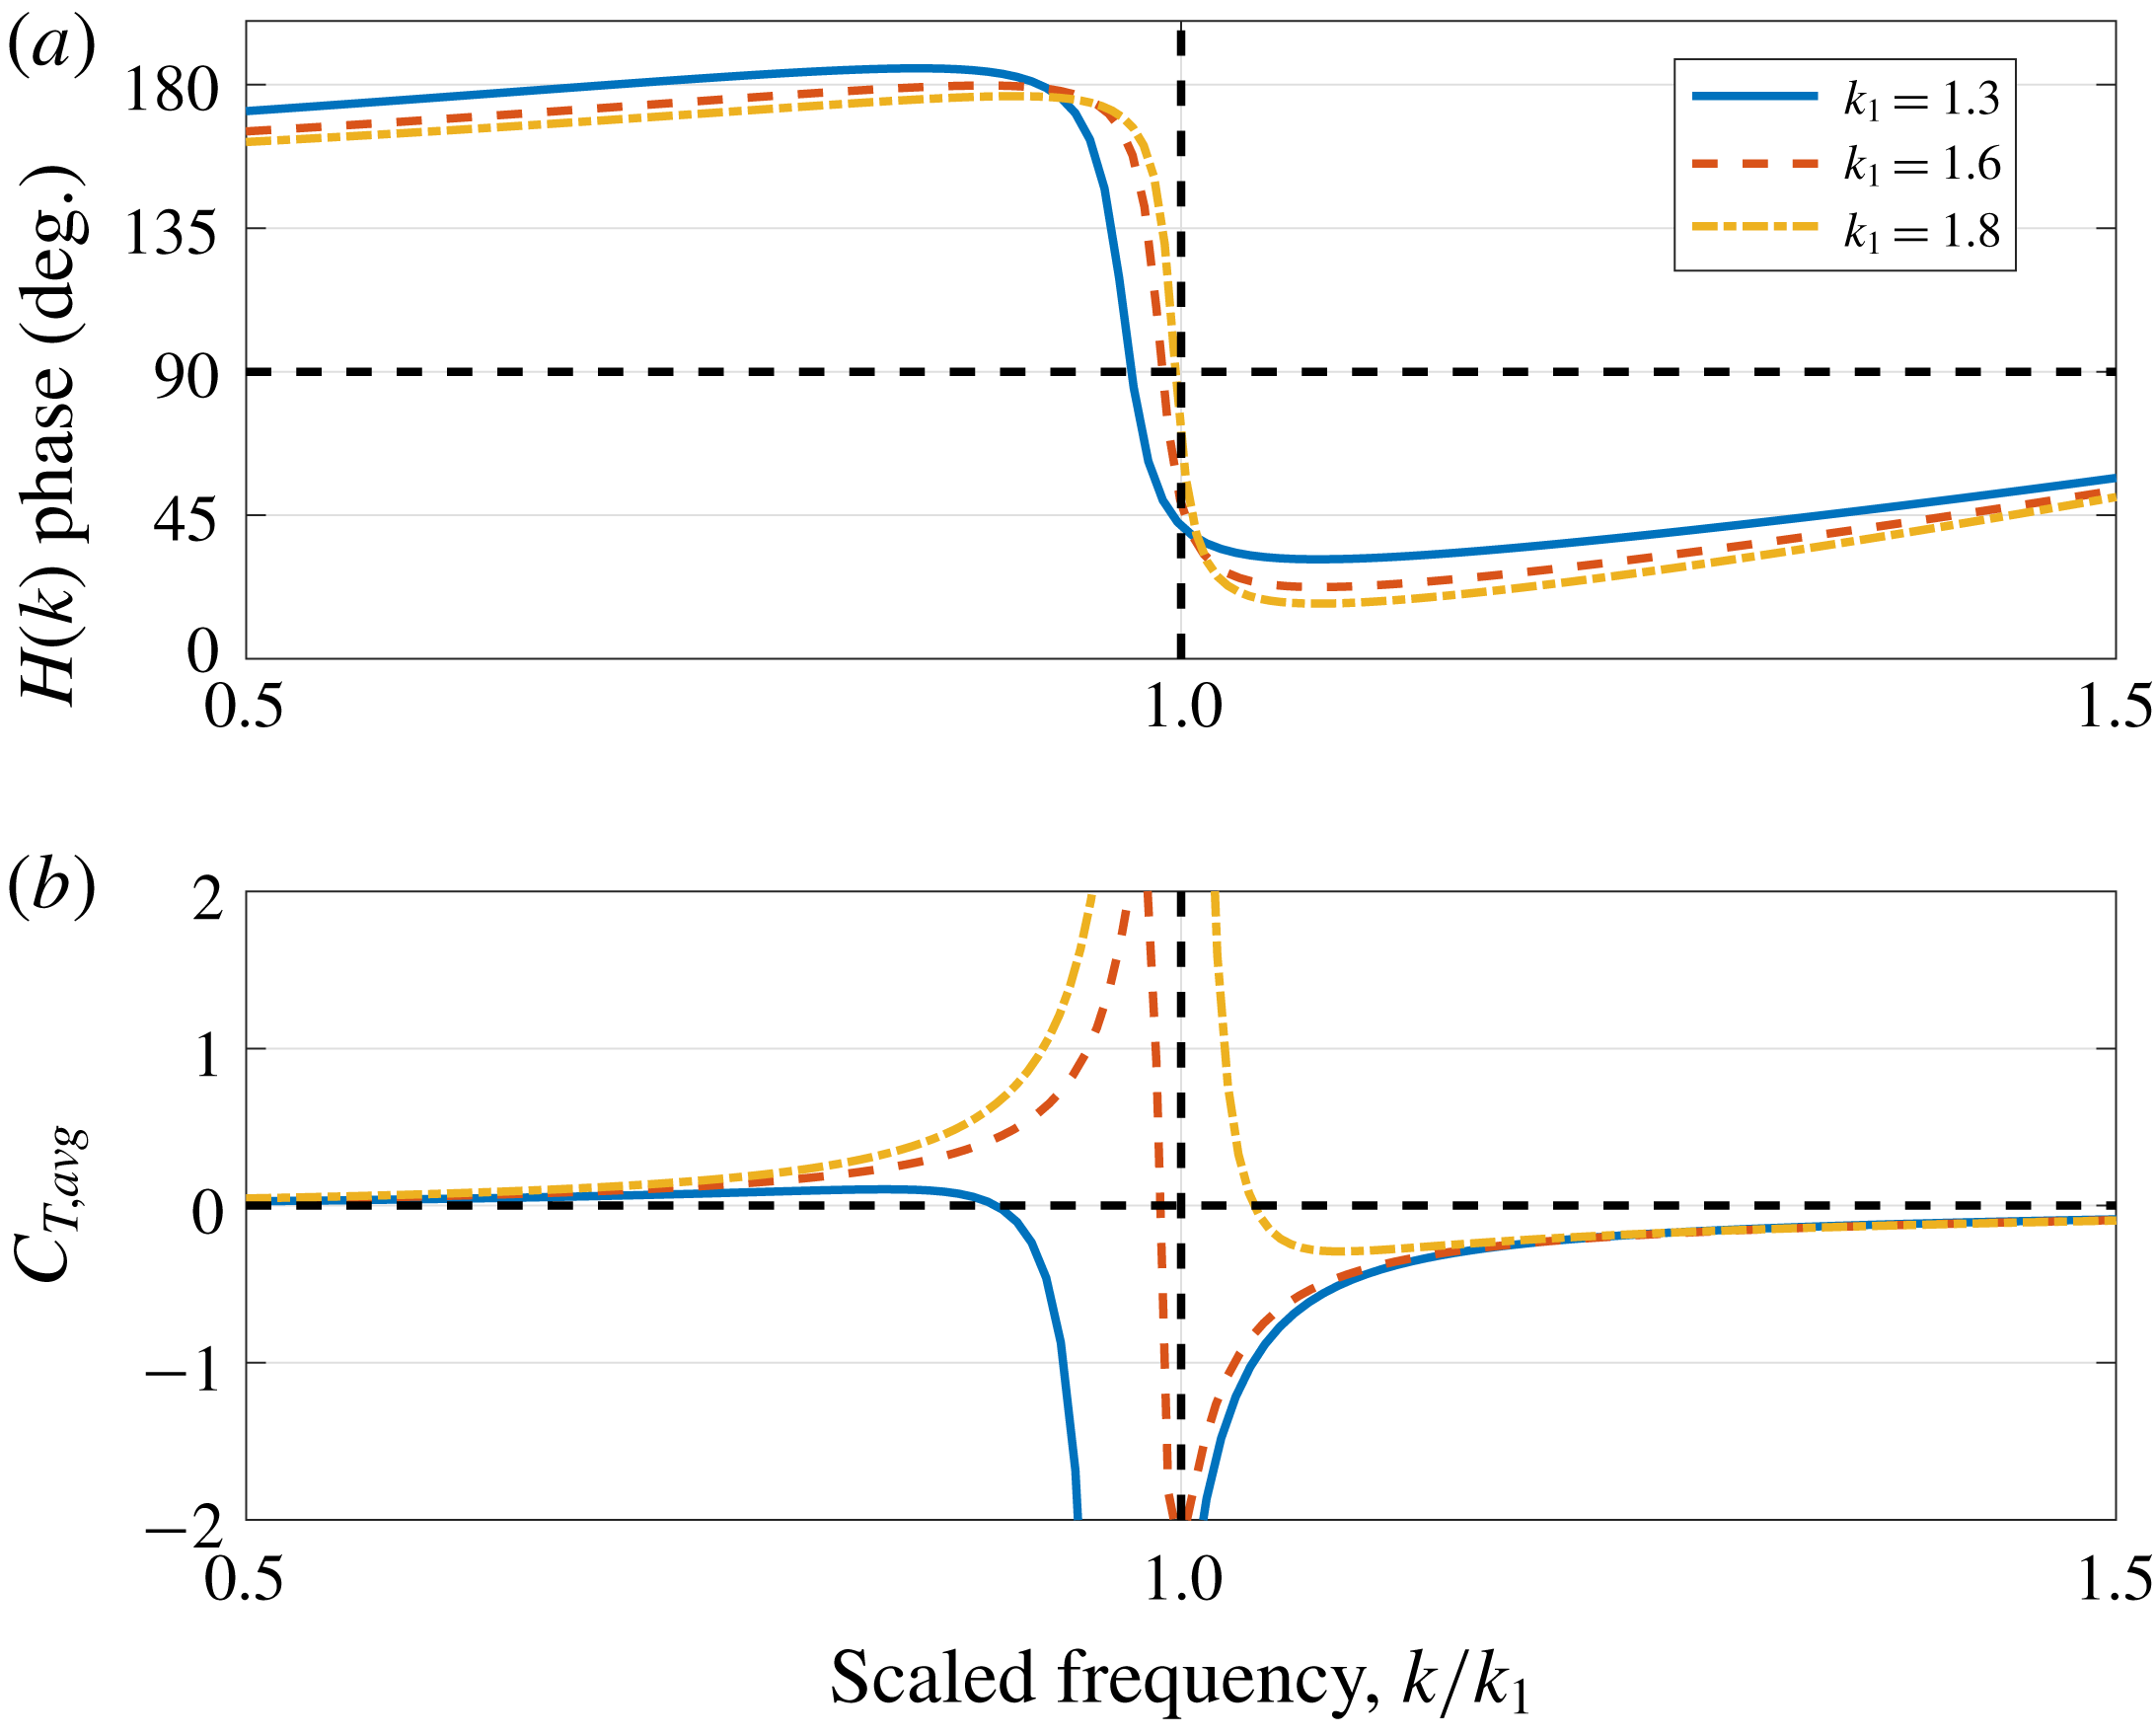
Variation of the phase of the wake transfer function (a) and the average thrust coefficient (b) with normalized frequency,
 $k/k_{1}$
, for three different membranes. At a low flapping frequency, all membranes produce thrust and the corresponding reverse von Kármán wake is observed (identified by
 $\angle H(k)>90^{\circ }$
). At a high frequency, the opposite happens – membranes have a regular von Kármán wake, and generate drag accordingly. Intersection with the dashed lines marks the transition in the wake structure (a) or transition from thrust to drag (b). For a very compliant membrane (low
 $k_{1}$
), the thrust/drag transition occurs before the transition in the wake structure, and vice versa.

To better understand the thrust–drag transition, we examine the wake structure behind the heaving membrane. In figure 7 we plot the phase of the transfer function,
 $H(k)$
, (corresponding to wake structure, equation (2.15)) and the average thrust coefficient against the frequency, here normalized by the resonance frequency,
 $k/k_{1}$
. The different membranes are identified using their natural frequency. At resonance, the wake transitions from a reverse von Kármán street, traditionally associated with thrust, to the regular von Kármán street associated with drag. This change of sign corresponds to a phase shift in the membrane’s shape, as can be seen in figure 3 before and after the resonance (first and last columns). Accordingly, all membranes produce thrust at low frequencies (
 $k/k_{1}\ll 1$
, below resonance) and drag at high frequencies (
 $k/k_{1}\gg 1$
, above resonance). This is in agreement with the experimental results of Spagnolie et al. (Reference Spagnolie, Moret, Shelley and Zhang2010) and the numerical simulation of Zhang, Liu & Lu (Reference Zhang, Liu and Lu2010), who showed that a self-propelled, passively pitching plate moves forward when driven below the natural frequency, and backward when driven at a frequency higher than the natural frequency. However, the thrust–drag transition does not coincide with the transition in the wake, as was also observed in the experiments of Godoy-Diana et al. (Reference Godoy-Diana, Aider and Wesfreid2008), and in the numerical simulation by Michelin & Llewellyn Smith (Reference Michelin and Llewellyn Smith2009). As the membrane’s natural frequency,
 $k_{1}$
, decreases, the transition to drag occurs at a lower frequency, resulting in a peak in drag at the resonance condition.
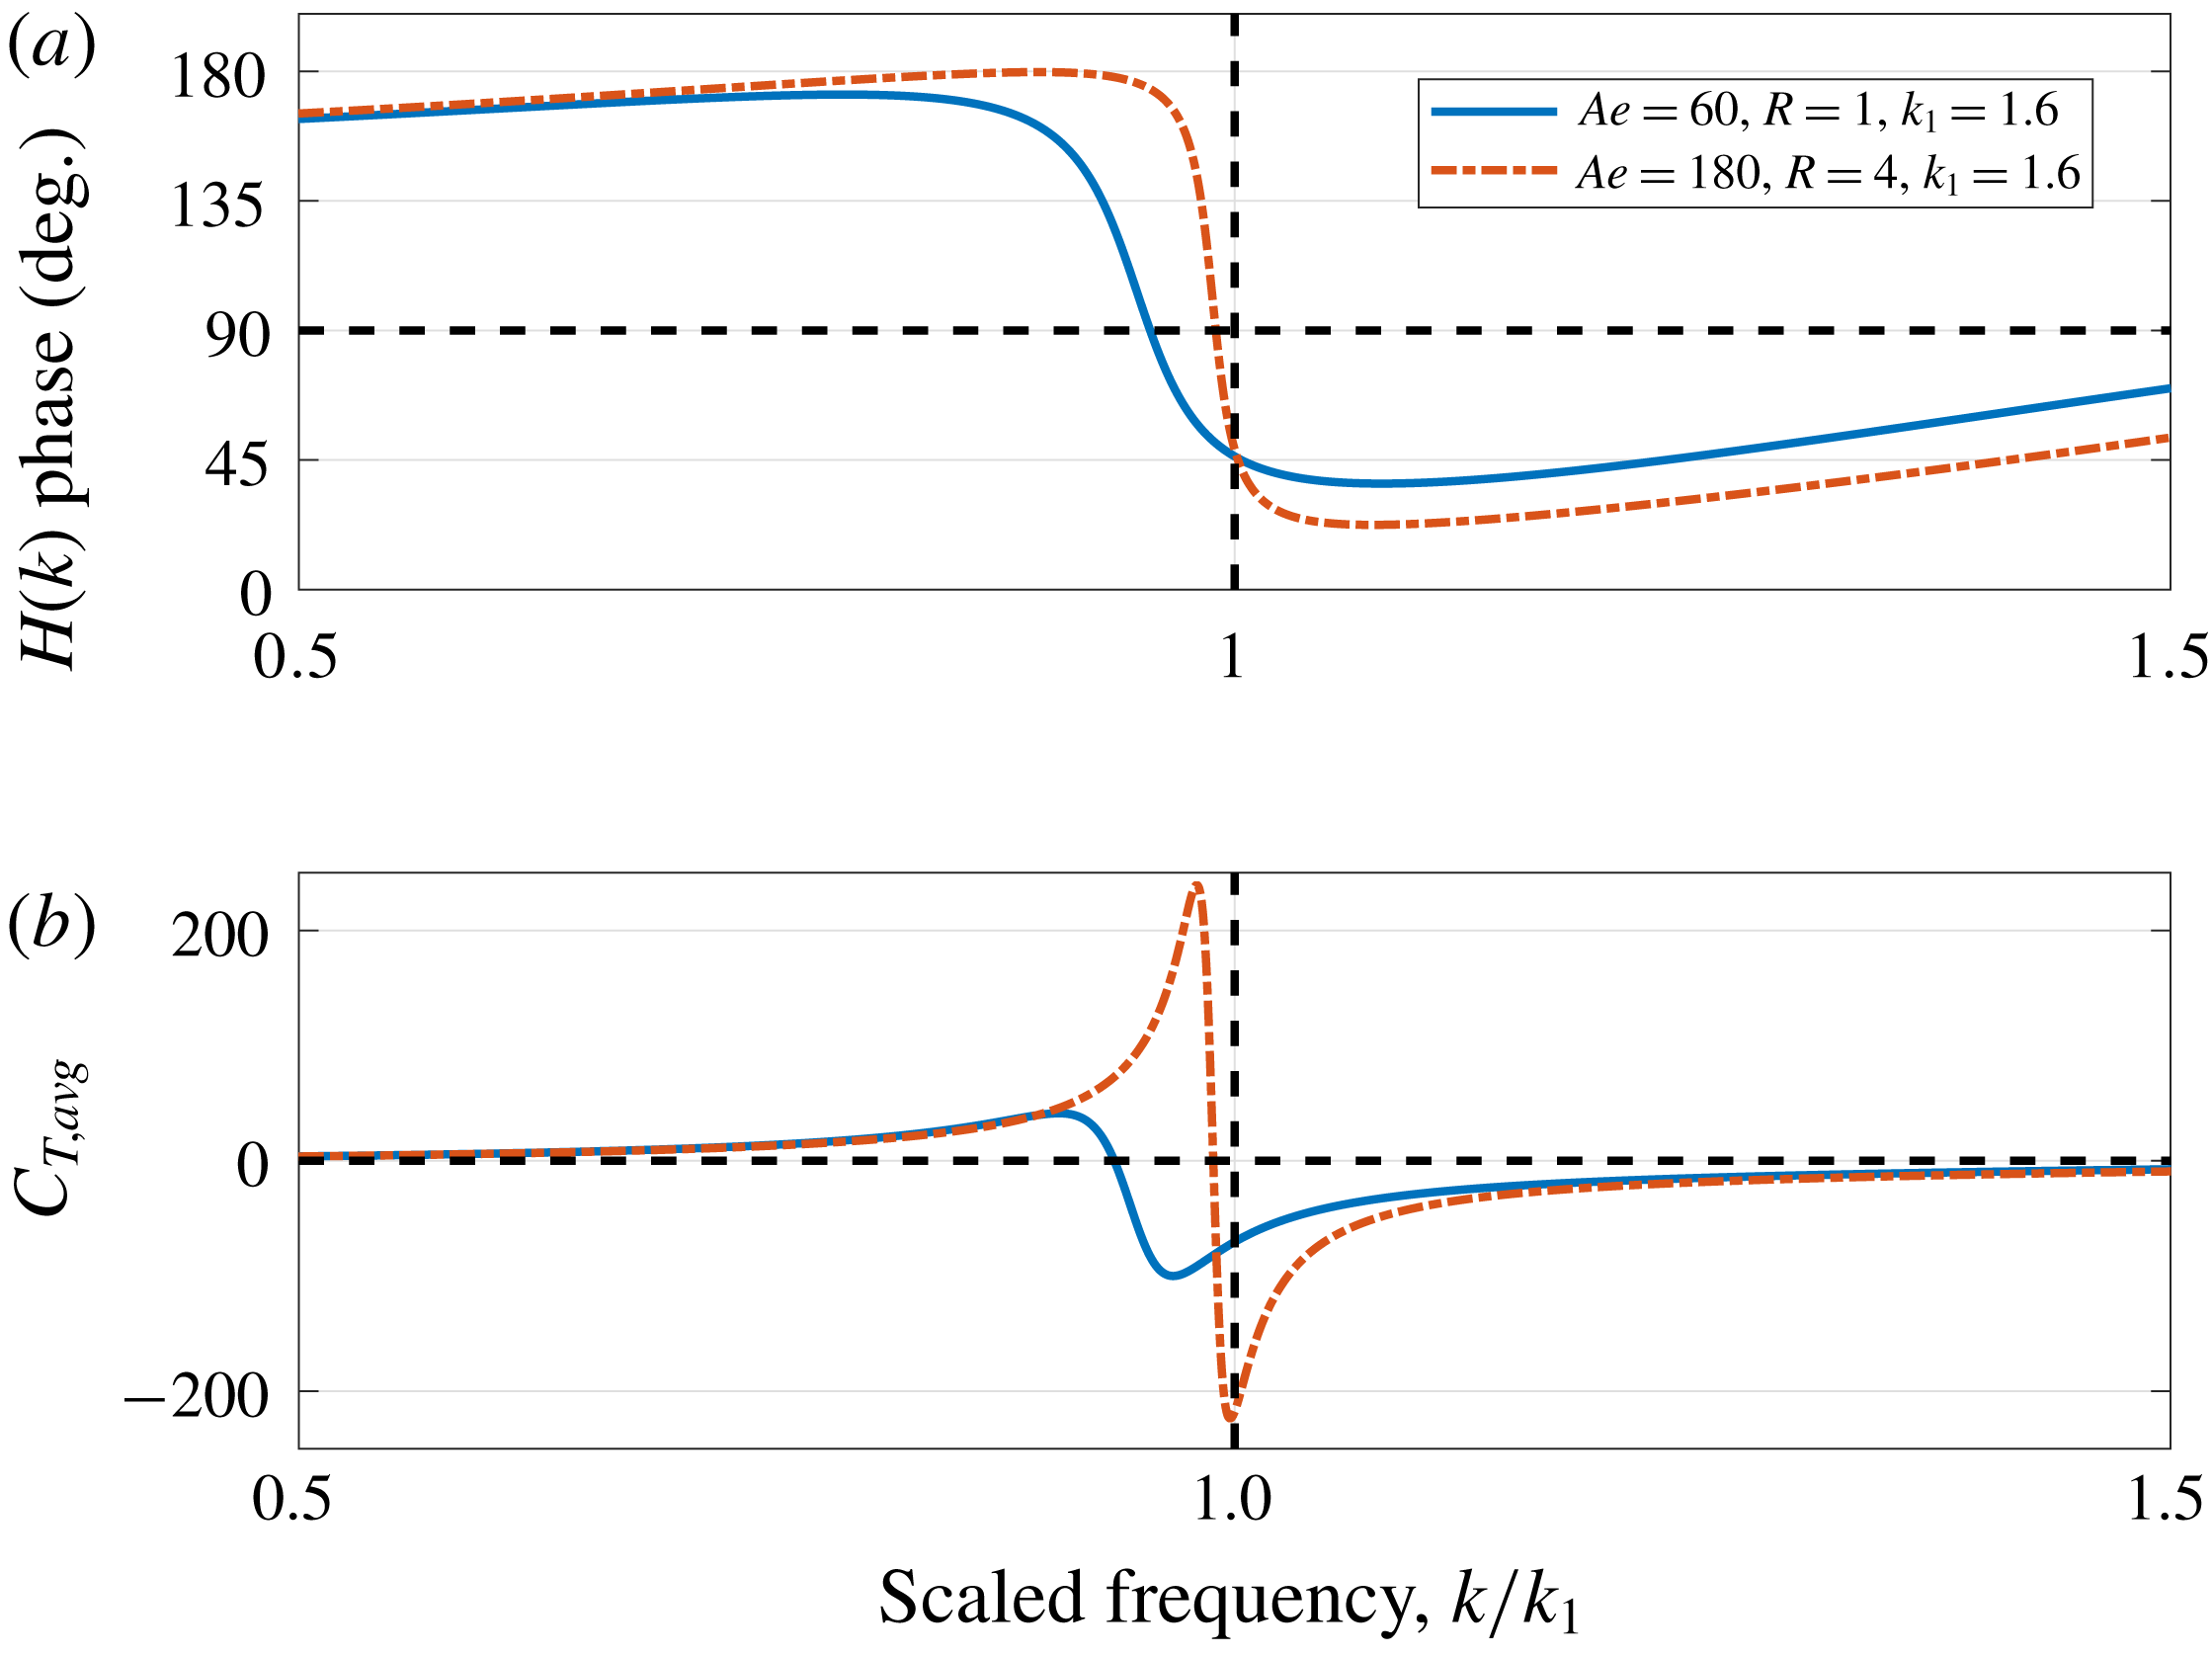
Variation of the phase of the wake transfer function (a) and the average thrust coefficient (b) with the normalized frequency,
 $k/k_{1}$
, for two different membranes with the same natural frequency. Varying the aeroelastic number and the mass ratio changes the effect of fluid damping, which becomes dominant as the parameters become small. This results in a change in the thrust/drag and wake transition frequencies.

The thrust/drag and wake transition frequencies depend on the natural frequency,
 $k_{1}$
, as shown in figure 7, but also on the parameters
 $Ae$
and
 $R$
. As shown in figure 8, membranes with the same natural frequency may have different thrust/drag and wake transition frequencies. This is due to the effect of fluid damping, which becomes more dominant for a high aeroelastic number and mass ratio. This was also observed by Richards & Oshkai (Reference Richards and Oshkai2015) for flapping flexible foils. We can use a scaling argument to understand this effect. As can be derived from (3.6), the damping ratio,
 $\unicode[STIX]{x1D701}$
, is proportional to
 $1/(Rk_{1}^{2})$
, and so a heavier membrane (relative to the fluid), i.e. one with a higher value of
 $R$
, would experience less damping even if the natural frequency is kept constant.
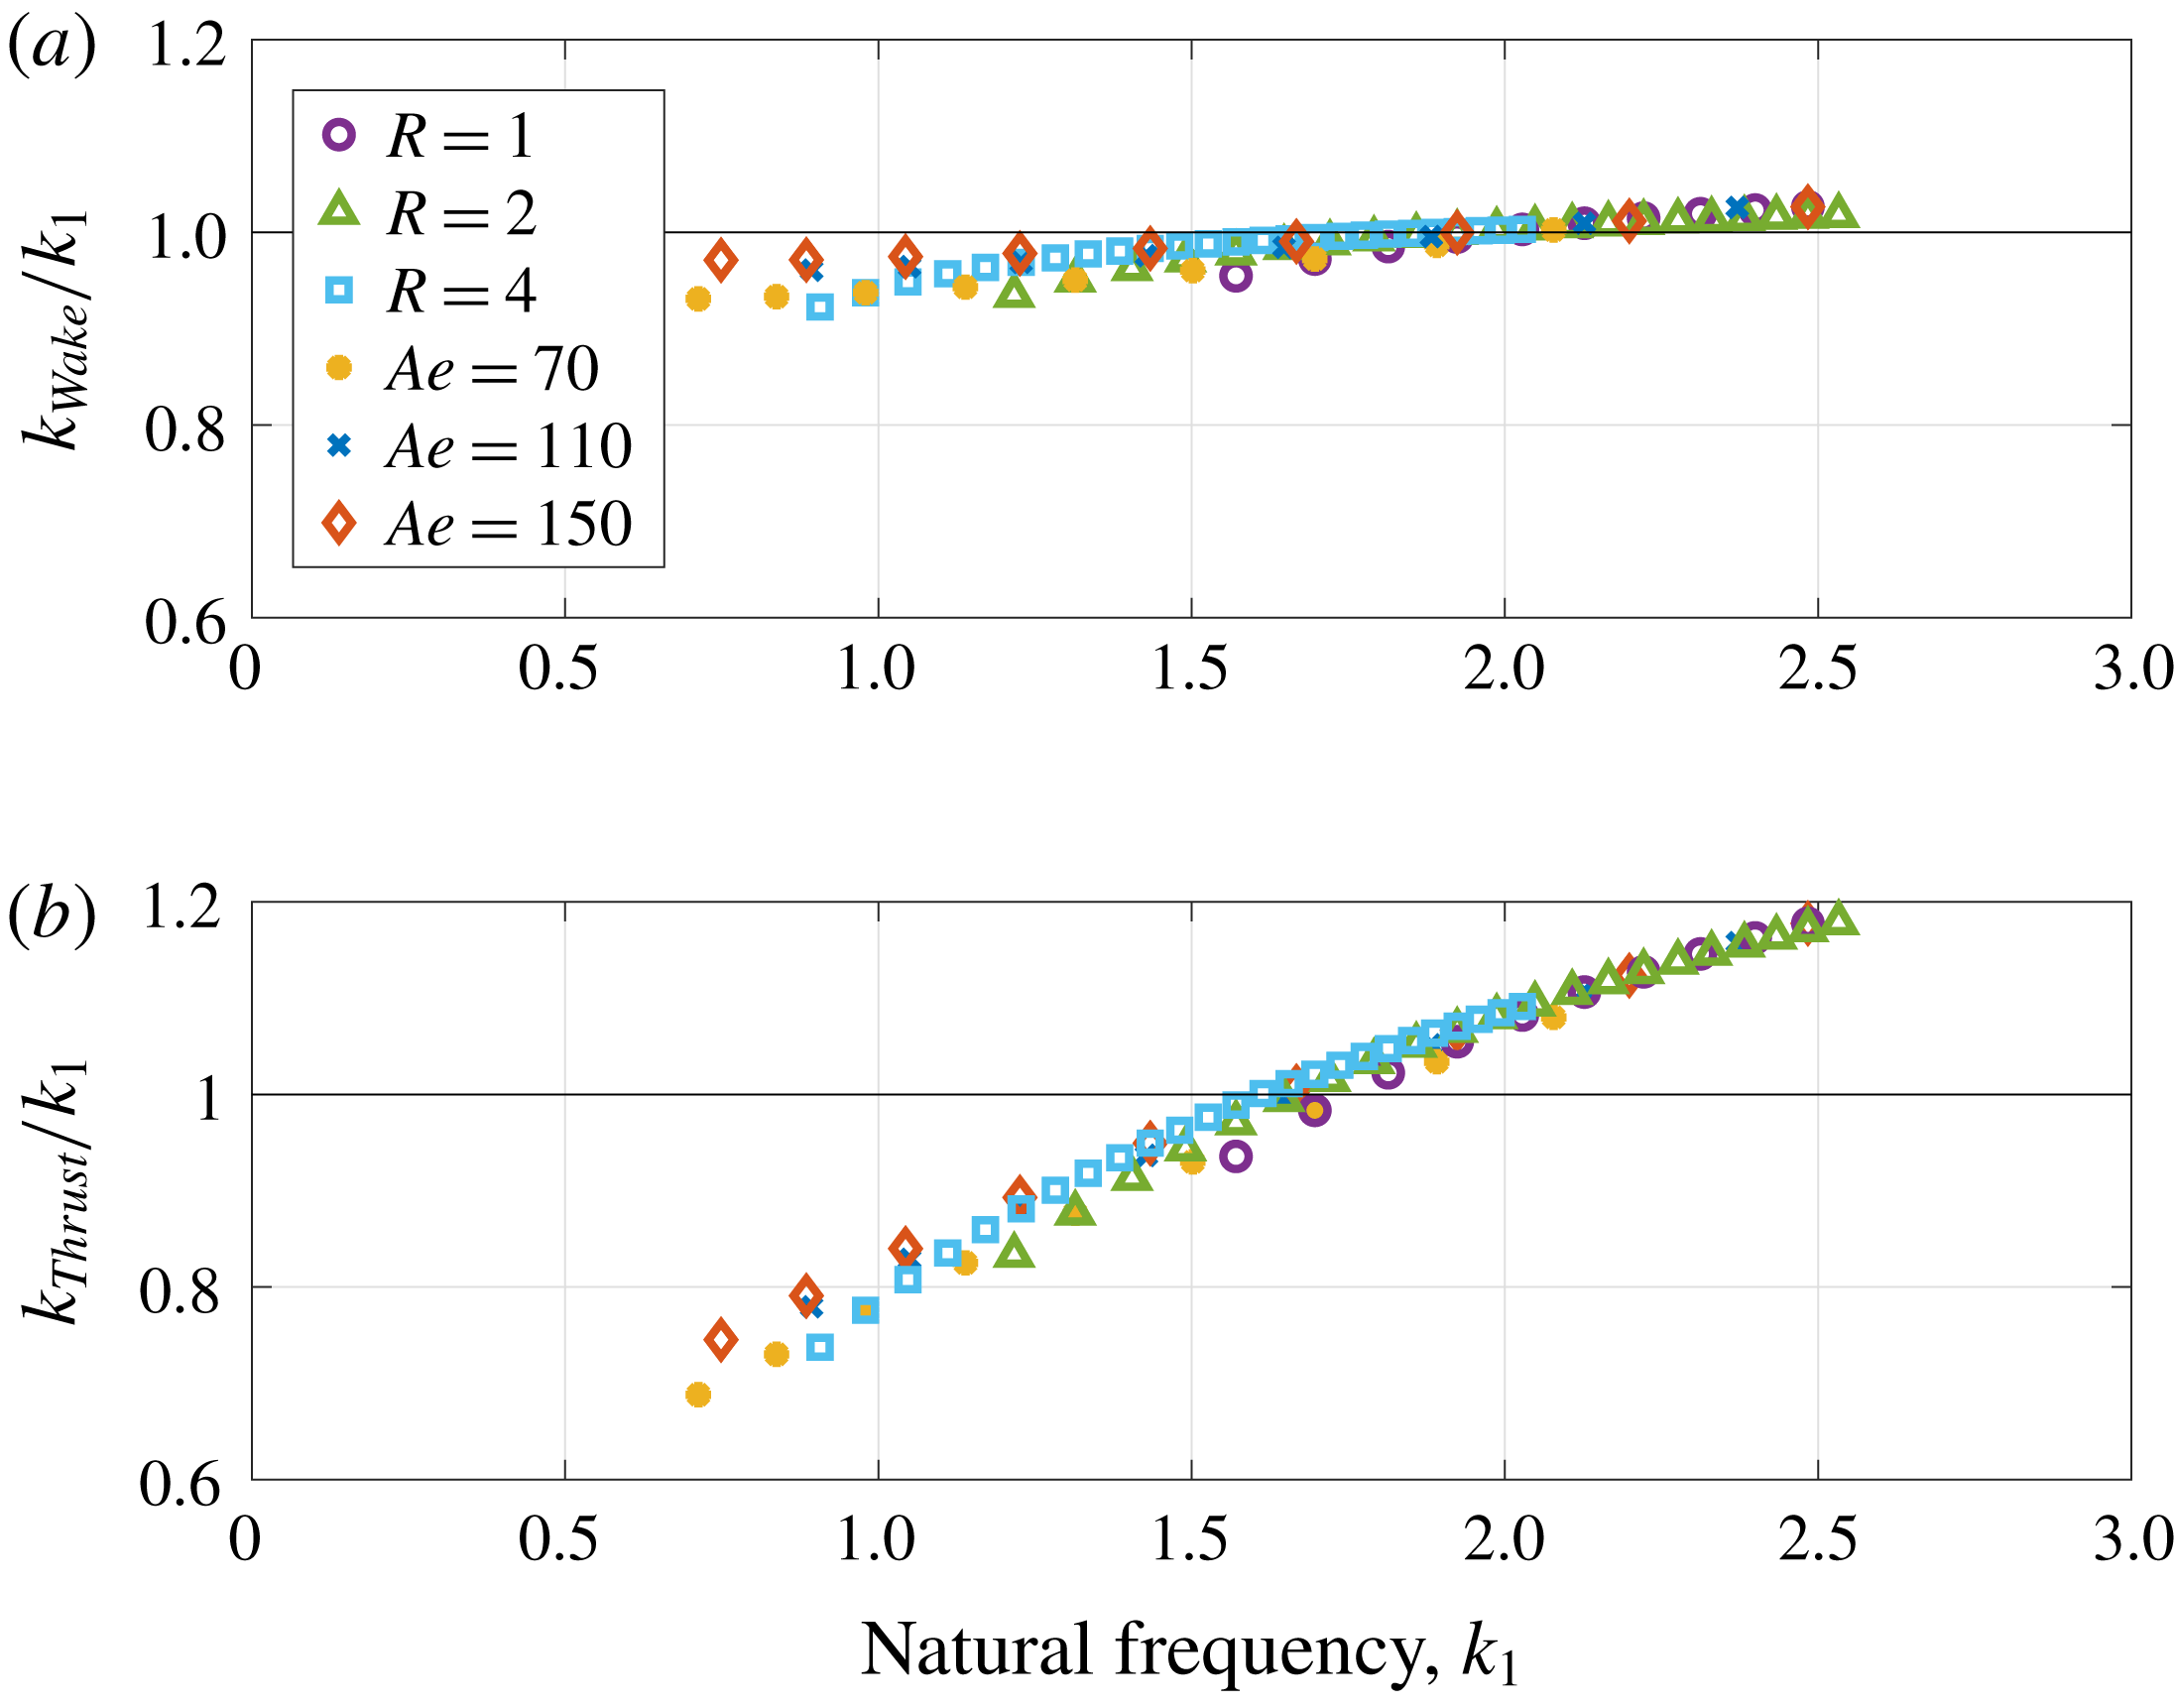
(a) Wake transition and (b) thrust/drag transition frequencies normalized by the natural frequency, plotted as a function of the natural frequency. Transition in the wake structure occurs close to the natural (resonant) frequency. If inertia is dominant (low
 $k_{1}$
, more compliant wing), transition from thrust to drag happens before resonance; however when stiffness dominates (high
 $k_{1}$
), we can get thrust for higher frequencies, to the limit of a rigid plate that produces thrust at any flapping frequency (Garrick Reference Garrick1936).

Figure 9 shows the variation with natural frequency of the wake transition frequency (a) and the thrust/drag transition frequency (b), both normalized by the natural frequency,
 $k_{1}$
. Over the entire parameter range, the transition in the wake structure occurs close to the natural (resonant) frequency, with just a slight decrease at lower values of
 $k_{1}$
. However the thrust/drag transition may occur before or after resonance, depending on the natural frequency. If inertia is dominant (low
 $k_{1}$
, more compliant wing), transition from thrust to drag happens before resonance (
 $k_{thrust}/k_{1}<1$
). However when stiffness dominates (high
 $k_{1}$
) we continue to generate thrust at higher frequencies. At the limit of a heaving rigid plate (
 $k_{1}\rightarrow \infty$
) thin airfoil theory predicts thrust at all flapping frequencies (Garrick Reference Garrick1936).
4 Conclusions
We have presented an analytic model for the steady and unsteady fluid–structure interactions with compliant membrane wings. We solve the coupled aerodynamic and structural models using a Chebyshev collocation method. The model, which extends the approach used by Moore (Reference Moore2014, Reference Moore2015, Reference Moore2017) for elastic plates in a flow, allows us to investigate the effects of inertia, compliance and flapping kinematics on the steady and dynamic response of the membrane.
The steady model retains a level of simplicity so that large scale simulations can be avoided, but improves upon a previous model by Waldman & Breuer (Reference Waldman and Breuer2017), by incorporating thin airfoil theory for the aerodynamic model. Good agreement is observed in the maximum deflection of the membrane between the two models, despite small variations in the predicted membrane shape.
For the case of a flapping membrane wing, we explored the kinematics and propulsive properties of heaving membranes with varying compliance, inertia and flapping frequencies. A simple damped oscillator model allowed us to quantify the effects of added mass and fluid damping on a flapping membrane. The added mass coefficient was found to be constant over a range of parameters, and slightly lower than previous estimations for rigid plates and for membranes in still fluid. The fluid damping coefficient around the first resonance scales as
 $1/k_{1}$
, where
 $k_{1}$
is the system’s natural frequency.
Resonance occurs when flapping at the system’s natural frequency, characterized by a peak in the maximum deflection and the aerodynamic coefficients. The thrust coefficient at resonance reaches a maximum for relatively rigid membranes, but highly compliant membranes may produce drag at resonance. While the transition of the wake from a reverse von Kármán street to the traditional von Kármán street occurs at the resonant frequency, the transition from thrust to drag depends on natural frequency, being earlier for membranes with a low natural frequency (very compliant or heavy membranes), and later when the natural frequency is high (for lighter or more rigid membranes).
The approach clearly has its limitations. The linear assumptions break down for large deflections, and this will certainly modify the predictions near the resonant conditions. In addition, the effects of viscosity, which in real life introduces boundary layer transition to turbulence and separation, will also limit the applicability of the model. The ‘spring–mass–damper’ model introduces yet further simplifications. Nevertheless, similar analytic and low-order models have been shown to have wide interpretative and predictive utility in the unsteady aerodynamics, animal locomotion and flapping flag communities. Despite their limitations, these models provide valuable physical insight and we anticipate that the same will be true with this approach, although experimental validation (currently planned) is needed to determine the range over which these predictions are of value.
Acknowledgements
This research was supported by a collaborative research agreement with the Government of Israel and by a research grant from the US Army Natick Soldier Systems Center. Many thanks go to the individuals of the Breuer Lab for valuable discussion and technical assistance.