1 Introduction
Microfluidic paper-based analytical devices (
 $\unicode[STIX]{x1D707}$
PADs) have attracted growing interest because of their potential applications in healthcare, veterinary medicine, environmental monitoring and food safety (Martinez et al.
Reference Martinez, Phillips, Whitesides and Carrilho2009; Yetisen, Akram & Lowe Reference Yetisen, Akram and Lowe2013; Cate et al.
Reference Cate, Adkins, Mettakoonpitak and Henry2014).
 $\unicode[STIX]{x1D707}$
PADs have the advantage of being cheap to produce and easy to use because they utilize a paper platform instead of conventional micromachined structures. In addition, the intrinsic capillary property of the paper may preclude the need for external pumps, which opens a wide range of potential applications in point-of-care diagnostics (Böhm et al.
Reference Böhm, Carstens, Trieb, Schabel and Biesalski2014; Hu et al.
Reference Hu, Wang, Wang, Li, Pingguan-Murphy, Lu and Xu2014; Ahmed, Bui & Abbas Reference Ahmed, Bui and Abbas2016; Lin et al.
Reference Lin, Gritsenko, Feng, Teh, Lu and Xu2016; Hong, Kwak & Kim Reference Hong, Kwak and Kim2016; Xia, Si & Li Reference Xia, Si and Li2016; Cummins et al.
Reference Cummins, Chinthapatla, Ligler and Walker2017).
Paper has a porous structure composed of a network of cellulose fibres. When paper comes into contact with a liquid, the pores imbibe the liquid by capillary force. Although liquid flows through porous media are generally described by Darcy’s law that relates the flow rate with the pressure drop, material permeability and liquid viscosity (Darcy Reference Darcy1856), the Washburn equation can be useful in predicting liquid imbibition through paper. Washburn (Reference Washburn1921) developed the equation to describe the capillary-driven flow through a circular tube, in which the imbibition length is given by
 $l_{w}=k\sqrt{\unicode[STIX]{x1D70E}R\cos \unicode[STIX]{x1D703}t/(2\unicode[STIX]{x1D707})}$
, where
 $\unicode[STIX]{x1D70E}$
is the surface tension,
 $\unicode[STIX]{x1D703}$
is the contact angle,
 $R$
is the tube radius,
 $t$
is time and
 $\unicode[STIX]{x1D707}$
is the liquid viscosity. He further suggested that flows through porous media can be assumed to be equivalent to liquid penetration through multiple cylindrical capillary tubes for calculation purpose, so that the penetration length can be expressed as
 $l_{w}=k\sqrt{t}$
, where
 $k$
is proportional to
 $(\unicode[STIX]{x1D70E}/\unicode[STIX]{x1D707})^{1/2}$
and pore size. Therefore, one can predict the imbibition length using the Washburn equation by experimentally measuring
 $k$
.
Despite its success in describing capillary flows in various porous media, the Washburn equation is often insufficiently accurate when predicting the imbibition length of
 $\unicode[STIX]{x1D707}$
PADs that require precise flow control (Noh & Phillips Reference Noh and Phillips2010). One critical issue is that the flow speed decreases with time more rapidly than expected by the Washburn equation. While various physical reasons, such as evaporation and swelling of the cellulose fibre, have been suggested to explain the error (Schuchardt & Berg Reference Schuchardt and Berg1991; Masoodi & Pillai Reference Masoodi and Pillai2010; Masoodi, Tan & Pillai Reference Masoodi, Tan and Pillai2012), attempts have been made to improve the prediction by modifying the time exponent in
 $l_{w}\sim t^{1/2}$
based on experiments (Amaral et al.
Reference Amaral, Barabási, Buldyrev, Havlin and Stanley1994; Balankin et al.
Reference Balankin, López, León, Matamoros, Ruiz, López and Rodríguez2013).
A description of the capillary flow through paper using the Washburn equation involves the assumption that the pores behind the visible wetting front are fully saturated. However, the wetting front in a porous medium becomes unclear over a long time scale, since it slowly develops into a partially wetted band whose thickness increases with time. Hence, the capillary flow through a porous medium over long time scales cannot be explained with the Washburn equation. A great deal of effort has been devoted to understanding the evolution of the partially wetted region in various porous media (Horváth & Stanley Reference Horváth and Stanley1995; Delker, Pengra & Wong Reference Delker, Pengra and Wong1996; Dubé et al. Reference Dubé, Rost, Elder, Alava, Majaniemi and Ala-Nissila1999; Rost et al. Reference Rost, Laurson, Dubé and Alava2007). Unlike the long time case, over short time scales the wetting front remains evident, so it has been assumed that the pores behind the wetting front are completely filled. However, Walji & MacDonald (Reference Walji and MacDonald2016) experimentally found that paper pores behind a wetting front may remain partially vacant even on short time scales, which ultimately causes additional absorption behind the wetting front. They conjectured that the cavity inside the cellulose fibres is responsible for the additional flow. In any case, our physical understanding of the capillary flow through paper consisting of fibres with internal pores is still far from clear.
In this paper, we elucidate the role of the intra-fibre pores in the dynamics of liquid imbibition through paper. We visualize the void space inside single cellulose fibres in various kinds of papers and demonstrate that liquid can be absorbed in the internal pores of cellulose fibres as well as in the inter-fibre pores formed by the fibre network. After introducing parameters characterizing the intra-fibre pores, we develop a mathematical model for the dynamics of liquid imbibition through paper. Although Pillai & Advani (Reference Pillai and Advani1998) have considered intra-fibre spaces during liquid injection in a woven fibre mat, here we newly formulate the imbibition length for the capillary flow through paper by characterizing the intra-structure of cellulose fibres based on experimental observations. Our model exposes the limits of the Washburn equation and provides a better understanding of capillary flow in paper, and can thus be used to help control flow speed when designing
 $\unicode[STIX]{x1D707}$
PADs, resulting in greatly improved reliability.
2 Experiments
2.1 Experimental set-up
We took scanning electron microscope (SEM) images to visualize the intra-structure of the cellulose fibres of various papers, including commercial filter papers (Whatman grade 4, Whatman grade 5 and CHM F1005), chromatography paper (Advantec No. 50), Kent paper, watercolour paper and kraft paper. The three filter papers of Whatman grade 4, Whatman grade 5 and CHM F1005 are denoted as Filters I, II and III, respectively. We also used a non-woven fabric consisting of fibres without an internal cavity for comparison. The papers and fabric were cut into small specimens after being frozen in liquid nitrogen to minimize damage. The specimens were coated with platinum to ensure electrical conductivity, the SEM images of the cross-section of various papers and non-woven fabric were obtained, as shown in figure 1.
Scanning electron microscope (SEM) images of single fibres of the various papers and non-woven fabric. (a) Cross-sections of the specimen of Filter II (Whatman grade 5). Cross-sections of single fibres in (b) Filter II (Whatman grade 5), (c) Filter I (Whatman grade 4), (d) Filter III (CHM F1005), (e) chromatography (Advantec No. 50), (f) Kent paper, (g) watercolour paper, (h) kraft paper and (i) non-woven fabric.

(a) Schematic illustration of the experimental set-up. (b) Sequential images of the parts of the paper strip (Filter II) showing liquid imbibition. The wet region appears bright, and the boundary between the dark and bright regions indicates the wetting front.

We constructed an experimental set-up to visualize the liquid flow through paper, as shown in figure 2(a). A rectangular paper strip with a width of 20 mm was placed on a horizontal support to preclude gravitational effects on the liquid flow. Paper was known to be anisotropic in two directions on the plane: the machine direction (MD) parallel to the forming direction and the cross-machine direction (CD) perpendicular to the MD (Walji & MacDonald Reference Walji and MacDonald2016). In our experiments, the paper strips were placed so that the liquid could flow in the MD. To preclude fibre swelling and evaporation, we used silicone oils (dimethylpolysiloxane) with a viscosity greater than 5 mPa s. The swelling of cellulose fibre is mainly determined by the solubility of cellulose in the liquid and the hydrogen bonding between the liquid and cellulose (Nayer & Hossfeld Reference Nayer and Hossfeld1949; Mantanis, Young & Rowell Reference Mantanis, Young and Rowell1995). Silicone oils do not mix with the OH groups of cellulose, and so swelling effects can be assumed to be negligible (Schuchardt & Berg Reference Schuchardt and Berg1991). The saturated vapour pressure of silicone oils that we used are less than 10 Pa at
 $25\,^{\circ }\text{C}$
, so that the evaporation rate is much smaller than that of water with a vapour pressure of 3 kPa at
 $25\,^{\circ }\text{C}$
. We started the imbibition by adjusting the vertical position of the oil reservoir so that an end of the paper strip came into contact with the silicone oil. At the beginning of the absorption, the wetting front was filmed using a high speed camera (Photron SA3), and later using a video camera (Sony HDR-PJ340). The paper was illuminated by a LED light emitted from below. Figure 2(b) shows the typical time-lapse images of the wetting front, where the wet region appears bright. To estimate the local oil content, the strip was contacted with the oil reservoir until the wetting front reached a certain position. The strip was cut into parts, 2 mm long and 5 mm long for the papers and non-woven fabric, respectively (Bico & Quéré Reference Bico and Quéré2003). By measuring the weight of the cut pieces, we calculated the mass ratio of the absorbed liquid in each piece to the maximum liquid that can be absorbed into each piece,
 $c$
. The difference in length of the pieces was kept at less than 0.1 mm, based on which we estimated the error of
 $c$
.
We examined the post-wetting flow, the oil absorption after the wetting front arrives at the strip end (Walji & MacDonald Reference Walji and MacDonald2016). We visualized the wetting front of a paper strip hung on a vertical support that was connected to an electrical scale. We used relatively short paper strips with a length of 5 mm to reduce the amount of liquid that flowed into the intra-fibre pores before the wetting front reached the end of the paper. Compared with a maximum possible rise height of greater than 200 mm, the strip length was less than
 $1/40$
, and negligible gravitational effects were thus assumed in the experiments. The same experiment was carried out with a non-woven fabric with a length of 15 mm to compare with the paper. We measured the weight of both test strips after absorbing silicone oil with a viscosity of 5 mPa s, until the weight reached the maximum
 $m_{0}$
.
The dependence of
 $l^{2}$
on
 $t$
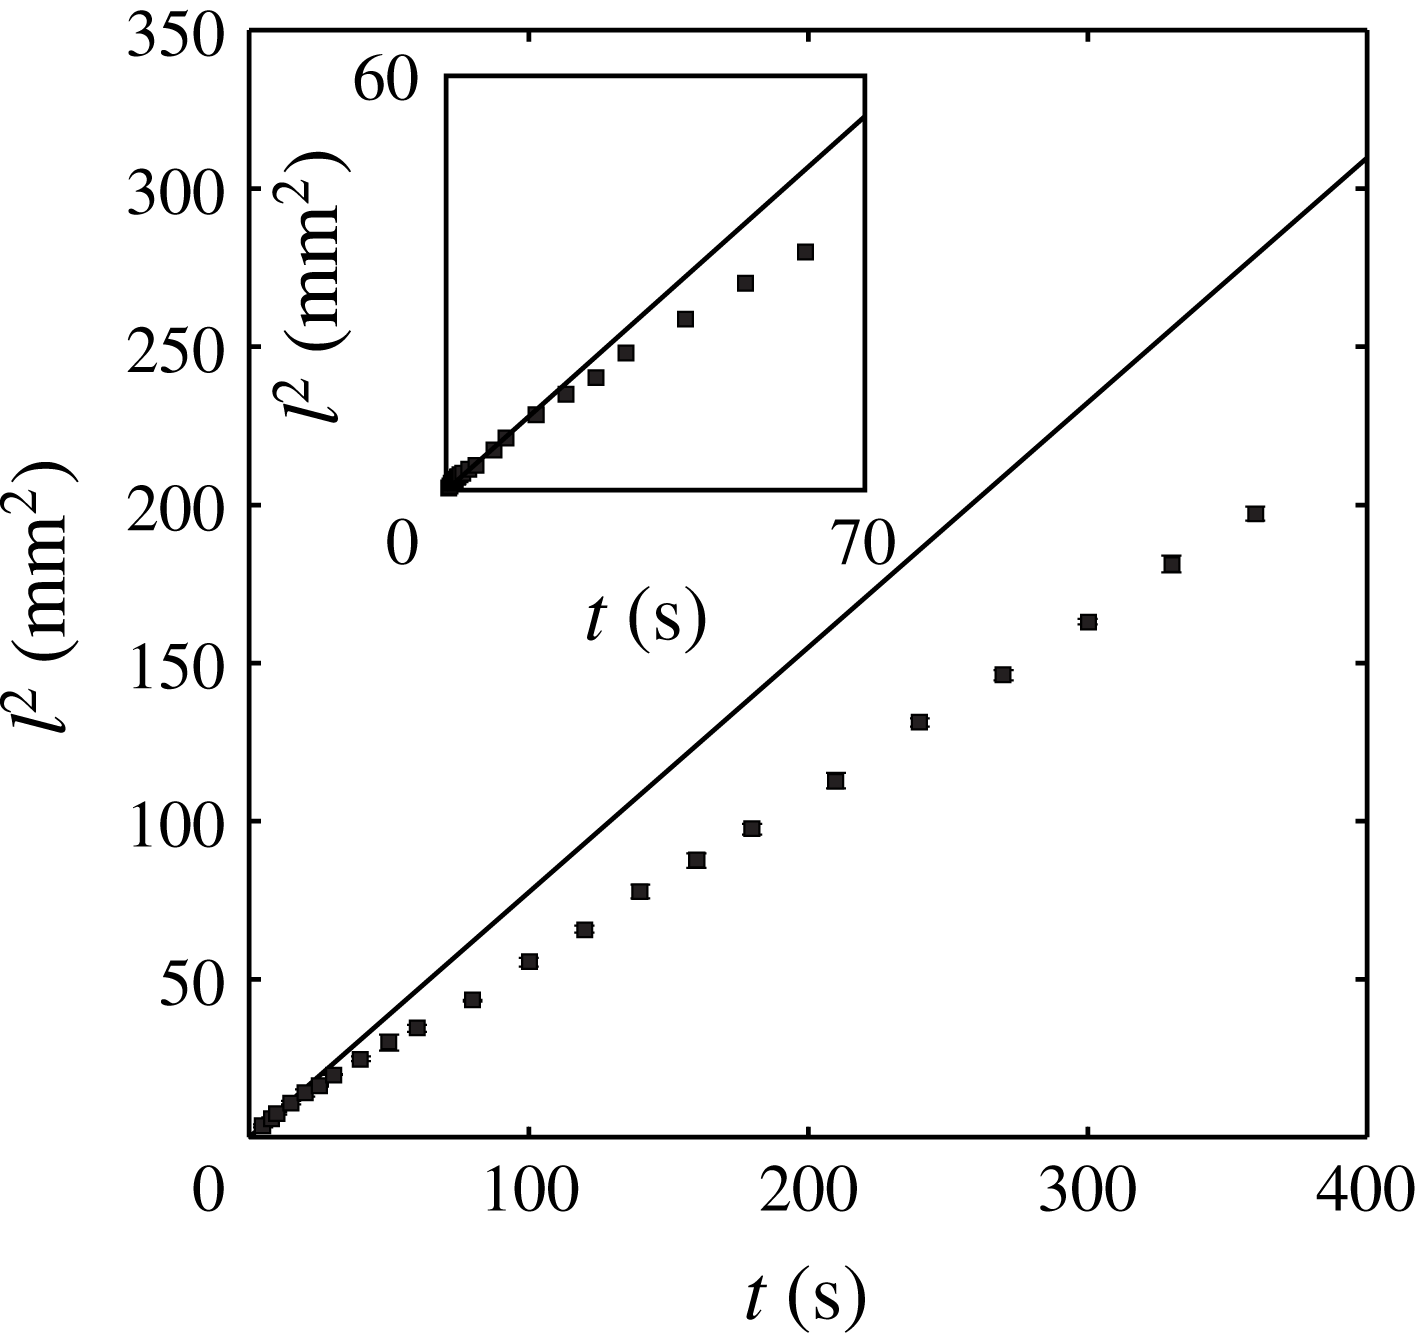
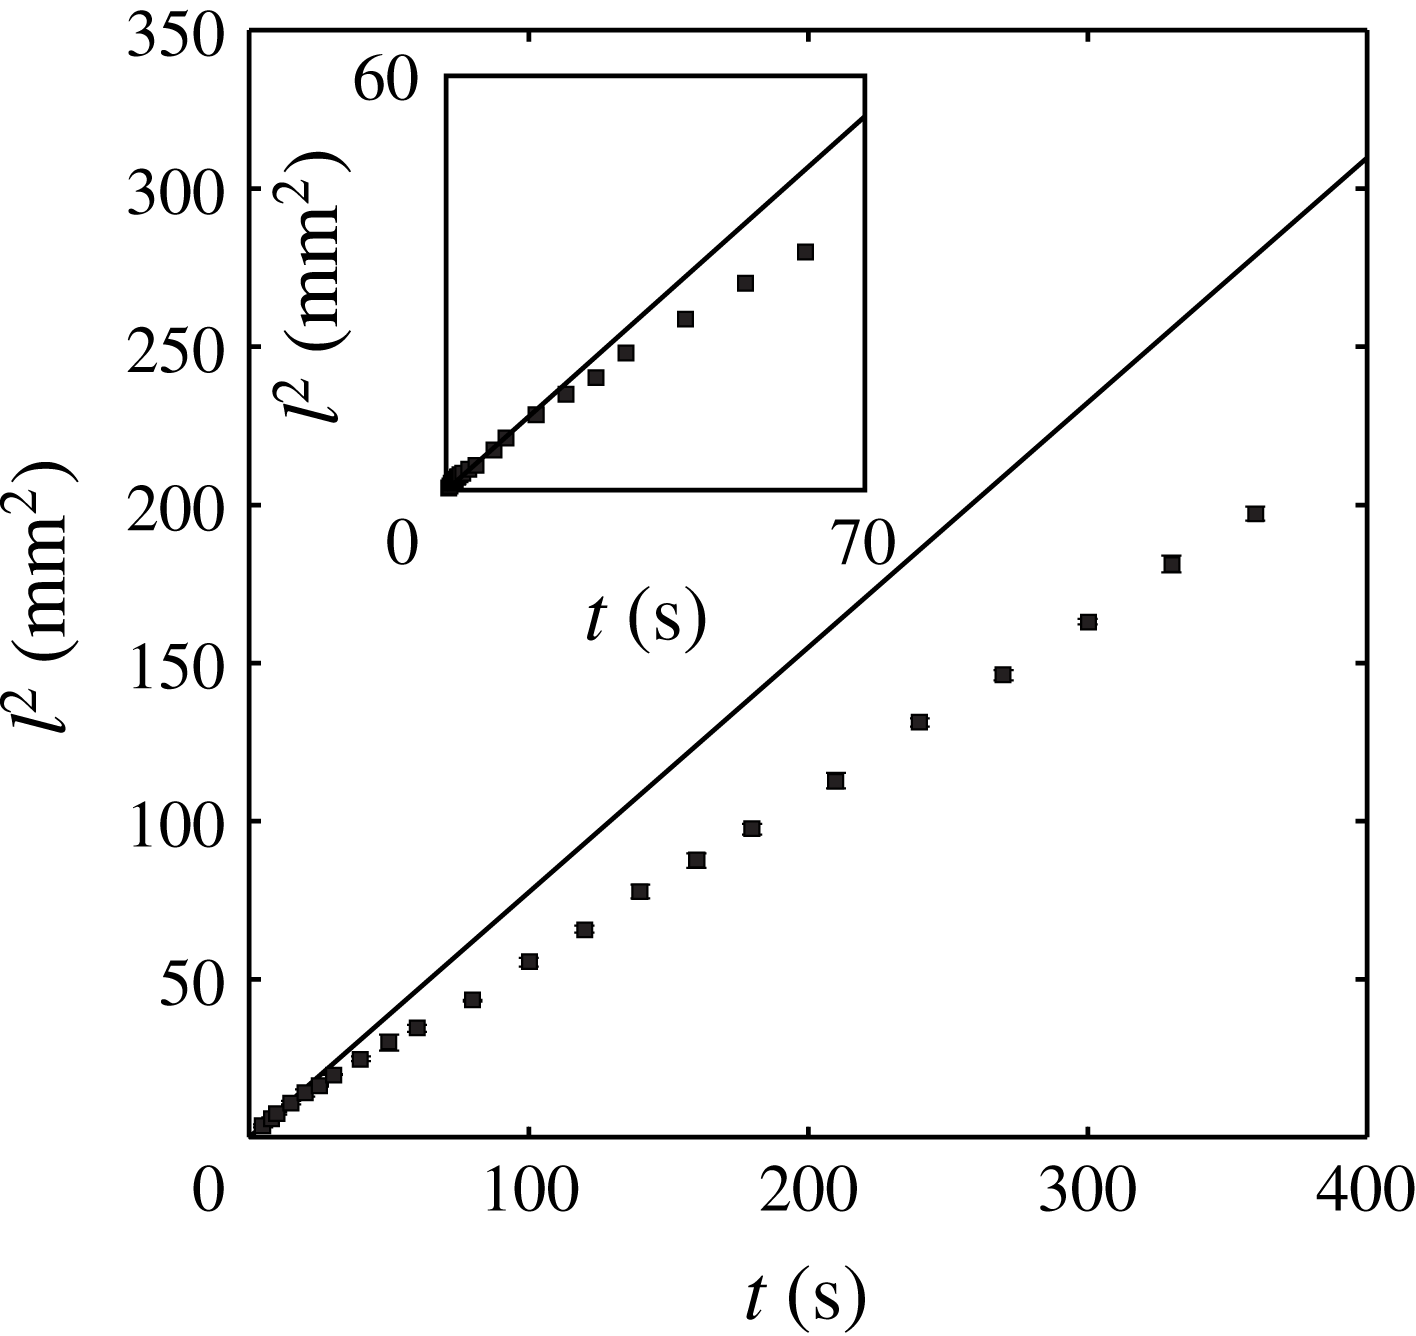
in Filter II.
2.2 Experimental observations
Figure 1 presents the scanning electron microscope (SEM) images of the intra-fibre structure of the various papers and the non-woven fabric. Compared with the non-woven fabric fibre (figure 1
i), the cellulose fibres of the papers had an internal space with a diameter of the order of 1
 $\unicode[STIX]{x03BC}$
m, less than
 $1/10$
of the typical diameter of the inter-fibre pores of
 ${\sim}$
10
 $\unicode[STIX]{x03BC}$
m. Although the intra-fibre structure varied depending on the paper type, in all of the types a few layers of planar structures were randomly rounded to form a single fibre, and the intra-fibre pores were formed between the layers.
Figure 3 shows the measurements of the liquid imbibition through a paper strip (Filter II). Since
 $l^{2}$
is plotted with respect to
 $t$
, the slope of the straight line in figure 3 indicates
 $k^{2}$
in the Washburn equation. Compared with a straight line fitting the data up to
 ${\sim}7$
s, the data appear curved. The slope initially decreases with time and appears a constant after approximately
 ${\sim}70$
s, unlike the prediction made by the Washburn equation.
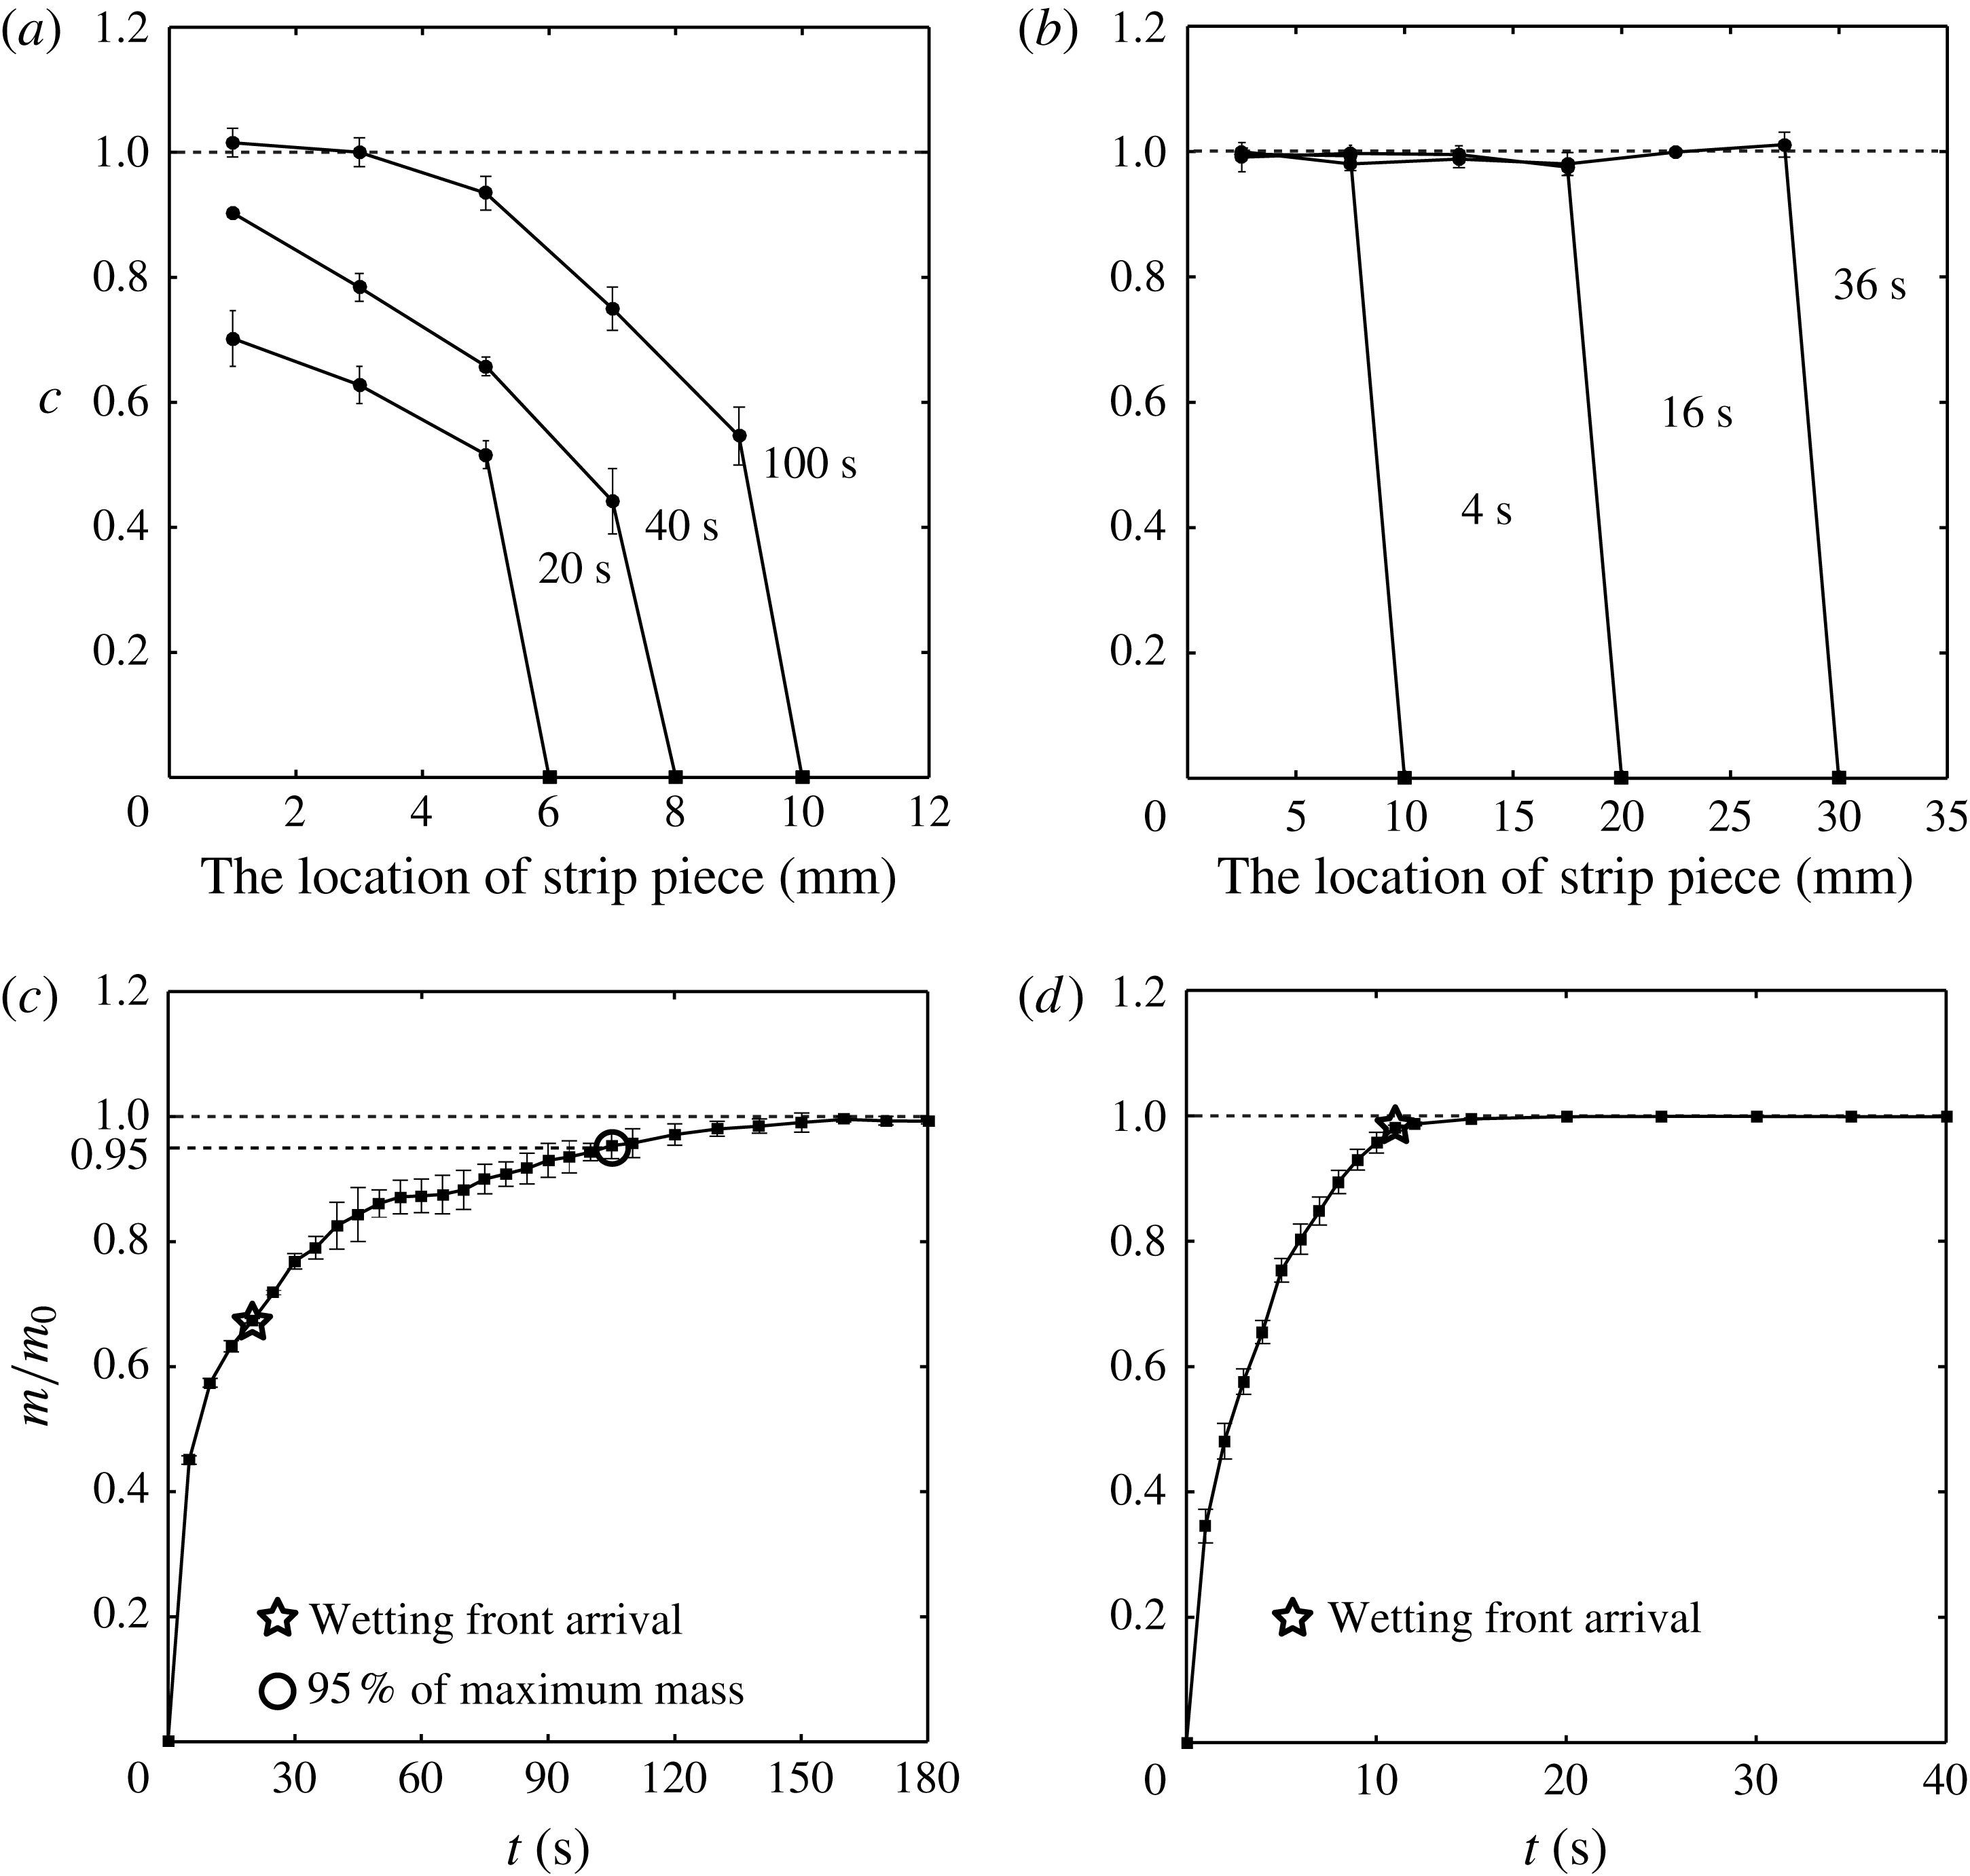
The distribution
 $c$
, the mass ratio of the absorbed liquid in each piece to the maximum liquid that can be absorbed into the piece, for (a) Filter II and (b) the non-woven fabric. The location of the strip piece represents the distance measured from the reservoir. The dependence of the silicone oil mass on time in (c) 5 mm strip of Filter II and (d) 15 mm non-woven fabric strip.
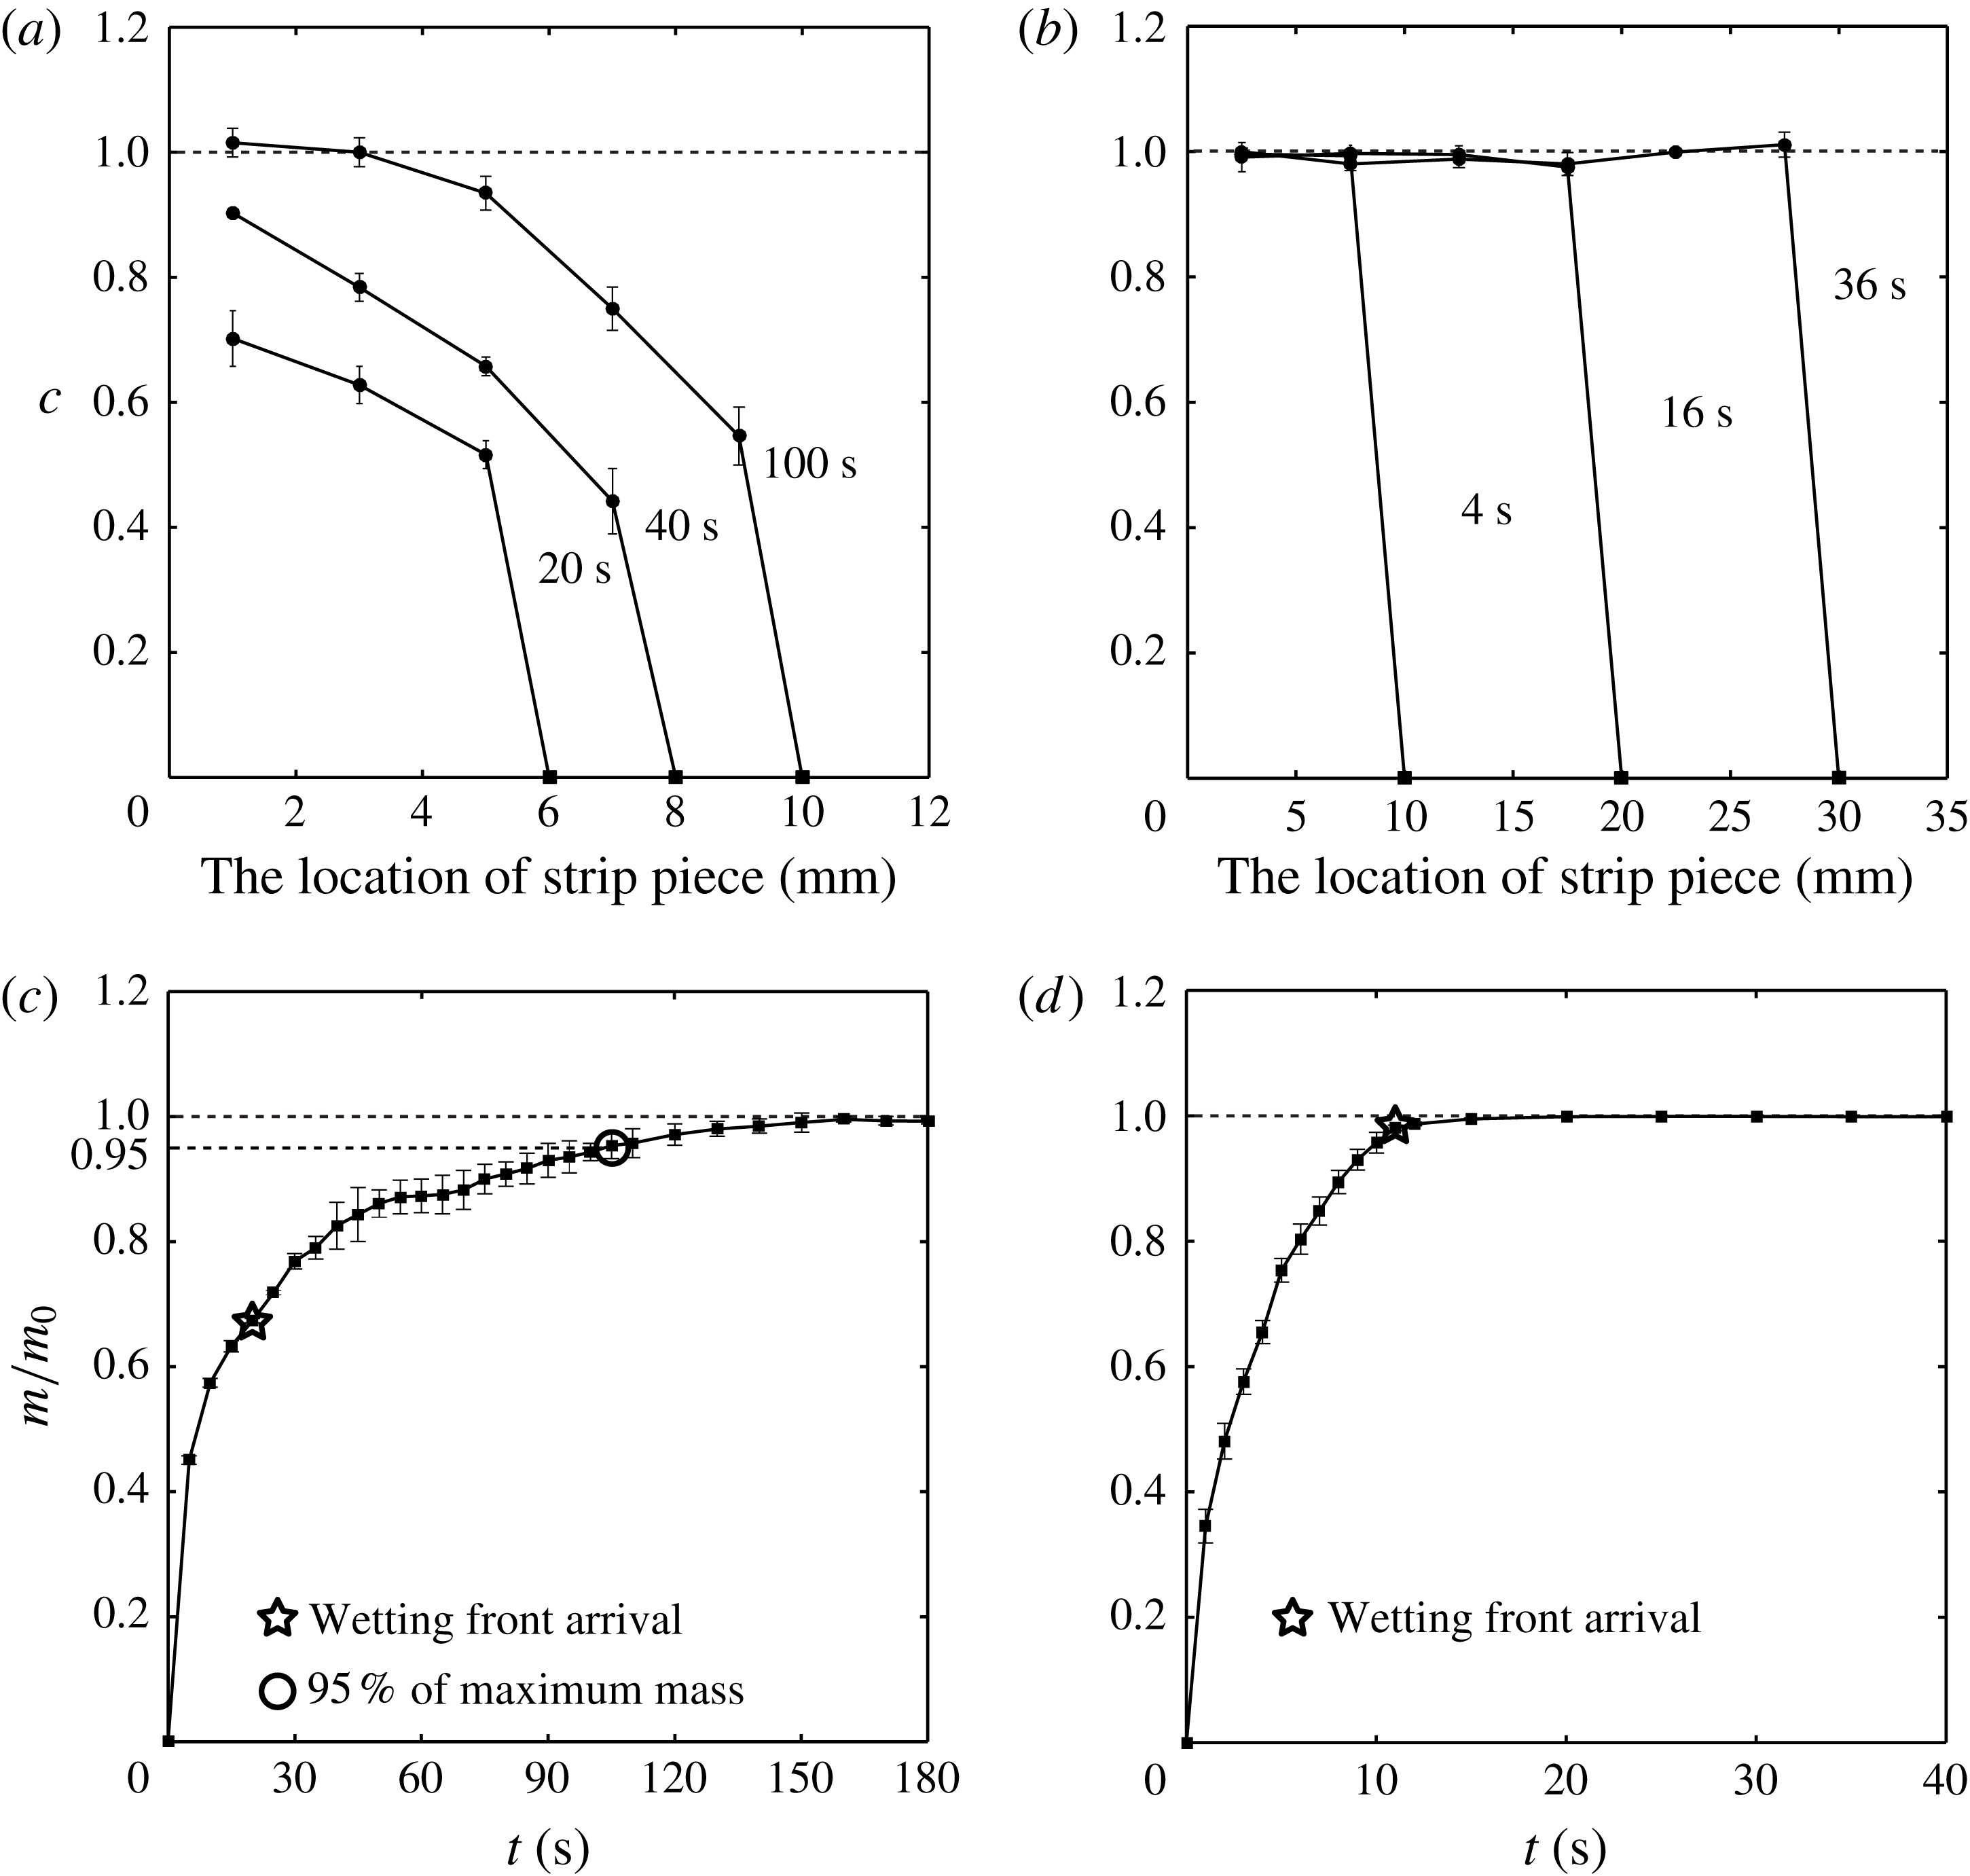
In figure 4(a,b), we present the measurements of the mass change of the pieces of Filter II and the non-woven fabric strip. For each line, the filled square located on the
 $x$
-axis denotes the upper limit of the location of the wetting front, which indicates the liquid absorbed in the inter-fibre pores. Therefore, figure 4(a) reveals that the region behind the wetting front continues to imbibe liquid, thus demonstrating the post-wetting flow. For instance, at the location 5 mm away from the reservoir, the pores begin to imbibe liquid at approximately 20 s, and the imbibition lasts until 100 s. When compared with the results for the non-woven fabric shown in figure 4(b), the post-wetting flow is clear. The non-woven fabric strip does not absorb the liquid behind the wetting front, as demonstrated by the collapsed data at
 $c=1$
. Figure 4(c,d) presents the time sequence of the mass of liquid absorbed in the strips of Filter II and non-woven fabric with lengths of 5 mm and 15 mm, respectively. We indicate the moment when the liquid front reaches the strip end with a star symbol, and the moment when the mass attains 95 % of its maximum with a circle symbol. The plots reveal that paper imbibes liquid even after the entire strip becomes seemingly wet, in contrast to the non-woven fabric.
We define
 $\unicode[STIX]{x1D713}$
as the volume ratio of intra- to inter-fibre pores and
 $t_{c}$
as the time for filling the intra-fibre pores. The size of the intra-fibre pores is one order less than the inter-fibre pores, so that it can be assumed that the flow speed through intra-fibre pores is much lower than that through inter-fibre pores. Accordingly, with a relatively short strip, only a small portion of the intra-fibre pores was filled with liquid until the wetting front arrived at the strip end. This enabled us to estimate
 $\unicode[STIX]{x1D713}$
as the mass ratio between the absorbed liquid until the liquid front reaches the strip end and the liquid additionally absorbed to the ultimate state. In addition, we experimentally estimated
 $t_{c}$
as the time difference between the instants when the wetting front reached the strip end and when the mass reached 95 % of the maximum, which are denoted by the star and circle in figure 4(c), respectively. We also obtained
 $k$
from
 $l^{2}=k^{2}t$
in the measurements for
 $0.1t_{c}$
. We list our estimations of
 $k$
,
 $t_{c}$
and
 $\unicode[STIX]{x1D713}$
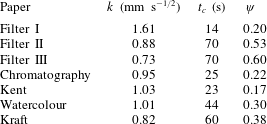
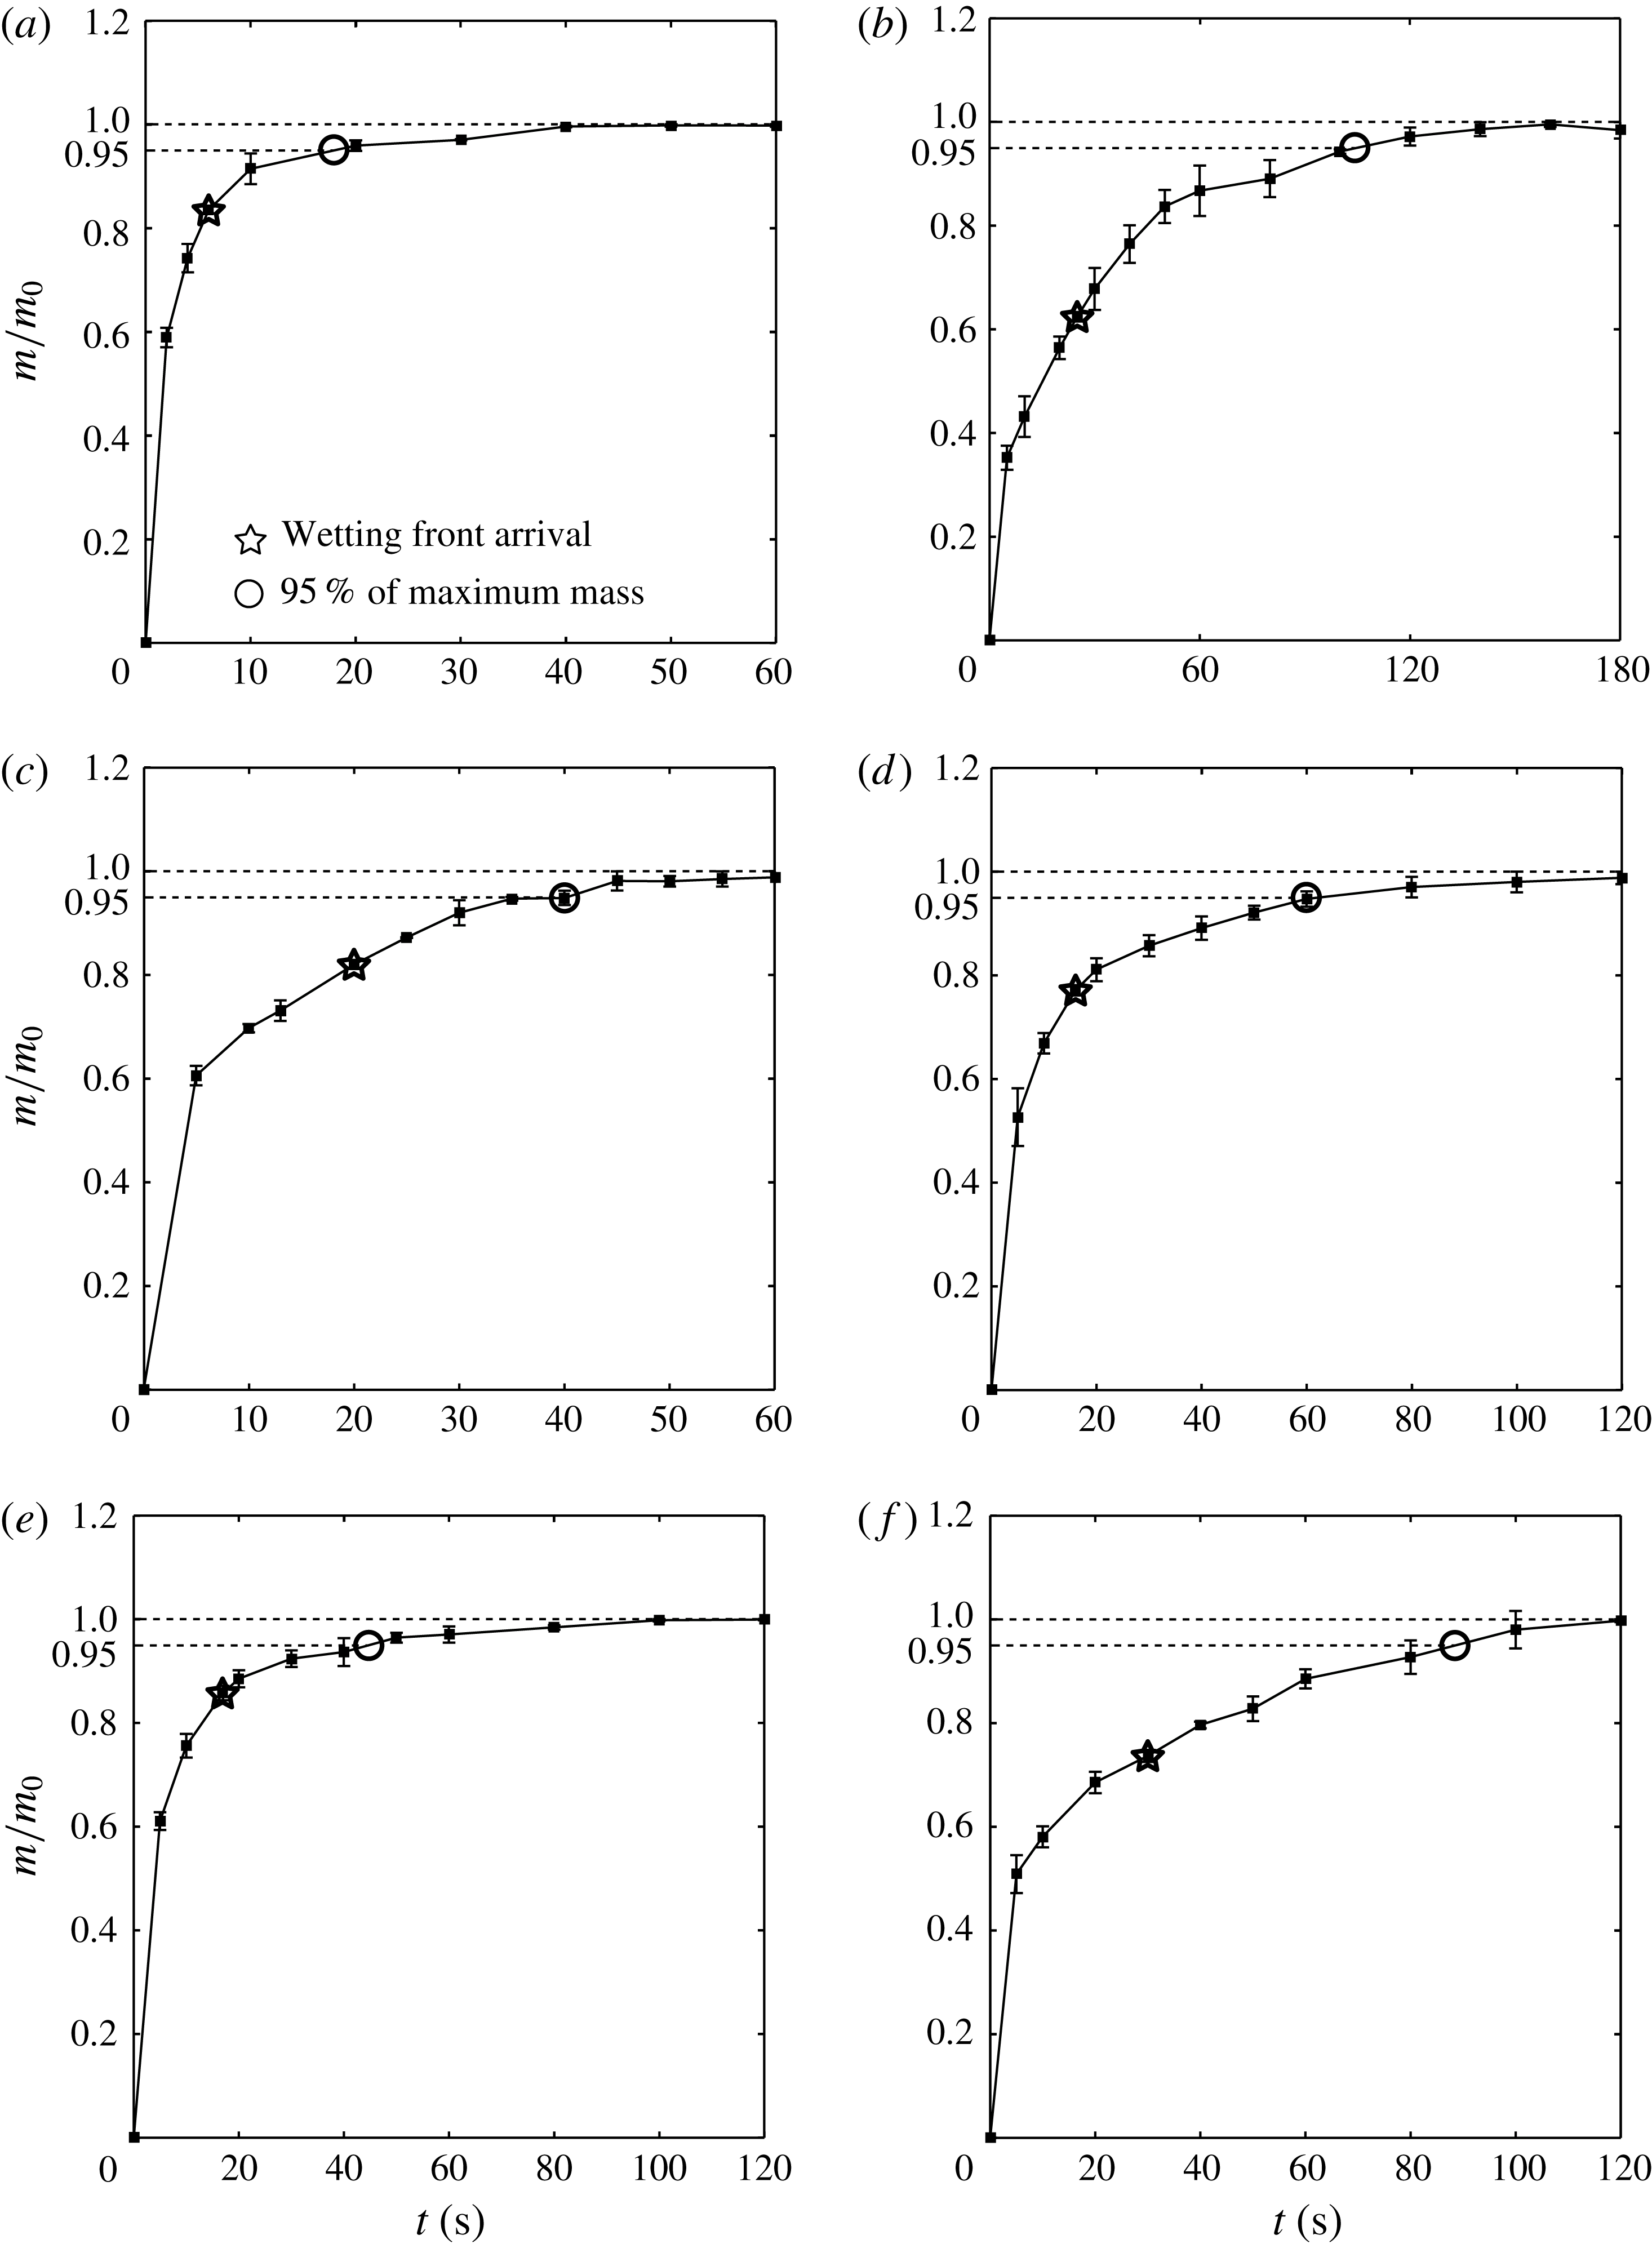
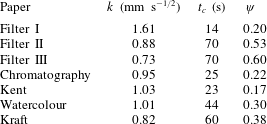
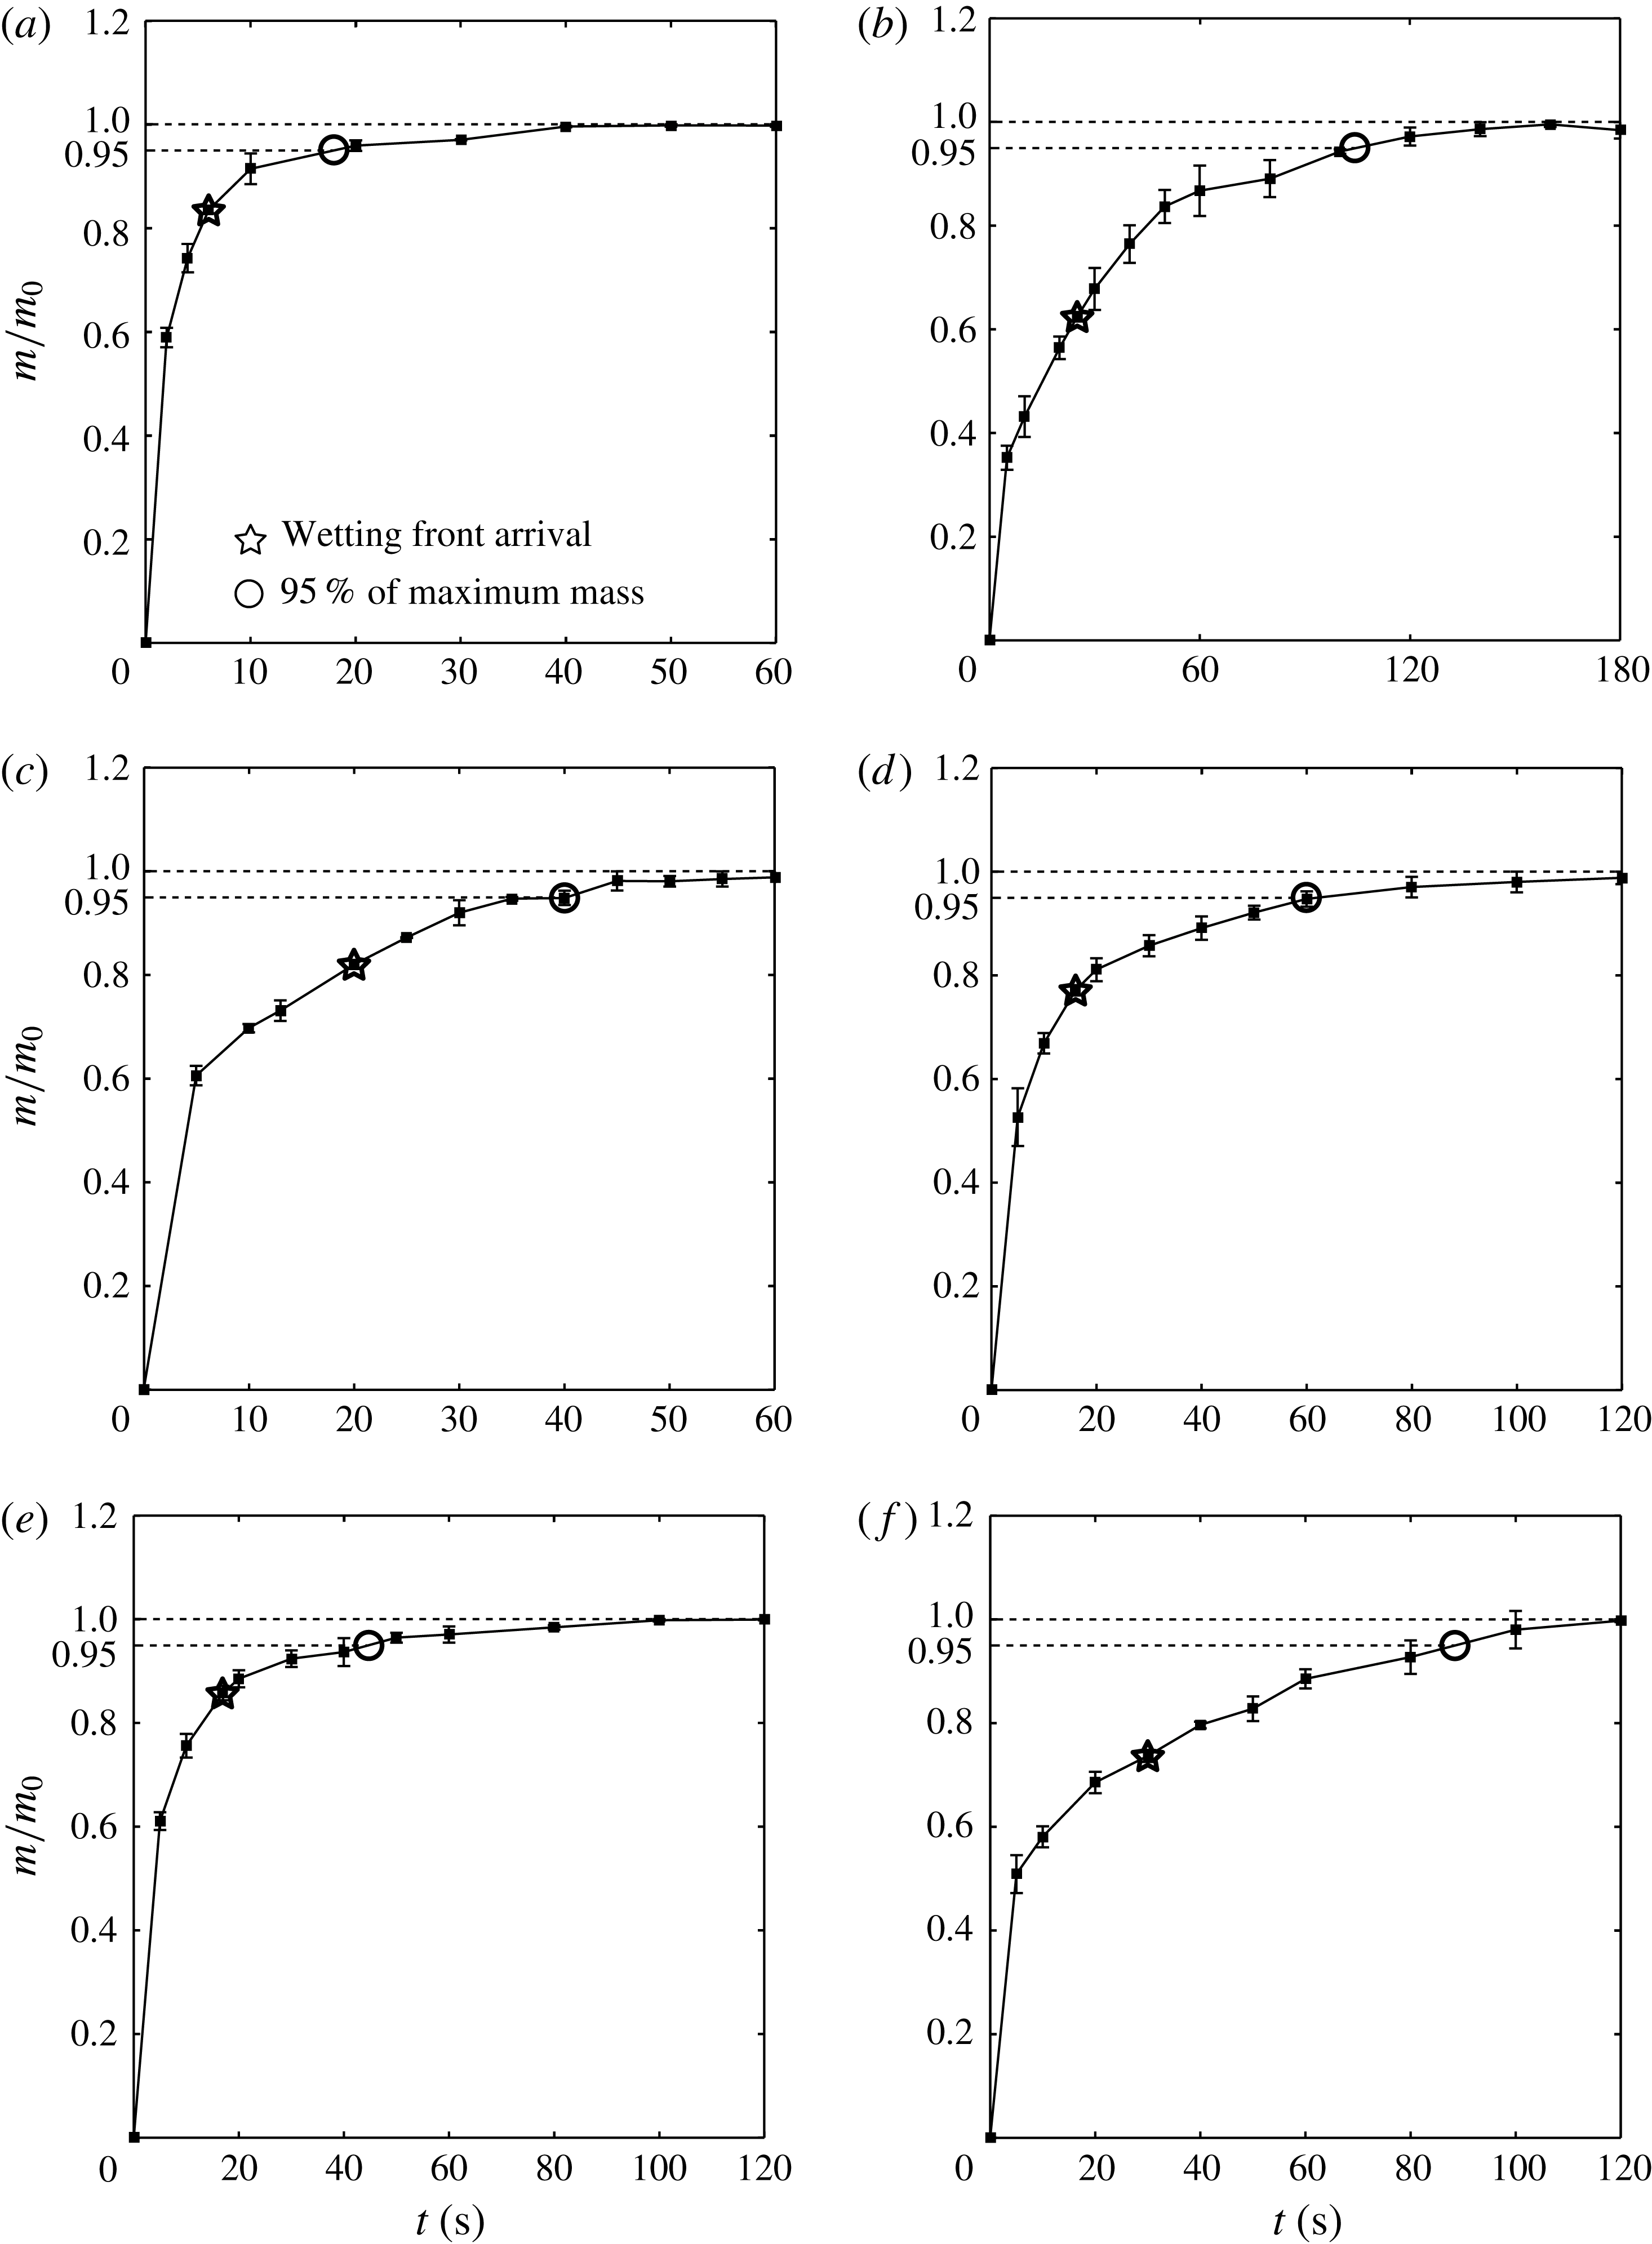
for the various types of papers in table 1. The experimental measurements for various papers are given in figure 5.
Experimental estimation of
 $k$
,
 $t_{c}$
and
 $\unicode[STIX]{x1D713}$
of various papers for silicone oil with a viscosity of 5 mPa s.
The time dependence of the mass of the silicone oil absorbed in a 5 mm strip of (a) Filter I, (b) Filter III, (c) chromatography paper, (d) Kent paper, (e) watercolour paper and (f) kraft paper.
3 Theoretical analysis
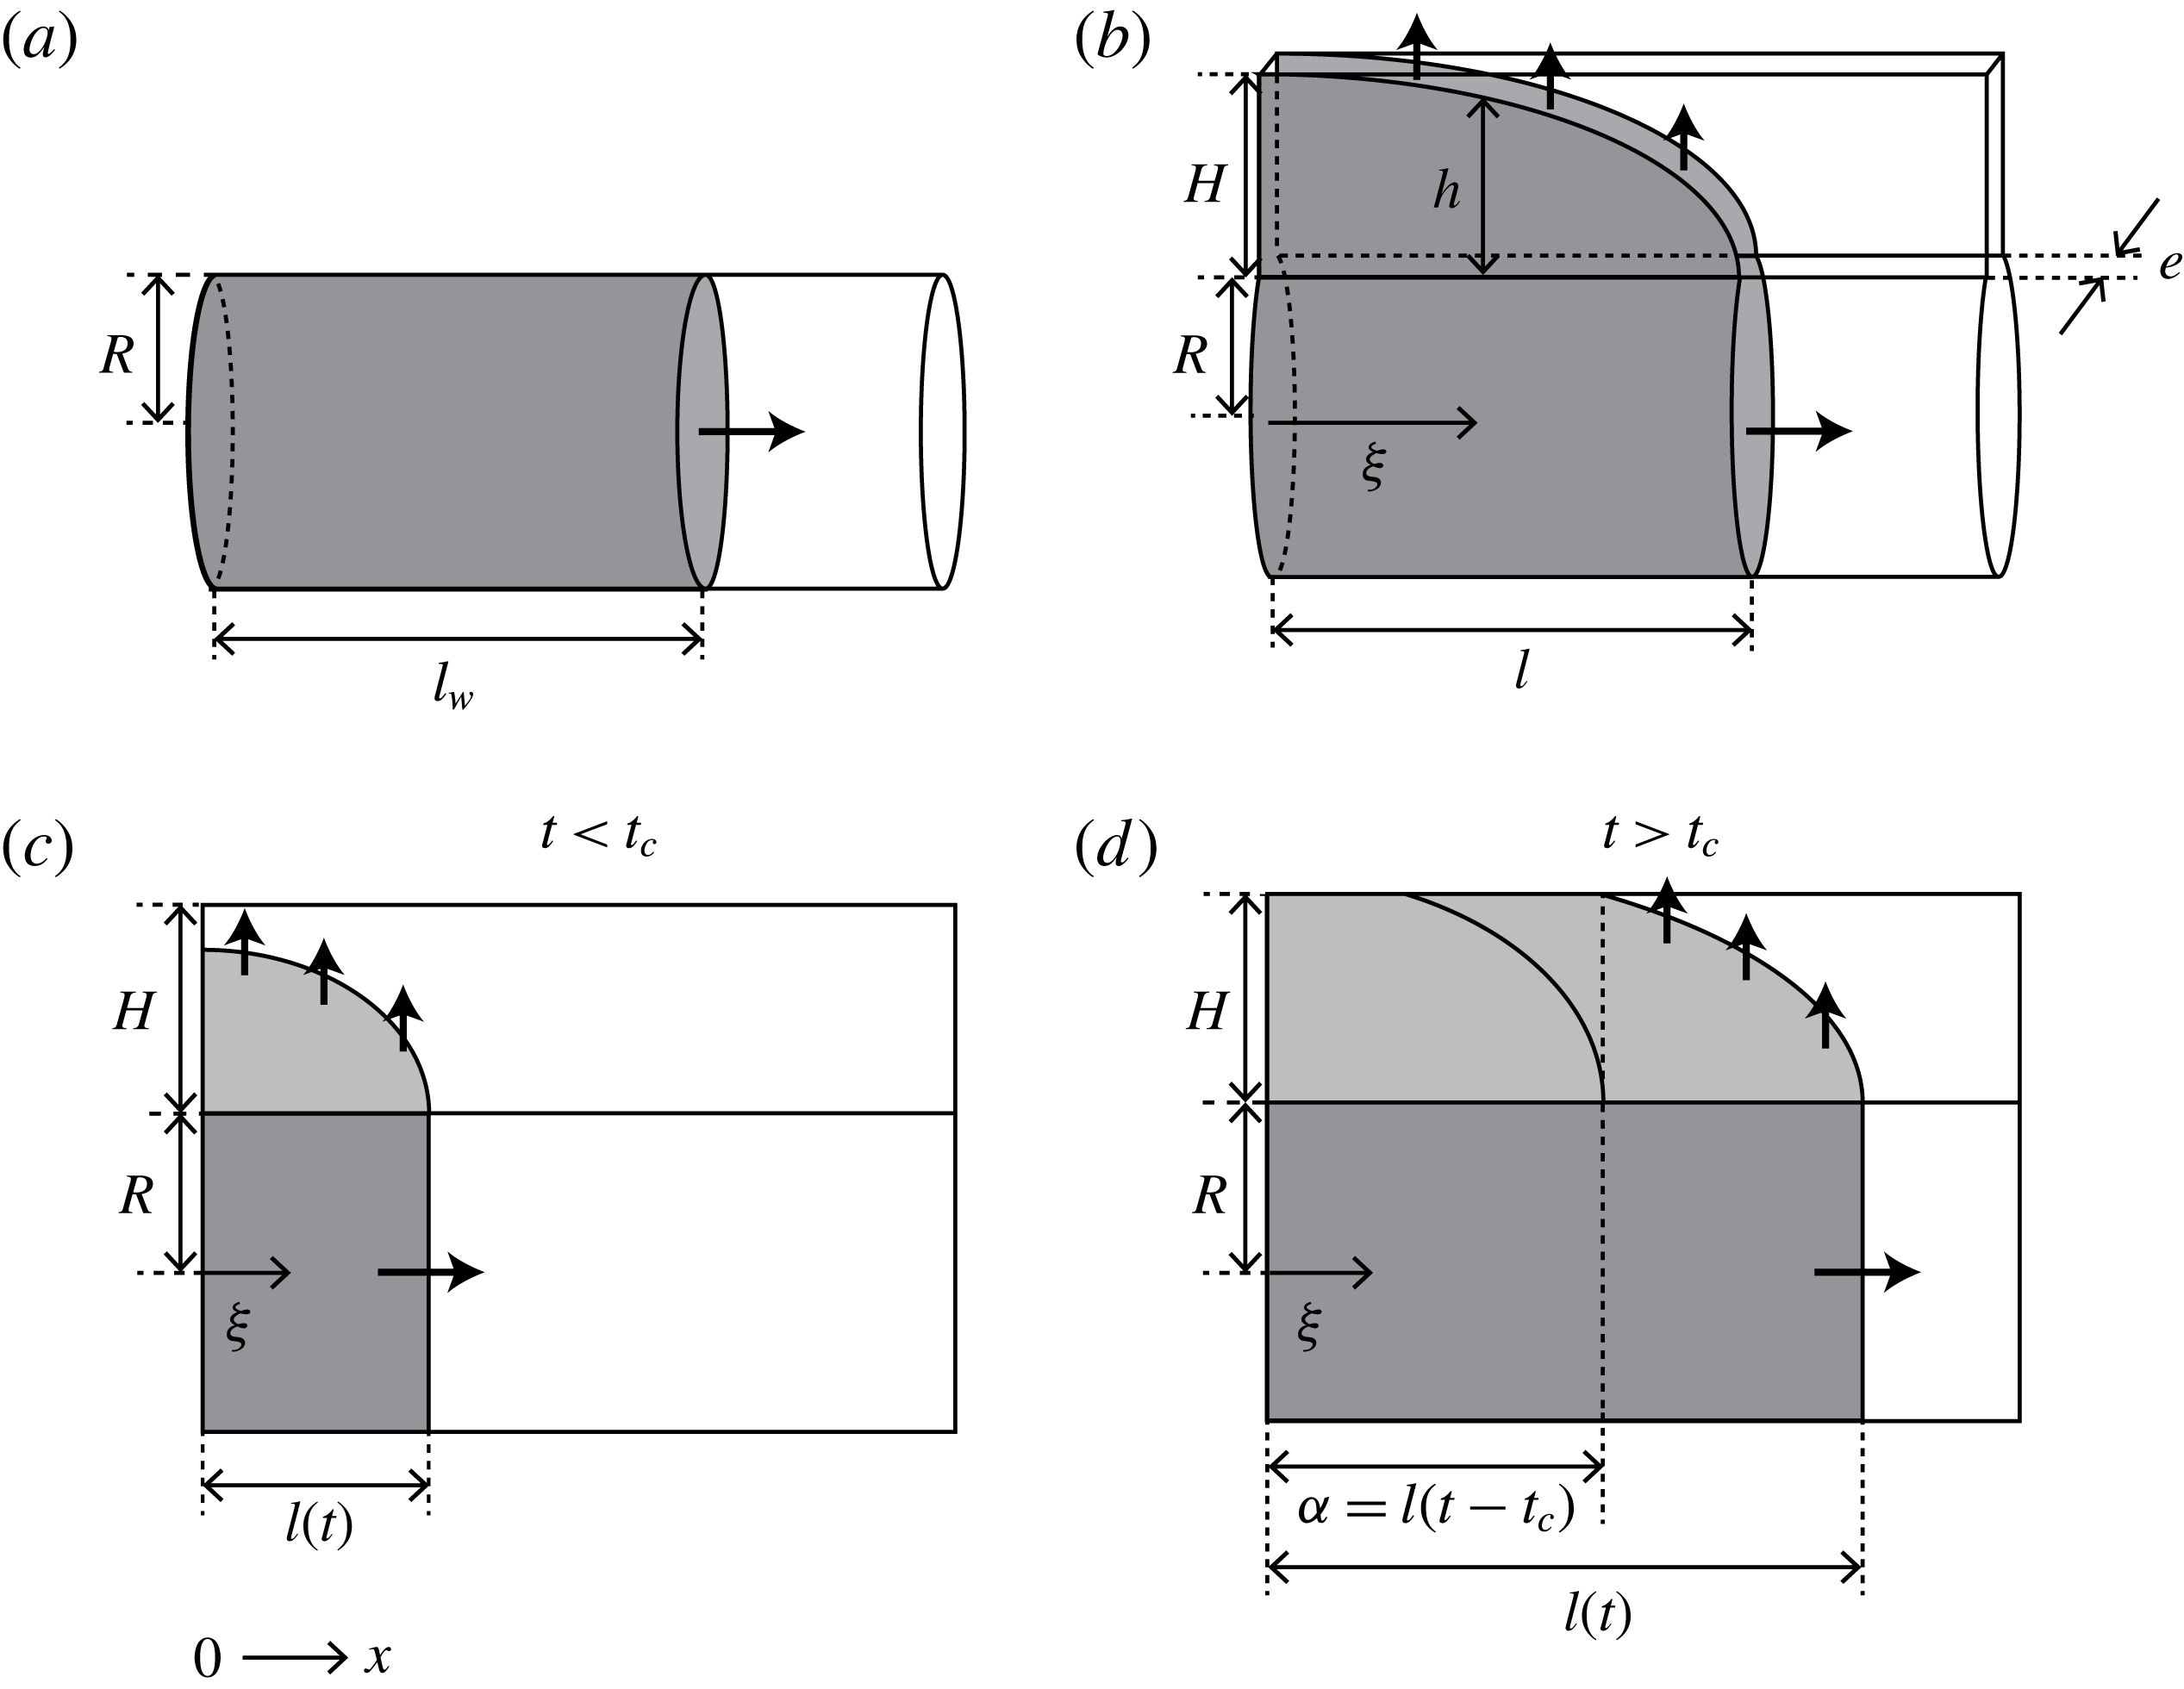
We start the theoretical analysis by constructing a geometric model which includes intra-fibre pores as well as inter-fibre pores, as shown in figure 6. Compared to the cylindrical tube used in developing the Washburn equation, our model has an additional slit formed by two parallel plates connected to a cylindrical tube. The cylindrical tube corresponds to the inter-fibre pores while the slit corresponds to intra-fibre pores. As liquid flows through the cylindrical tube, it can also enter the slit by capillarity. The flow in the slit is assumed to be one-dimensional, and perpendicular to the cylindrical tube. We further assume that the radius
 $R$
of the cylindrical tube is the average radius of the inter-fibre pores, and the gap of the slit
 $e$
is the average diameter of the intra-fibre pores. The height of the parallel plates
 $H$
determines the volume of the intra-fibre pores.
The capillary tube geometries for (a) the Washburn equation and (b) our model. Schematics of liquid in the pores (c)
 $t<t_{c}$
and (d)
 $t>t_{c}$
.
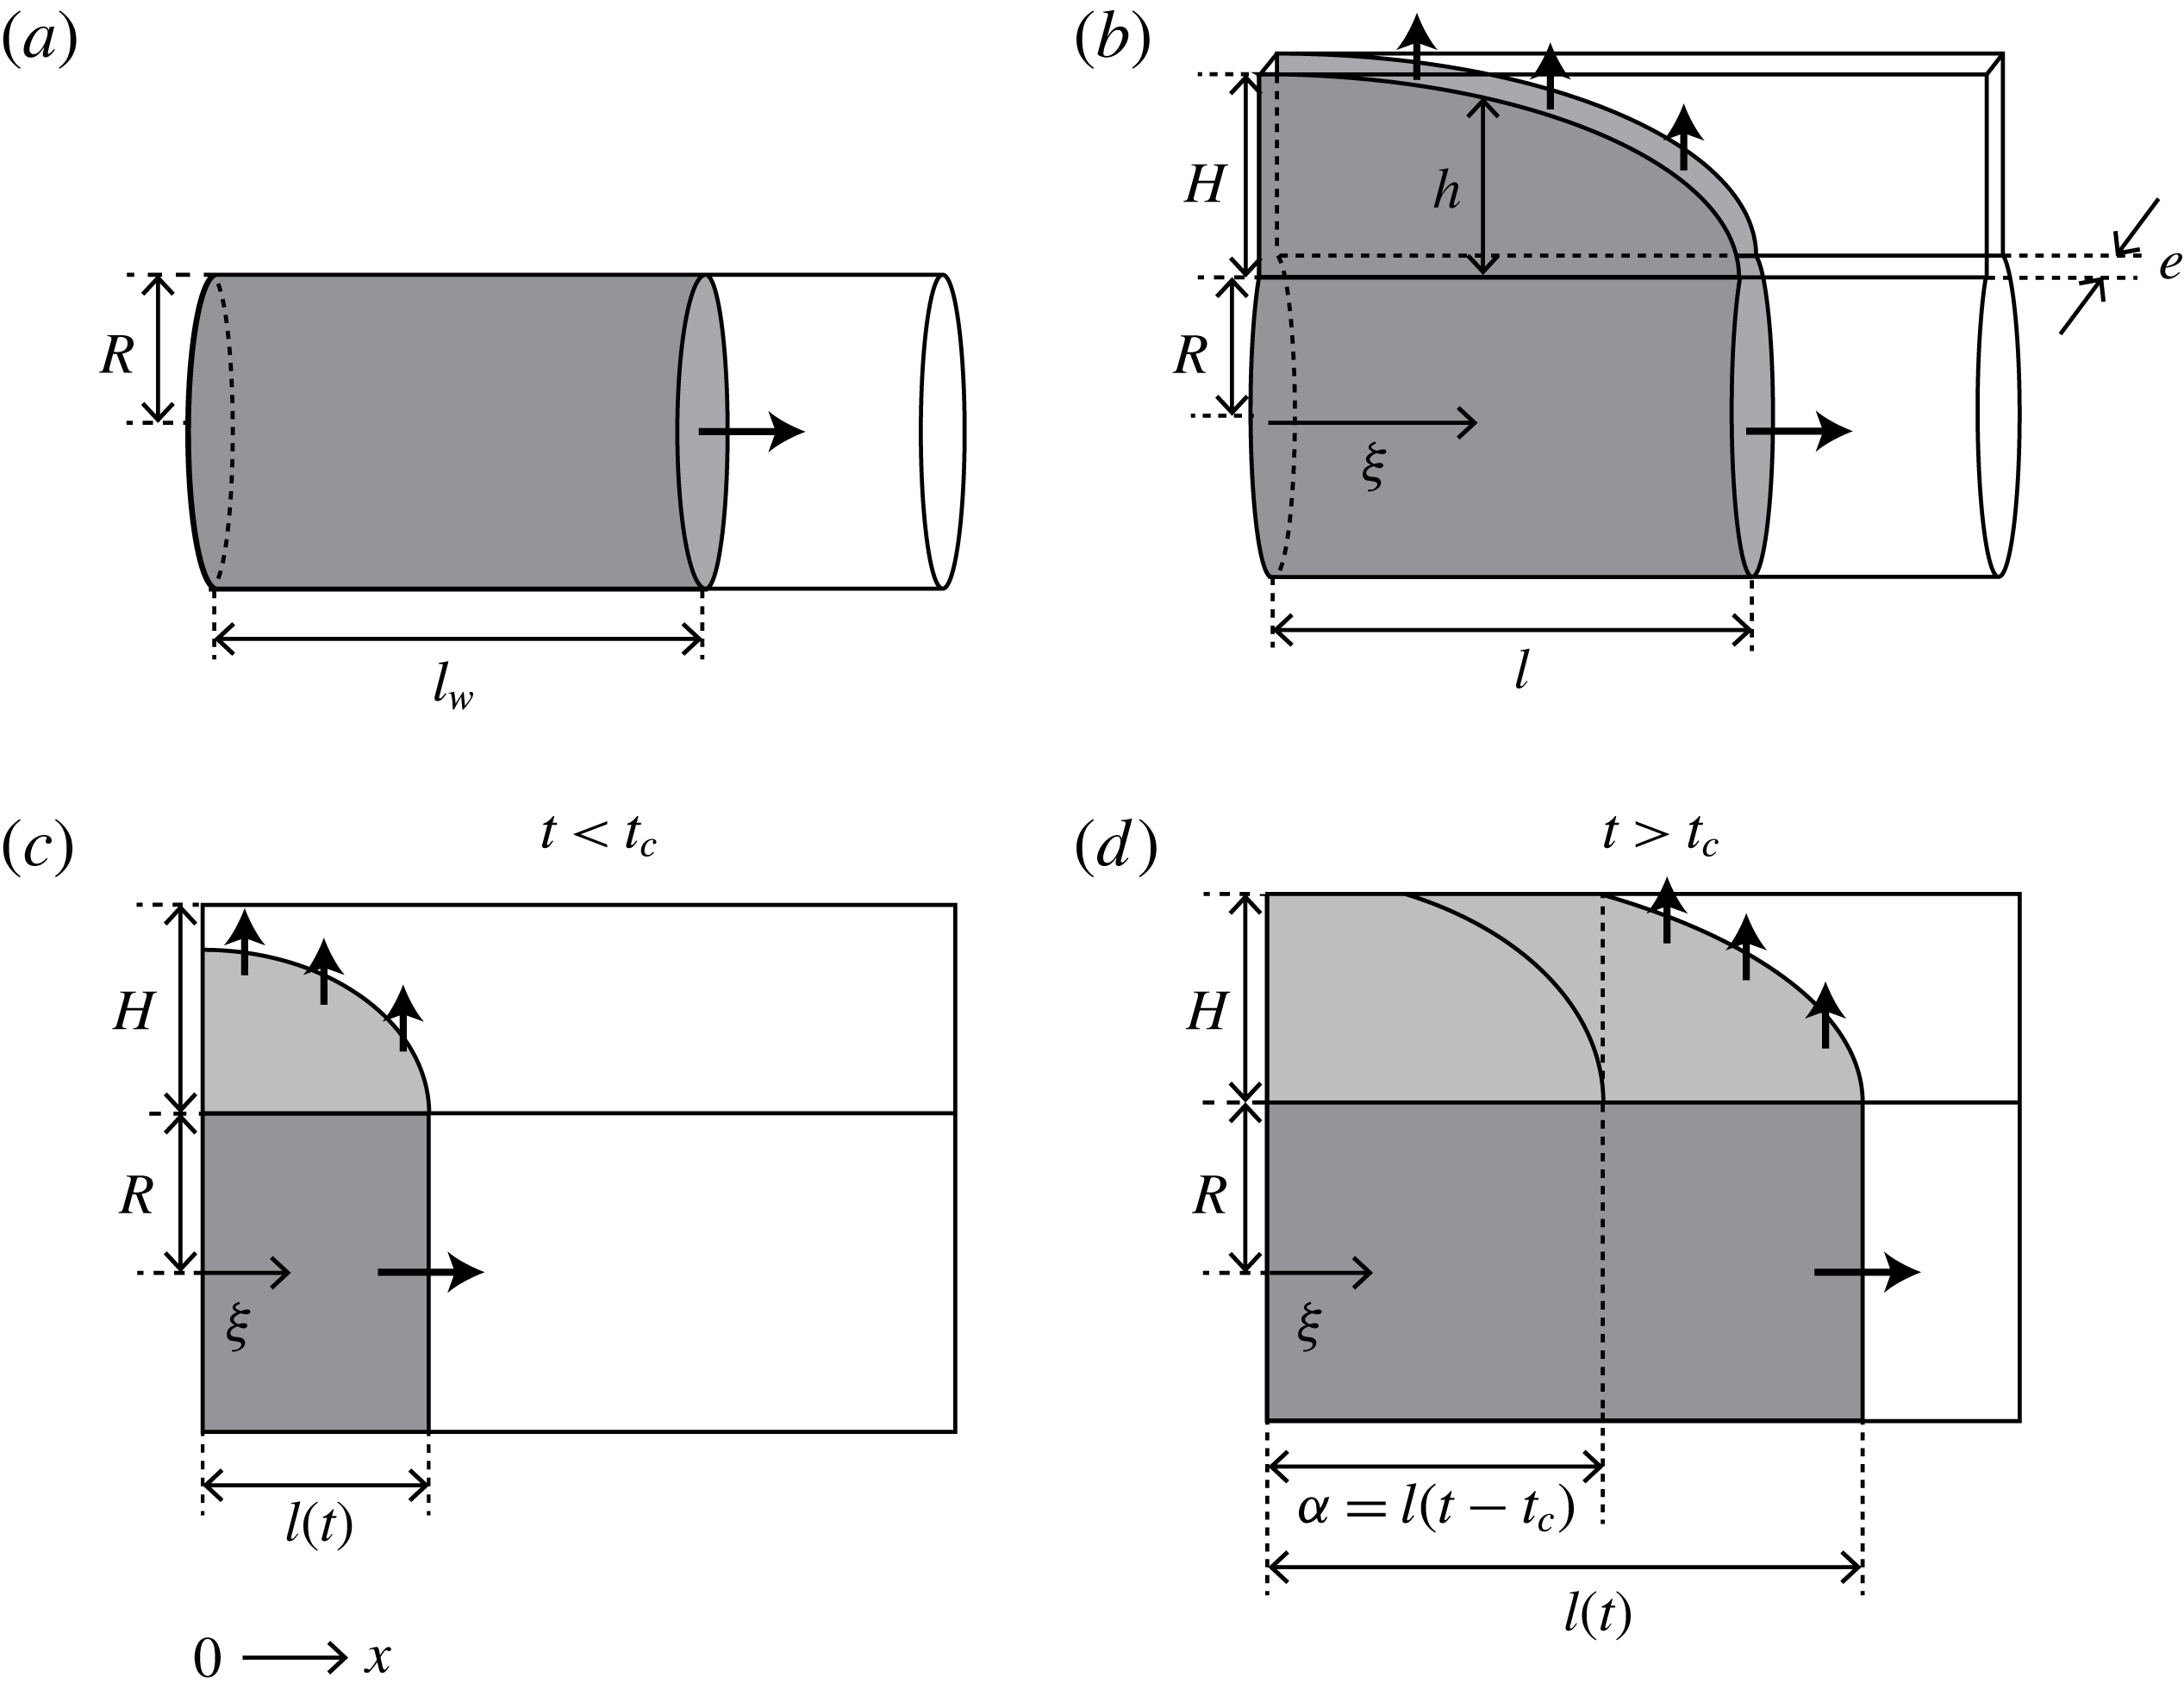
We consider flow in the slit at a specific time
 $t$
when the cylindrical tube imbibes the liquid up to a length of
 $l$
. At a specific location away from the tube inlet by
 $\unicode[STIX]{x1D709}$
, the balance between the capillary force and viscous resistance in the slit is given by
 $\unicode[STIX]{x1D70E}e\sim \unicode[STIX]{x1D707}hh^{\prime }$
, where
 $h$
and
 $h^{\prime }$
are the imbibition length and speed in the slit, respectively. We define
 $k_{s}$
as the proportional constant between
 $h$
and the suction time so that the imbibition length in the slit is given by
 $$\begin{eqnarray}\displaystyle h(\unicode[STIX]{x1D709})=k_{s}\sqrt{t-\unicode[STIX]{x1D70F}}, & & \displaystyle\end{eqnarray}$$
where
 $\unicode[STIX]{x1D70F}$
is the time satisfying
 $l(\unicode[STIX]{x1D70F})=\unicode[STIX]{x1D709}$
, and
 $t-\unicode[STIX]{x1D70F}$
is thus the local suction time through the slit.
The momentum equation in the cylindrical tube is also obtained from the balance between the capillary force and the viscous resistance. Because of the flow through the slit, the flow speed through the cylindrical tube is not uniform along the length. Accordingly, the momentum equation is given in an integral form,
 $\unicode[STIX]{x1D70E}\cos \unicode[STIX]{x1D703}(2\unicode[STIX]{x03C0}R)=\int _{0}^{l}\unicode[STIX]{x1D6FE}(2\unicode[STIX]{x03C0}R)\,\text{d}\unicode[STIX]{x1D709}$
, where
 $\unicode[STIX]{x1D6FE}=4\unicode[STIX]{x1D707}u/R$
is the local shear stress on the inner surface of the cylindrical tube with
 $u$
being the local average flow speed in the tube. Using
 $k=\sqrt{\unicode[STIX]{x1D70E}R\cos \unicode[STIX]{x1D703}/(2\unicode[STIX]{x1D707})}$
, this equation can be simplified to
 $$\begin{eqnarray}\displaystyle \int _{0}^{l}u\,\text{d}\unicode[STIX]{x1D709}=\frac{1}{2}k^{2}. & & \displaystyle\end{eqnarray}$$
The momentum equations (3.1) and (3.2) are coupled via continuity of mass. The continuity equation in differential form is given by
 $-\unicode[STIX]{x03C0}R^{2}(\text{d}u/\text{d}\unicode[STIX]{x1D709})=eh^{\prime }$
, and integrating it from
 $\unicode[STIX]{x1D709}$
to
 $l$
yields:
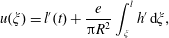 $$\begin{eqnarray}\displaystyle u(\unicode[STIX]{x1D709})=l^{\prime }(t)+\frac{e}{\unicode[STIX]{x03C0}R^{2}}\int _{\unicode[STIX]{x1D709}}^{l}h^{\prime }\,\text{d}\unicode[STIX]{x1D709}, & & \displaystyle\end{eqnarray}$$
with
 $l^{\prime }$
being
 $\text{d}l/\text{d}t$
, since
 $u(l)=l^{\prime }(t)$
.
To obtain
 $l(t)$
, we seek a single governing equation by combining (3.1)–(3.3). Depending on the time domain, two distinct forms of the coupled equation are given. Recall that we define
 $t_{c}$
as the time required for filling the slit so that
 $H=k_{s}\sqrt{t_{c}}$
. In case of
 $t<t_{c}$
, the entire slit behind the wetting front sucks liquid, whereas for
 $t>t_{c}$
, only the part of the slit sucks liquid because some part of the slit is fully filled as shown in figure 6(c,d). We first consider the former case. Since
 $h^{\prime }(\unicode[STIX]{x1D709})=k_{s}/(2\sqrt{t-\unicode[STIX]{x1D70F}})$
, substituting it in (3.3) yields
 $$\begin{eqnarray}\displaystyle u(\unicode[STIX]{x1D709})=l^{\prime }(t)+\frac{ek_{s}}{2\unicode[STIX]{x03C0}R^{2}}\int _{\unicode[STIX]{x1D70F}}^{t}\frac{l^{\prime }(\unicode[STIX]{x1D70F})}{\sqrt{t-\unicode[STIX]{x1D70F}}}\,\text{d}\unicode[STIX]{x1D70F}, & & \displaystyle\end{eqnarray}$$
where
 $\text{d}\unicode[STIX]{x1D709}=l^{\prime }(\unicode[STIX]{x1D70F})\,\text{d}\unicode[STIX]{x1D70F}$
is used. In (3.2), the local flow speed
 $u$
can be replaced with (3.4), so that
 $$\begin{eqnarray}\displaystyle l(t)l^{\prime }(t)+\frac{k_{s}e}{2\unicode[STIX]{x03C0}R^{2}}\int _{0}^{t}\left(\int _{\unicode[STIX]{x1D70F}}^{t}\frac{l^{\prime }(\unicode[STIX]{x1D70F})}{\sqrt{t-\unicode[STIX]{x1D70F}}}\,\text{d}\unicode[STIX]{x1D70F}\right)l^{\prime }(\unicode[STIX]{x1D70F})\,\text{d}\unicode[STIX]{x1D70F}=\frac{1}{2}k^{2}. & & \displaystyle\end{eqnarray}$$
We consider the case of
 $t>t_{c}$
. The flow speed in the cylindrical tube
 $u(\unicode[STIX]{x1D709})$
should be expressed by two different equations for
 $0<\unicode[STIX]{x1D709}<\unicode[STIX]{x1D6FC}$
and
 $\unicode[STIX]{x1D709}>\unicode[STIX]{x1D6FC}$
, where
 $\unicode[STIX]{x1D6FC}=l(t-t_{c})$
is the length of the slit that is saturated with liquid (see figure 6
d). In the range of
 $0<\unicode[STIX]{x1D709}<\unicode[STIX]{x1D6FC}$
, flow speed in the cylindrical tube is uniform as
 $u(\unicode[STIX]{x1D709})=l^{\prime }(t)+e/(\unicode[STIX]{x03C0}R^{2})\int _{\unicode[STIX]{x1D6FC}}^{l}h^{\prime }\,\text{d}\unicode[STIX]{x1D709}$
, in which substituting
 $h^{\prime }(\unicode[STIX]{x1D709})=k_{s}/(2\sqrt{t-\unicode[STIX]{x1D70F}})$
yields
 $$\begin{eqnarray}\displaystyle u(\unicode[STIX]{x1D709})=l^{\prime }(t)+\frac{ek_{s}}{2\unicode[STIX]{x03C0}R^{2}}\int _{t-t_{c}}^{t}\frac{l^{\prime }(\unicode[STIX]{x1D70F})}{\sqrt{t-\unicode[STIX]{x1D70F}}}\,\text{d}\unicode[STIX]{x1D70F}. & & \displaystyle\end{eqnarray}$$
In contrast, for
 $\unicode[STIX]{x1D709}>\unicode[STIX]{x1D6FC}$
, the local speed in the circular tube depends on
 $\unicode[STIX]{x1D709}$
, so that
 $u(\unicode[STIX]{x1D709})$
is the same as (3.4). By combining the expressions of
 $u(\unicode[STIX]{x1D709})$
with (3.2), one can derive the equation of
 $l$
:
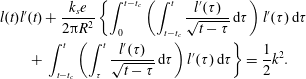 $$\begin{eqnarray}\displaystyle & & \displaystyle l(t)l^{\prime }(t)+\frac{k_{s}e}{2\unicode[STIX]{x03C0}R^{2}}\left\{\int _{0}^{t-t_{c}}\left(\int _{t-t_{c}}^{t}\frac{l^{\prime }(\unicode[STIX]{x1D70F})}{\sqrt{t-\unicode[STIX]{x1D70F}}}\,\text{d}\unicode[STIX]{x1D70F}\right)l^{\prime }(\unicode[STIX]{x1D70F})\,\text{d}\unicode[STIX]{x1D70F}\right.\nonumber\\ \displaystyle & & \displaystyle \qquad \left.+\,\int _{t-t_{c}}^{t}\left(\int _{\unicode[STIX]{x1D70F}}^{t}\frac{l^{\prime }(\unicode[STIX]{x1D70F})}{\sqrt{t-\unicode[STIX]{x1D70F}}}\,\text{d}\unicode[STIX]{x1D70F}\right)l^{\prime }(\unicode[STIX]{x1D70F})\,\text{d}\unicode[STIX]{x1D70F}\right\}=\frac{1}{2}k^{2}.\end{eqnarray}$$
We non-dimensionalize (3.5) and (3.7) by using
 $t_{c}$
and
 $l_{c}=k\sqrt{t_{c}}$
. The governing equations in terms of the dimensionless parameters
 $l^{\ast }=l/l_{c}$
and
 $t^{\ast }=t/t_{c}$
are given by
 $$\begin{eqnarray}\displaystyle l^{\ast }(t^{\ast }){l^{\ast }}^{\prime }(t^{\ast })+{\textstyle \frac{1}{2}}\unicode[STIX]{x1D713}f(t^{\ast })={\textstyle \frac{1}{2}}, & & \displaystyle\end{eqnarray}$$
where
 $$\begin{eqnarray}\displaystyle f(t^{\ast })=\left\{\begin{array}{@{}l@{}}\displaystyle \int _{0}^{t^{\ast }}\left(\int _{\unicode[STIX]{x1D70F}^{\ast }}^{t^{\ast }}\frac{{l^{\ast }}^{\prime }(\unicode[STIX]{x1D70F}^{\ast })}{\sqrt{t^{\ast }-\unicode[STIX]{x1D70F}^{\ast }}}\,\text{d}\unicode[STIX]{x1D70F}^{\ast }\right){l^{\ast }}^{\prime }(\unicode[STIX]{x1D70F}^{\ast })\,\text{d}\unicode[STIX]{x1D70F}^{\ast },\quad t^{\ast }<1\\ \displaystyle \int _{0}^{t^{\ast }-1}\left(\int _{t^{\ast }-1}^{t^{\ast }}\frac{{l^{\ast }}^{\prime }(\unicode[STIX]{x1D70F}^{\ast })}{\sqrt{t^{\ast }-\unicode[STIX]{x1D70F}^{\ast }}}\,\text{d}\unicode[STIX]{x1D70F}^{\ast }\right){l^{\ast }}^{\prime }(\unicode[STIX]{x1D70F}^{\ast })\,\text{d}\unicode[STIX]{x1D70F}^{\ast }\\ \displaystyle \qquad +\,\int _{t^{\ast }-1}^{t^{\ast }}\left(\int _{\unicode[STIX]{x1D70F}^{\ast }}^{t^{\ast }}\frac{{l^{\ast }}^{\prime }(\unicode[STIX]{x1D70F}^{\ast })}{\sqrt{t^{\ast }-\unicode[STIX]{x1D70F}^{\ast }}}\,\text{d}\unicode[STIX]{x1D70F}^{\ast }\right){l^{\ast }}^{\prime }(\unicode[STIX]{x1D70F}^{\ast })\,\text{d}\unicode[STIX]{x1D70F}^{\ast }.\quad t^{\ast }>1.\end{array}\right. & & \displaystyle\end{eqnarray}$$
Here, we use
 $\unicode[STIX]{x1D713}=eH/\unicode[STIX]{x03C0}R^{2}$
, the volume ratio of the slit to the circular tube, which corresponds to the volume ratio of the intra-fibre to the inter-fibre pores. For
 $\unicode[STIX]{x1D713}=0$
, equation (3.8) is restored to the Washburn equation,
 $l^{\ast }(t^{\ast }){l^{\ast }}^{\prime }(t^{\ast })=1/2$
. Hence, the additional term to the Washburn equation arises from the flow through the slit.
4 Numerical solution
We numerically solve the dimensionless governing equation (3.8) for a given
 $\unicode[STIX]{x1D713}$
, as detailed in the numerical technique that follows. The dimensionless time domain
 $(0,t_{L}^{\ast })$
is divided into
 $n+1$
nodes which are
 $t_{0}^{\ast },t_{1}^{\ast },\ldots ,t_{n}^{\ast }(=t_{L}^{\ast })$
. We solve
 $l^{\ast }(t^{\ast }){l^{\ast }}^{\prime }(t^{\ast })+(\unicode[STIX]{x1D713}/2)f(t^{\ast })=1/2$
at
 $t_{m}^{\ast }$
, where
 $1\leqslant m\leqslant n$
. The integration of the equation from
 $t_{m-1}^{\ast }$
to
 $t_{m}^{\ast }$
is expressed as
 $\int _{l^{\ast }(t_{m-1}^{\ast })}^{l^{\ast }(t_{m}^{\ast })}l^{\ast }\,\text{d}l^{\ast }=\int _{t_{m-1}^{\ast }}^{t_{m}^{\ast }}\{1/2-(\unicode[STIX]{x1D713}/2)f(t^{\ast })\}\,\text{d}t^{\ast }$
. The numerical calculation of the equation leads to the simple form of
 $l^{\ast }(t_{m}^{\ast })=\sqrt{(1-\unicode[STIX]{x1D713}f(t_{m-1}^{\ast }))\unicode[STIX]{x1D6FF}t^{\ast }+l^{\ast }(t_{m-1}^{\ast })^{2}}$
, where
 $\unicode[STIX]{x1D6FF}t^{\ast }=t_{L}^{\ast }/n$
. Also,
 $f(t_{m}^{\ast })$
can be obtained from the numerical integration using the following discretized equations:
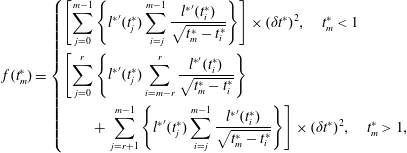 $$\begin{eqnarray}\displaystyle f(t_{m}^{\ast })=\left\{\begin{array}{@{}l@{}}\displaystyle \left[\mathop{\sum }_{j=0}^{m-1}\left\{{l^{\ast }}^{\prime }(t_{j}^{\ast })\mathop{\sum }_{i=j}^{m-1}\frac{{l^{\ast }}^{\prime }(t_{i}^{\ast })}{\sqrt{t_{m}^{\ast }-t_{i}^{\ast }}}\right\}\right]\times (\unicode[STIX]{x1D6FF}t^{\ast })^{2},\quad t_{m}^{\ast }<1\\ \displaystyle \left[\mathop{\sum }_{j=0}^{r}\left\{{l^{\ast }}^{\prime }(t_{j}^{\ast })\mathop{\sum }_{i=m-r}^{r}\frac{{l^{\ast }}^{\prime }(t_{i}^{\ast })}{\sqrt{t_{m}^{\ast }-t_{i}^{\ast }}}\right\}\right.\\ \displaystyle \left.\qquad +\,\mathop{\sum }_{j=r+1}^{m-1}\left\{{l^{\ast }}^{\prime }(t_{j}^{\ast })\mathop{\sum }_{i=j}^{m-1}\frac{{l^{\ast }}^{\prime }(t_{i}^{\ast })}{\sqrt{t_{m}^{\ast }-t_{i}^{\ast }}}\right\}\right]\times (\unicode[STIX]{x1D6FF}t^{\ast })^{2},\quad t_{m}^{\ast }>1,\end{array}\right. & & \displaystyle\end{eqnarray}$$
where
 $t_{r}^{\ast }<1$
and
 $t_{r+1}^{\ast }>1$
. Here,
 ${l^{\ast }}^{\prime }(t_{m}^{\ast })=\{1/2-(\unicode[STIX]{x1D713}/2)f(t_{m}^{\ast })\}/l^{\ast }(t_{m}^{\ast })$
is obtained from (3.8) with
 $l^{\ast }(t_{m}^{\ast })$
and
 $f(t_{m}^{\ast })$
. With the initial condition of
 $l^{\ast }(t_{0}^{\ast })=0$
, one can start sequential calculations from
 $t_{0}^{\ast }$
. We assume that
 $f(t_{0}^{\ast })=0$
and
 ${l^{\ast }}^{\prime }(t_{0}^{\ast })=1$
since the initial conditions are independent of the inter-fibre pores. The sequential computation provides the results from
 $l^{\ast }(t_{1}^{\ast })$
to
 $l^{\ast }(t_{L}^{\ast })$
.
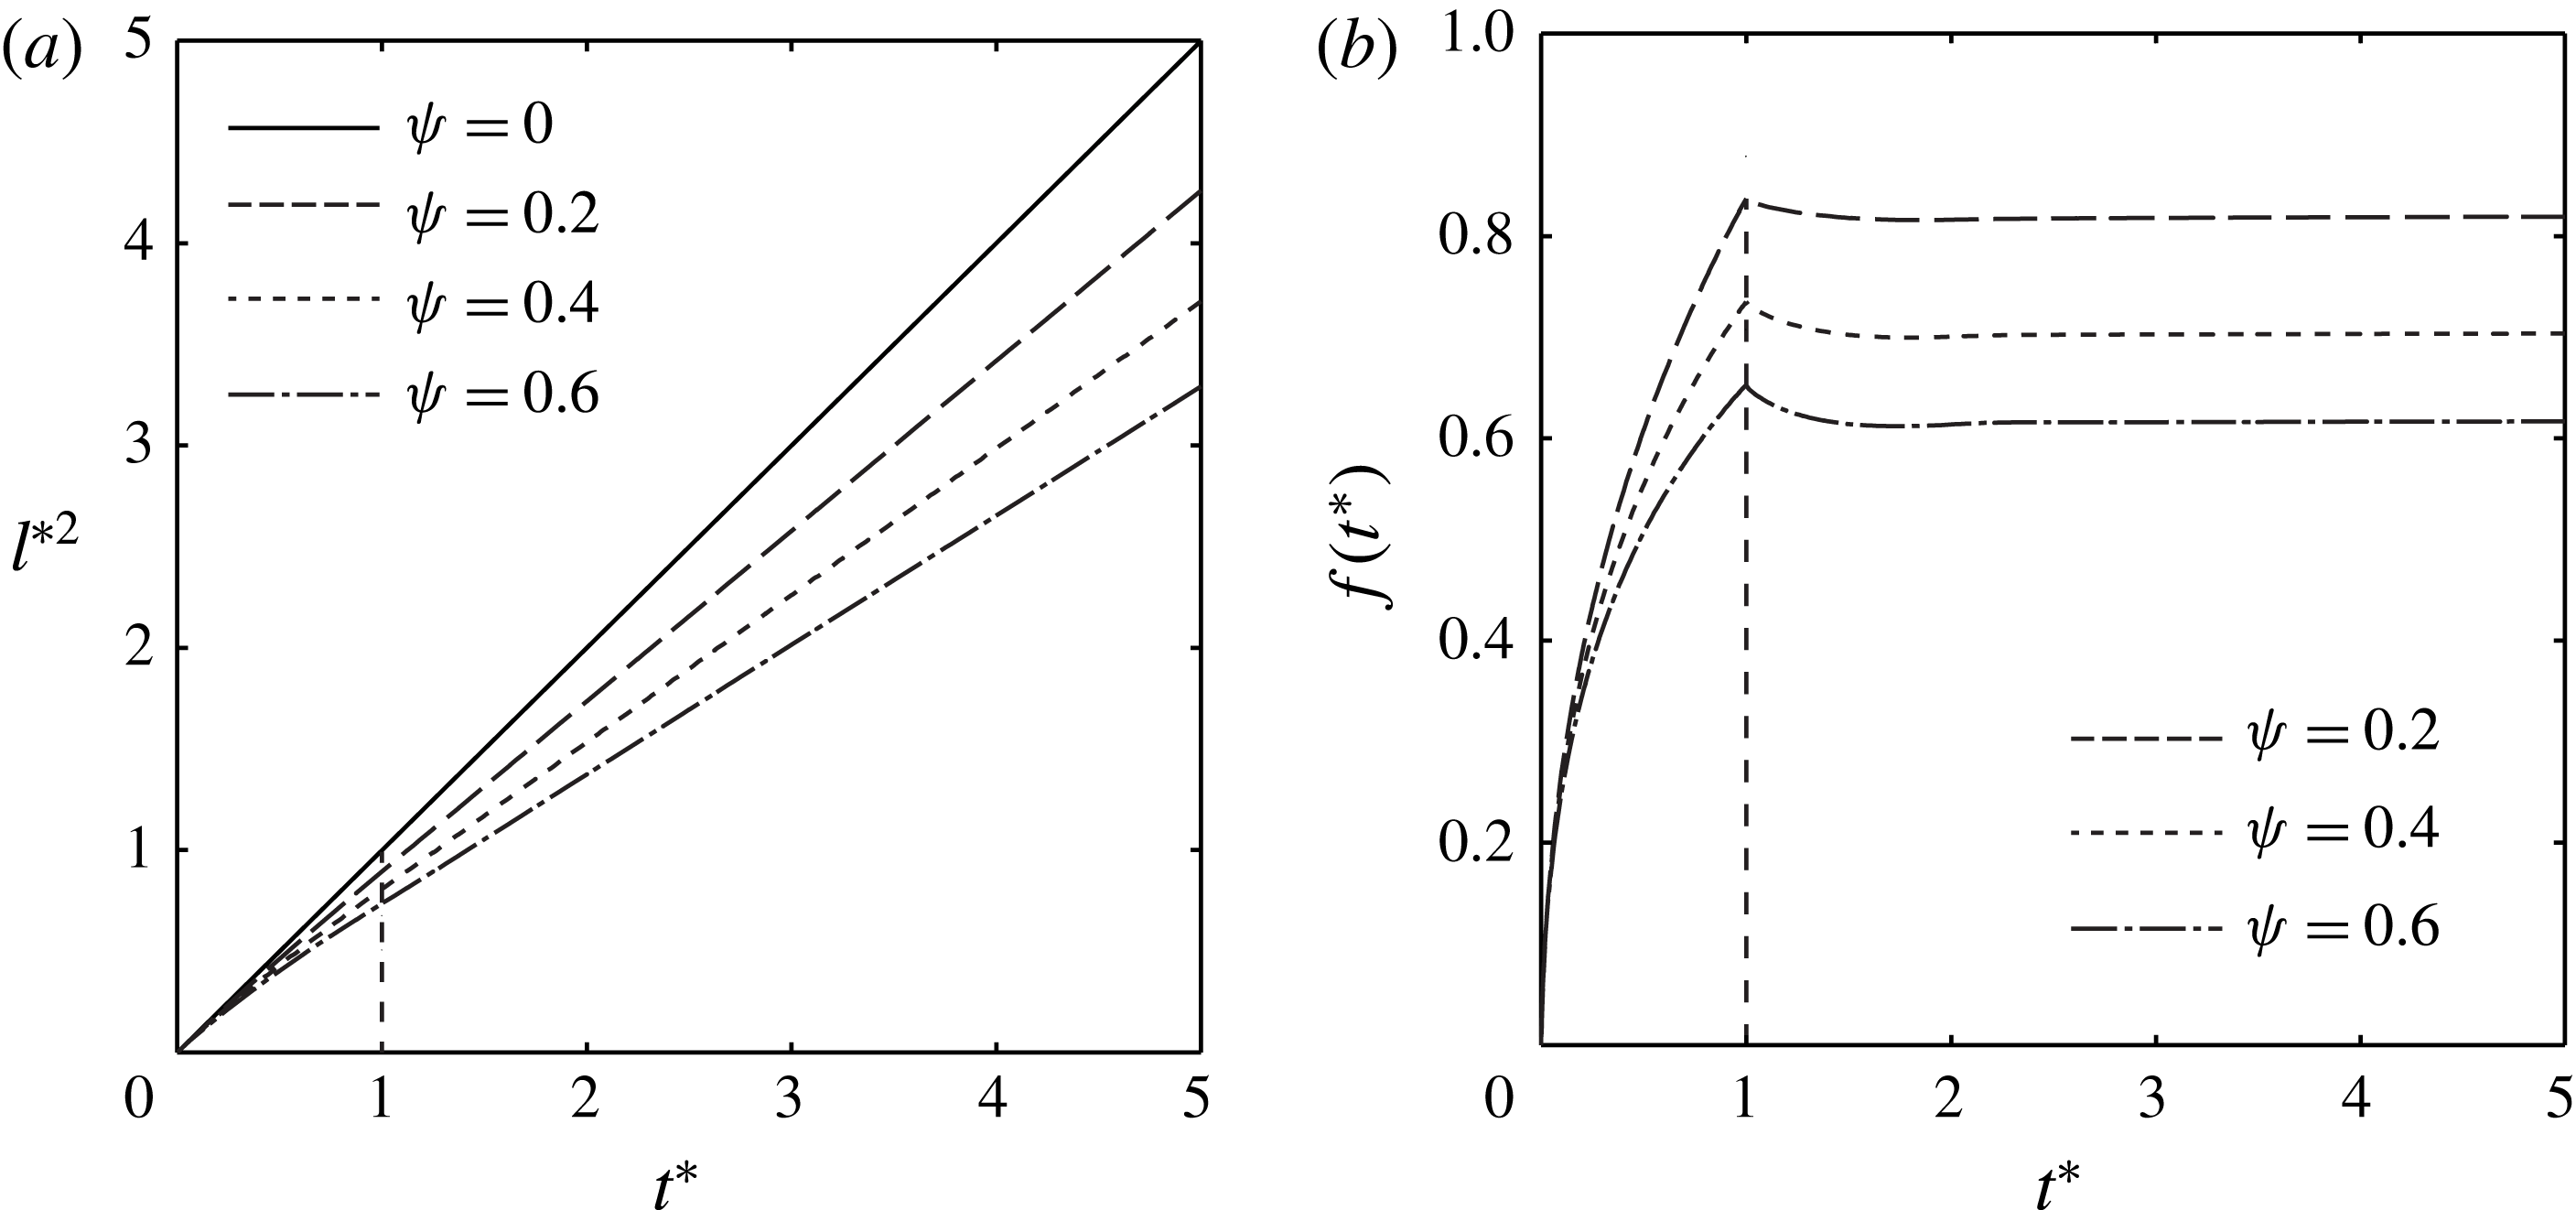
(a) The dependence of
 ${l^{\ast }}^{2}$
on
 $t^{\ast }$
and (b) the dependence of
 $f$
on
 $t^{\ast }$
for various
 $\unicode[STIX]{x1D713}$
of 0, 0.2, 0.4 and 0.6
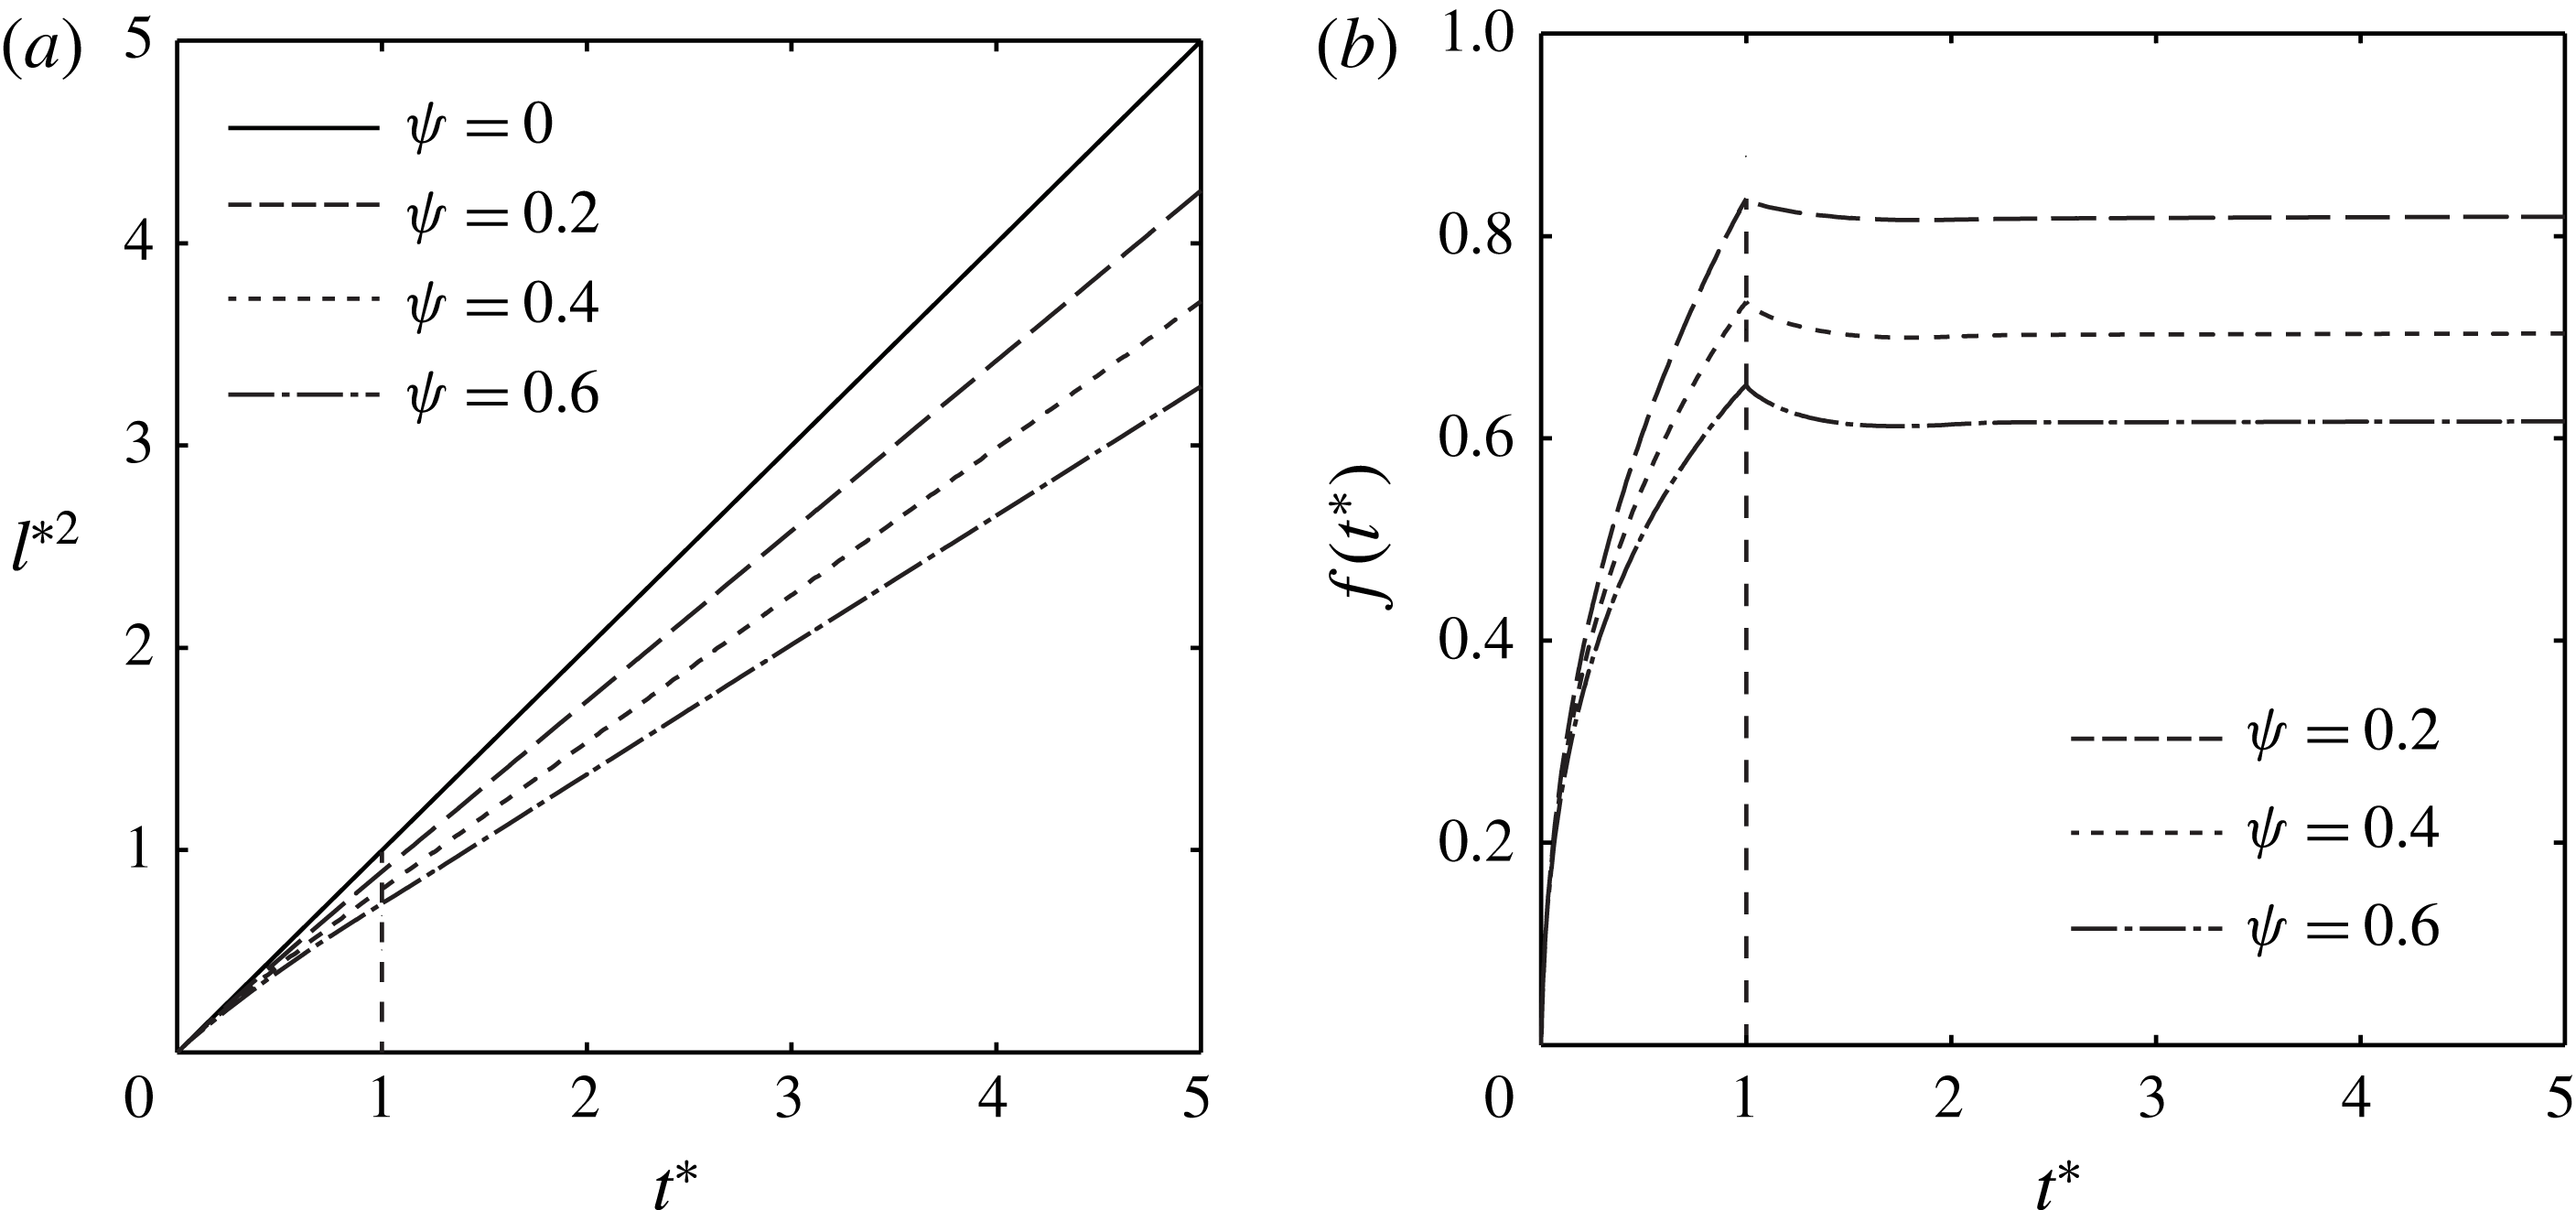
The results of the numerical calculation are shown in figure 7, where
 $l^{\ast 2}$
is plotted in terms of
 $t^{\ast }$
for various
 $\unicode[STIX]{x1D713}$
between 0 and 0.6, as found in the experiments (see table 1). While the results for
 $\unicode[STIX]{x1D713}=0$
correspond to the straight solid line given by
 $l^{\ast 2}=t^{\ast }$
, the solutions for
 $\unicode[STIX]{x1D713}\neq 0$
appear as the curved lines that deviate from the straight line, depending on
 $\unicode[STIX]{x1D713}$
. In the early phase (
 $t^{\ast }\ll 1$
), all the curves collapse to a single straight line,
 $l^{\ast 2}=t^{\ast }$
, regardless of
 $\unicode[STIX]{x1D713}$
. It is expected that just after the paper contacts the liquid, the flow speed through the cylindrical tube is relatively high, but only a small part of the slit imbibes liquid. Hence, in the very early stage of the imbibition, the flow dynamics is negligibly affected by the slit, and the flow speed primarily depends on
 $k$
. It is noteworthy that the lines
 $l^{\ast 2}$
in figure 7(a) are curved for
 $t^{\ast }<1$
and virtually straight for
 $t^{\ast }>1$
. As shown in figure 7(b),
 $f(t^{\ast })$
is almost constant with respect to
 $t^{\ast }$
for
 $t^{\ast }>1$
whereas it sharply increases with time in
 $t^{\ast }<1$
. Therefore, for
 $t^{\ast }>1$
, equation (3.8) has the form of
 $l^{\ast }(t^{\ast }){l^{\ast }}^{\prime }(t^{\ast })=\unicode[STIX]{x1D6FD}$
with
 $\unicode[STIX]{x1D6FD}$
being a constant, thus resulting in the straight lines of
 ${l^{\ast }}^{2}$
.
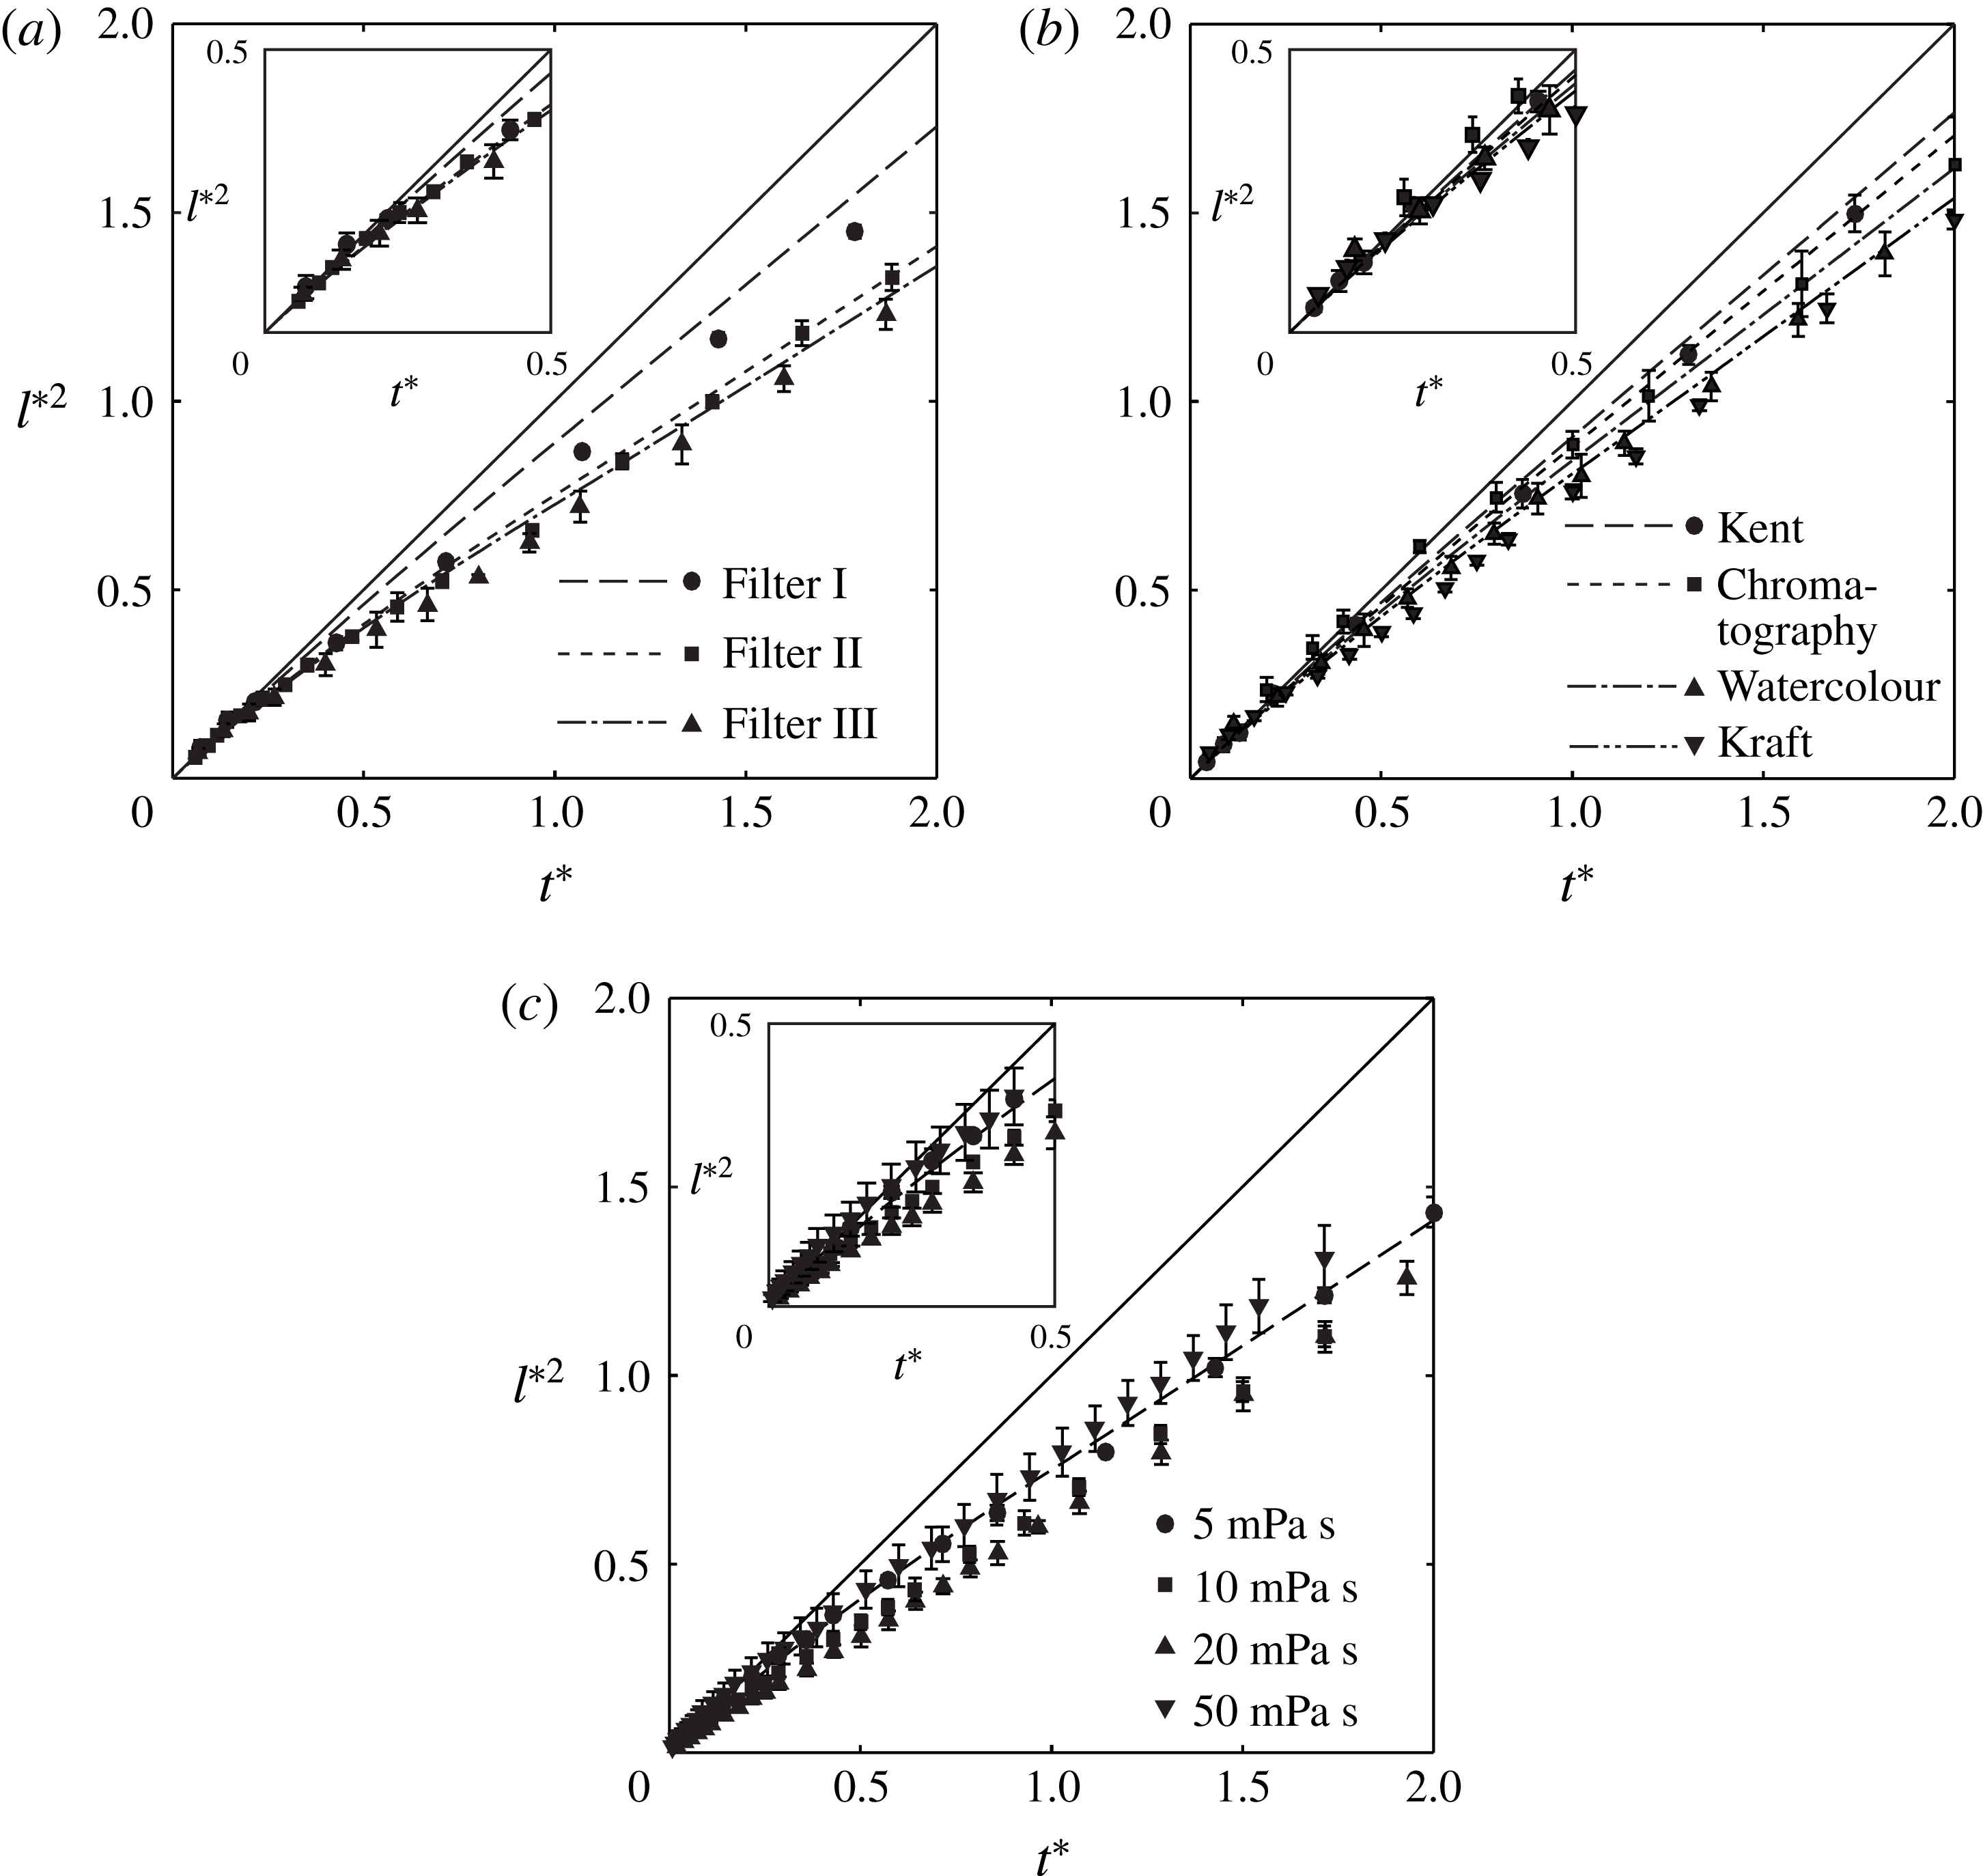
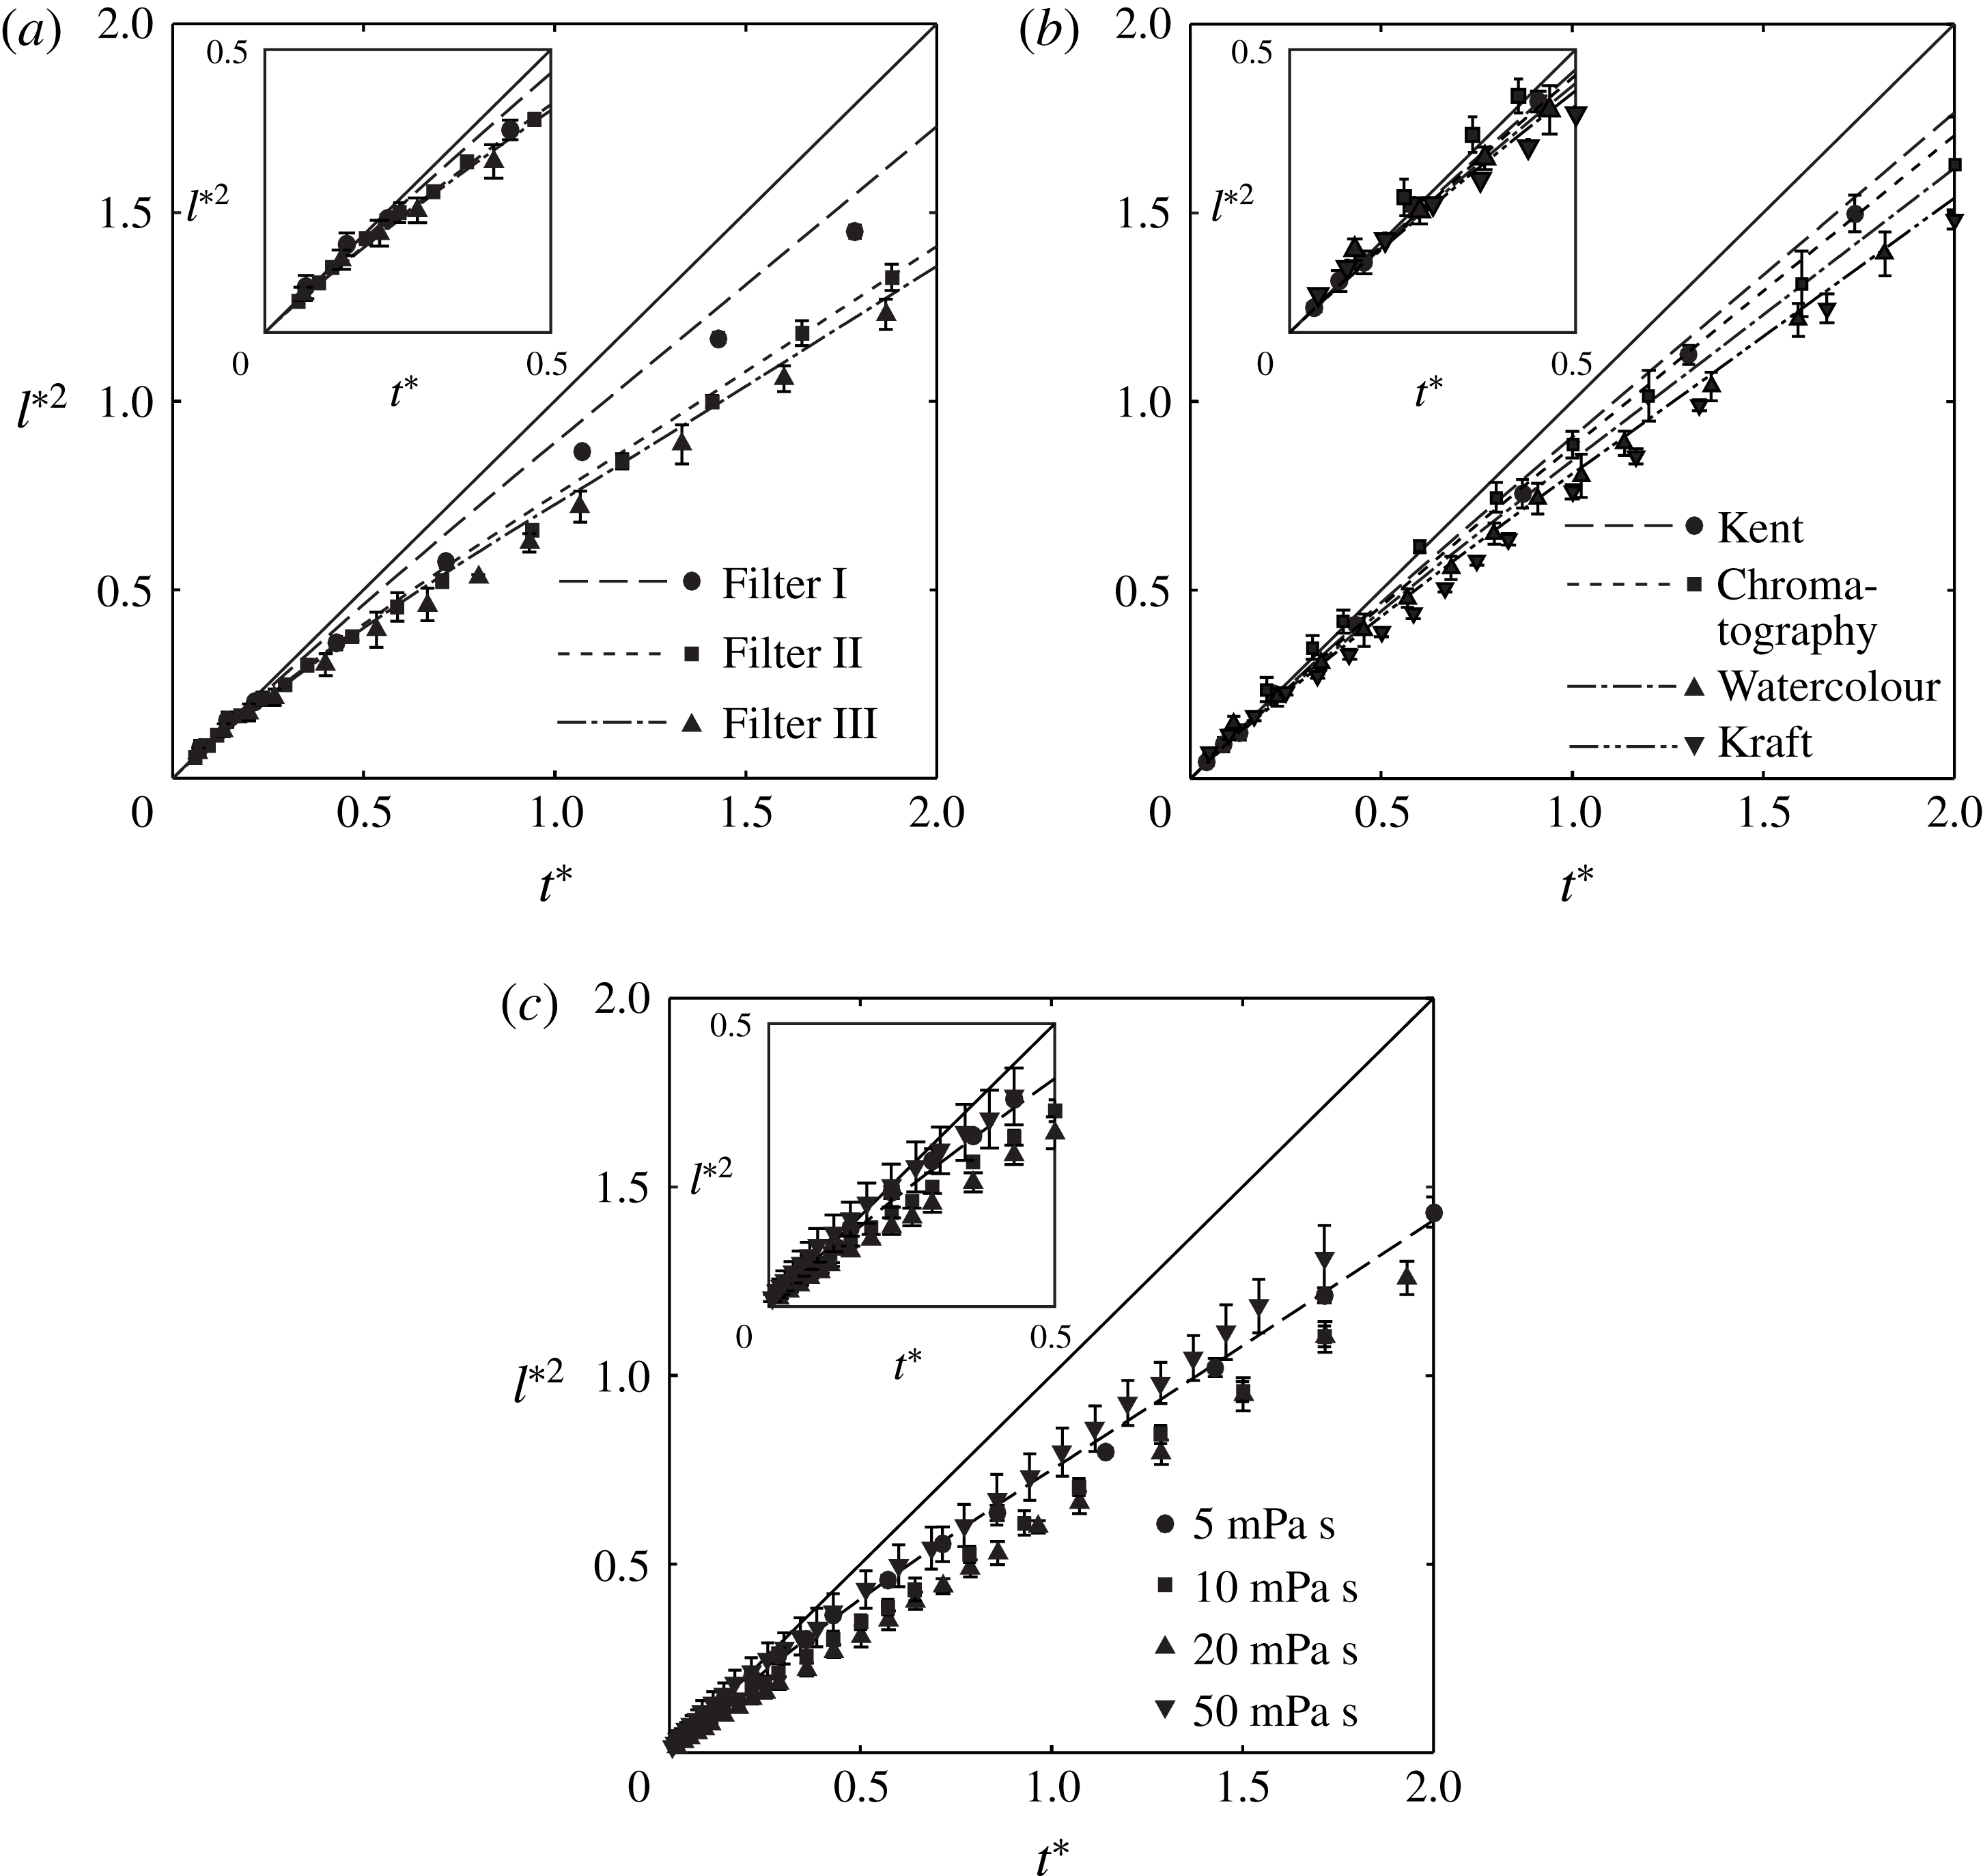
Theoretical predictions and experimental measurements of the imbibition length of 5 mPa s silicone oil in (a) filter papers and (b) chromatography, Kent, watercolour and kraft papers. (c) Experimental measurements of the imbibition length of silicone oils with different viscosities of 5, 10, 20 and 50 mPa s in Filter II.
5 Comparison of the model prediction and experimental measurements
We compare the theoretical model with the experimental results. Figure 8(a,b) presents the experimental measurements and model predictions using the data listed in table 1. The symbols denoting the experimental measurements are in good agreement with the model prediction in
 $0<t^{\ast }<2$
, which apparently deviates from the straight line for
 $l^{\ast 2}=t^{\ast }$
. Figure 8(c) shows the experimental results for Filter II using the silicone oils with various viscosities of 5, 10, 20 and 50 mPa s. We estimated
 $k$
and
 $t_{c}$
for 5 mPa s silicone oil in table 1, and so the values for
 $k$
and
 $t_{c}$
for other viscosities can be calculated from
 $k\propto \sqrt{\unicode[STIX]{x1D70E}/\unicode[STIX]{x1D707}}$
and
 $t_{c}\propto \unicode[STIX]{x1D707}/\unicode[STIX]{x1D70E}$
for a given paper. The volume ratio
 $\unicode[STIX]{x1D713}$
between the intra-fibre to inter-fibre pores is given as a single value for a given paper, and thus is independent of the oil viscosity. The experimental data collapse into a single dashed line predicted by the theoretical model, thus enhancing confidence in our model prediction.
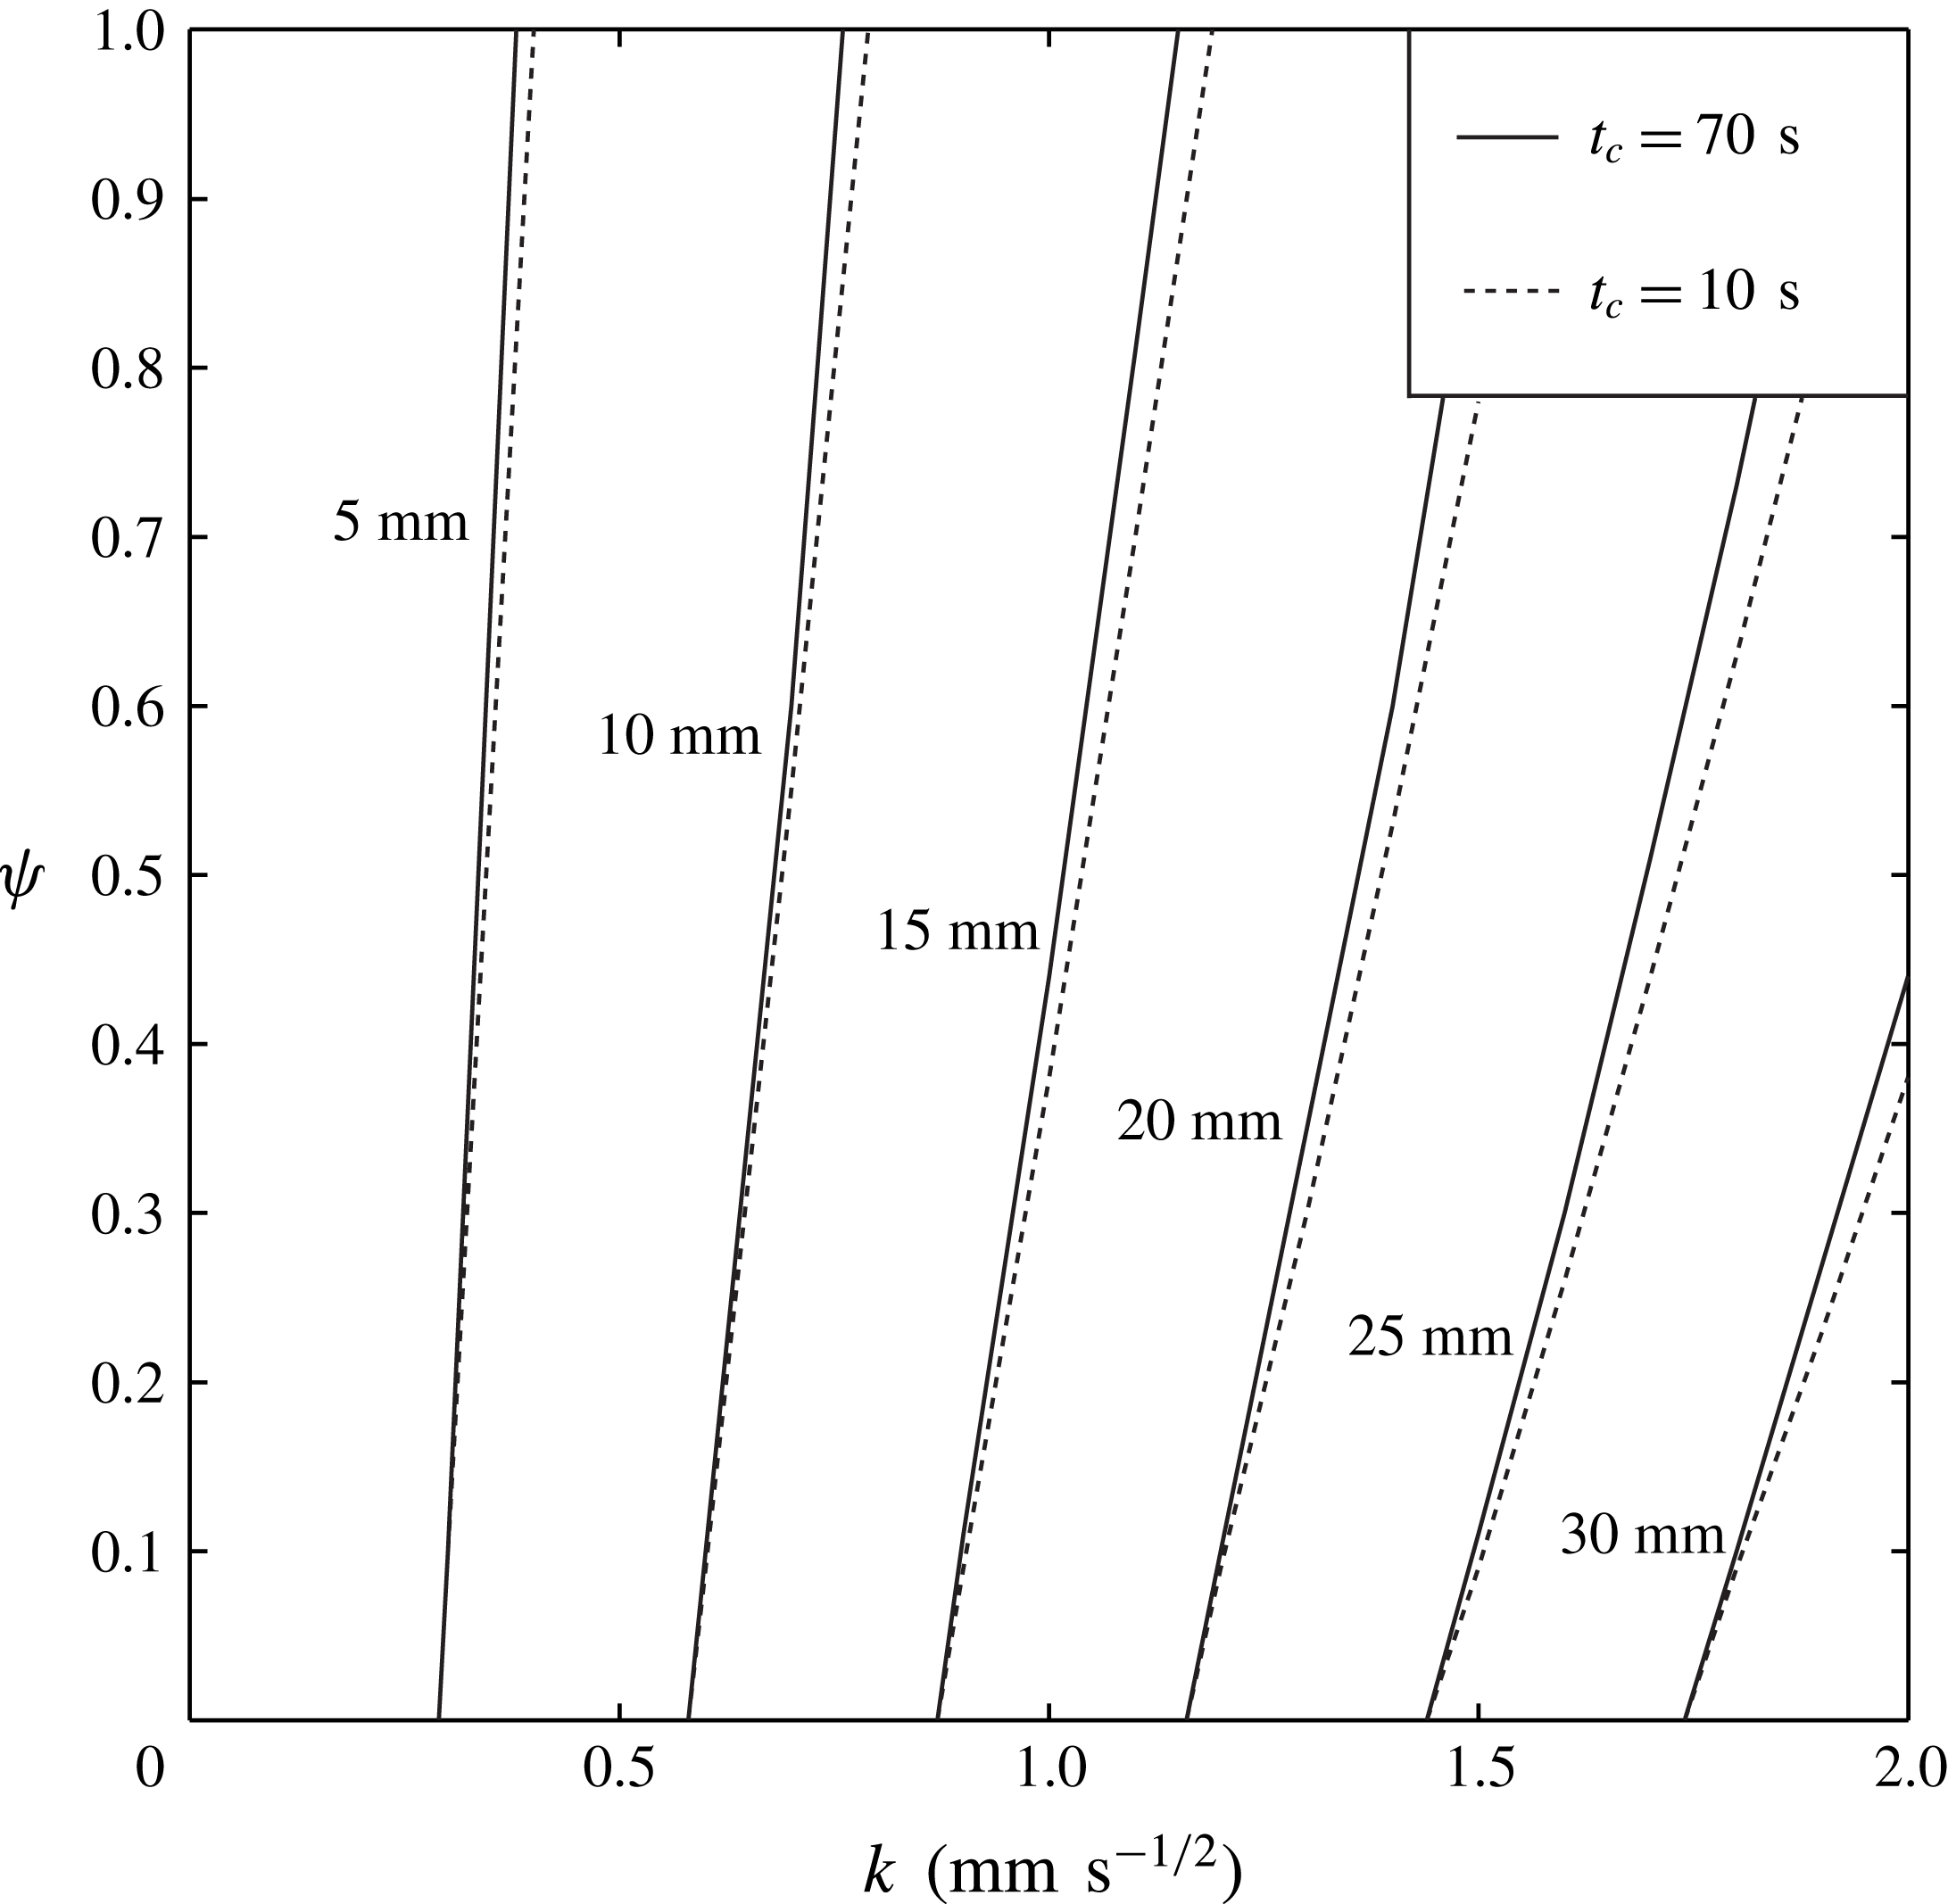
The dependence of the imbibition length for 300 s on
 $k$
and
 $\unicode[STIX]{x1D713}$
for silicone oil with a viscosity of 5 mPa s. Since
 $t_{c}$
typically ranges from 10 s to 70 s based on our experimental results (see table 1), we draw lines corresponding to a
 $t_{c}$
of 10 s and 70 s.
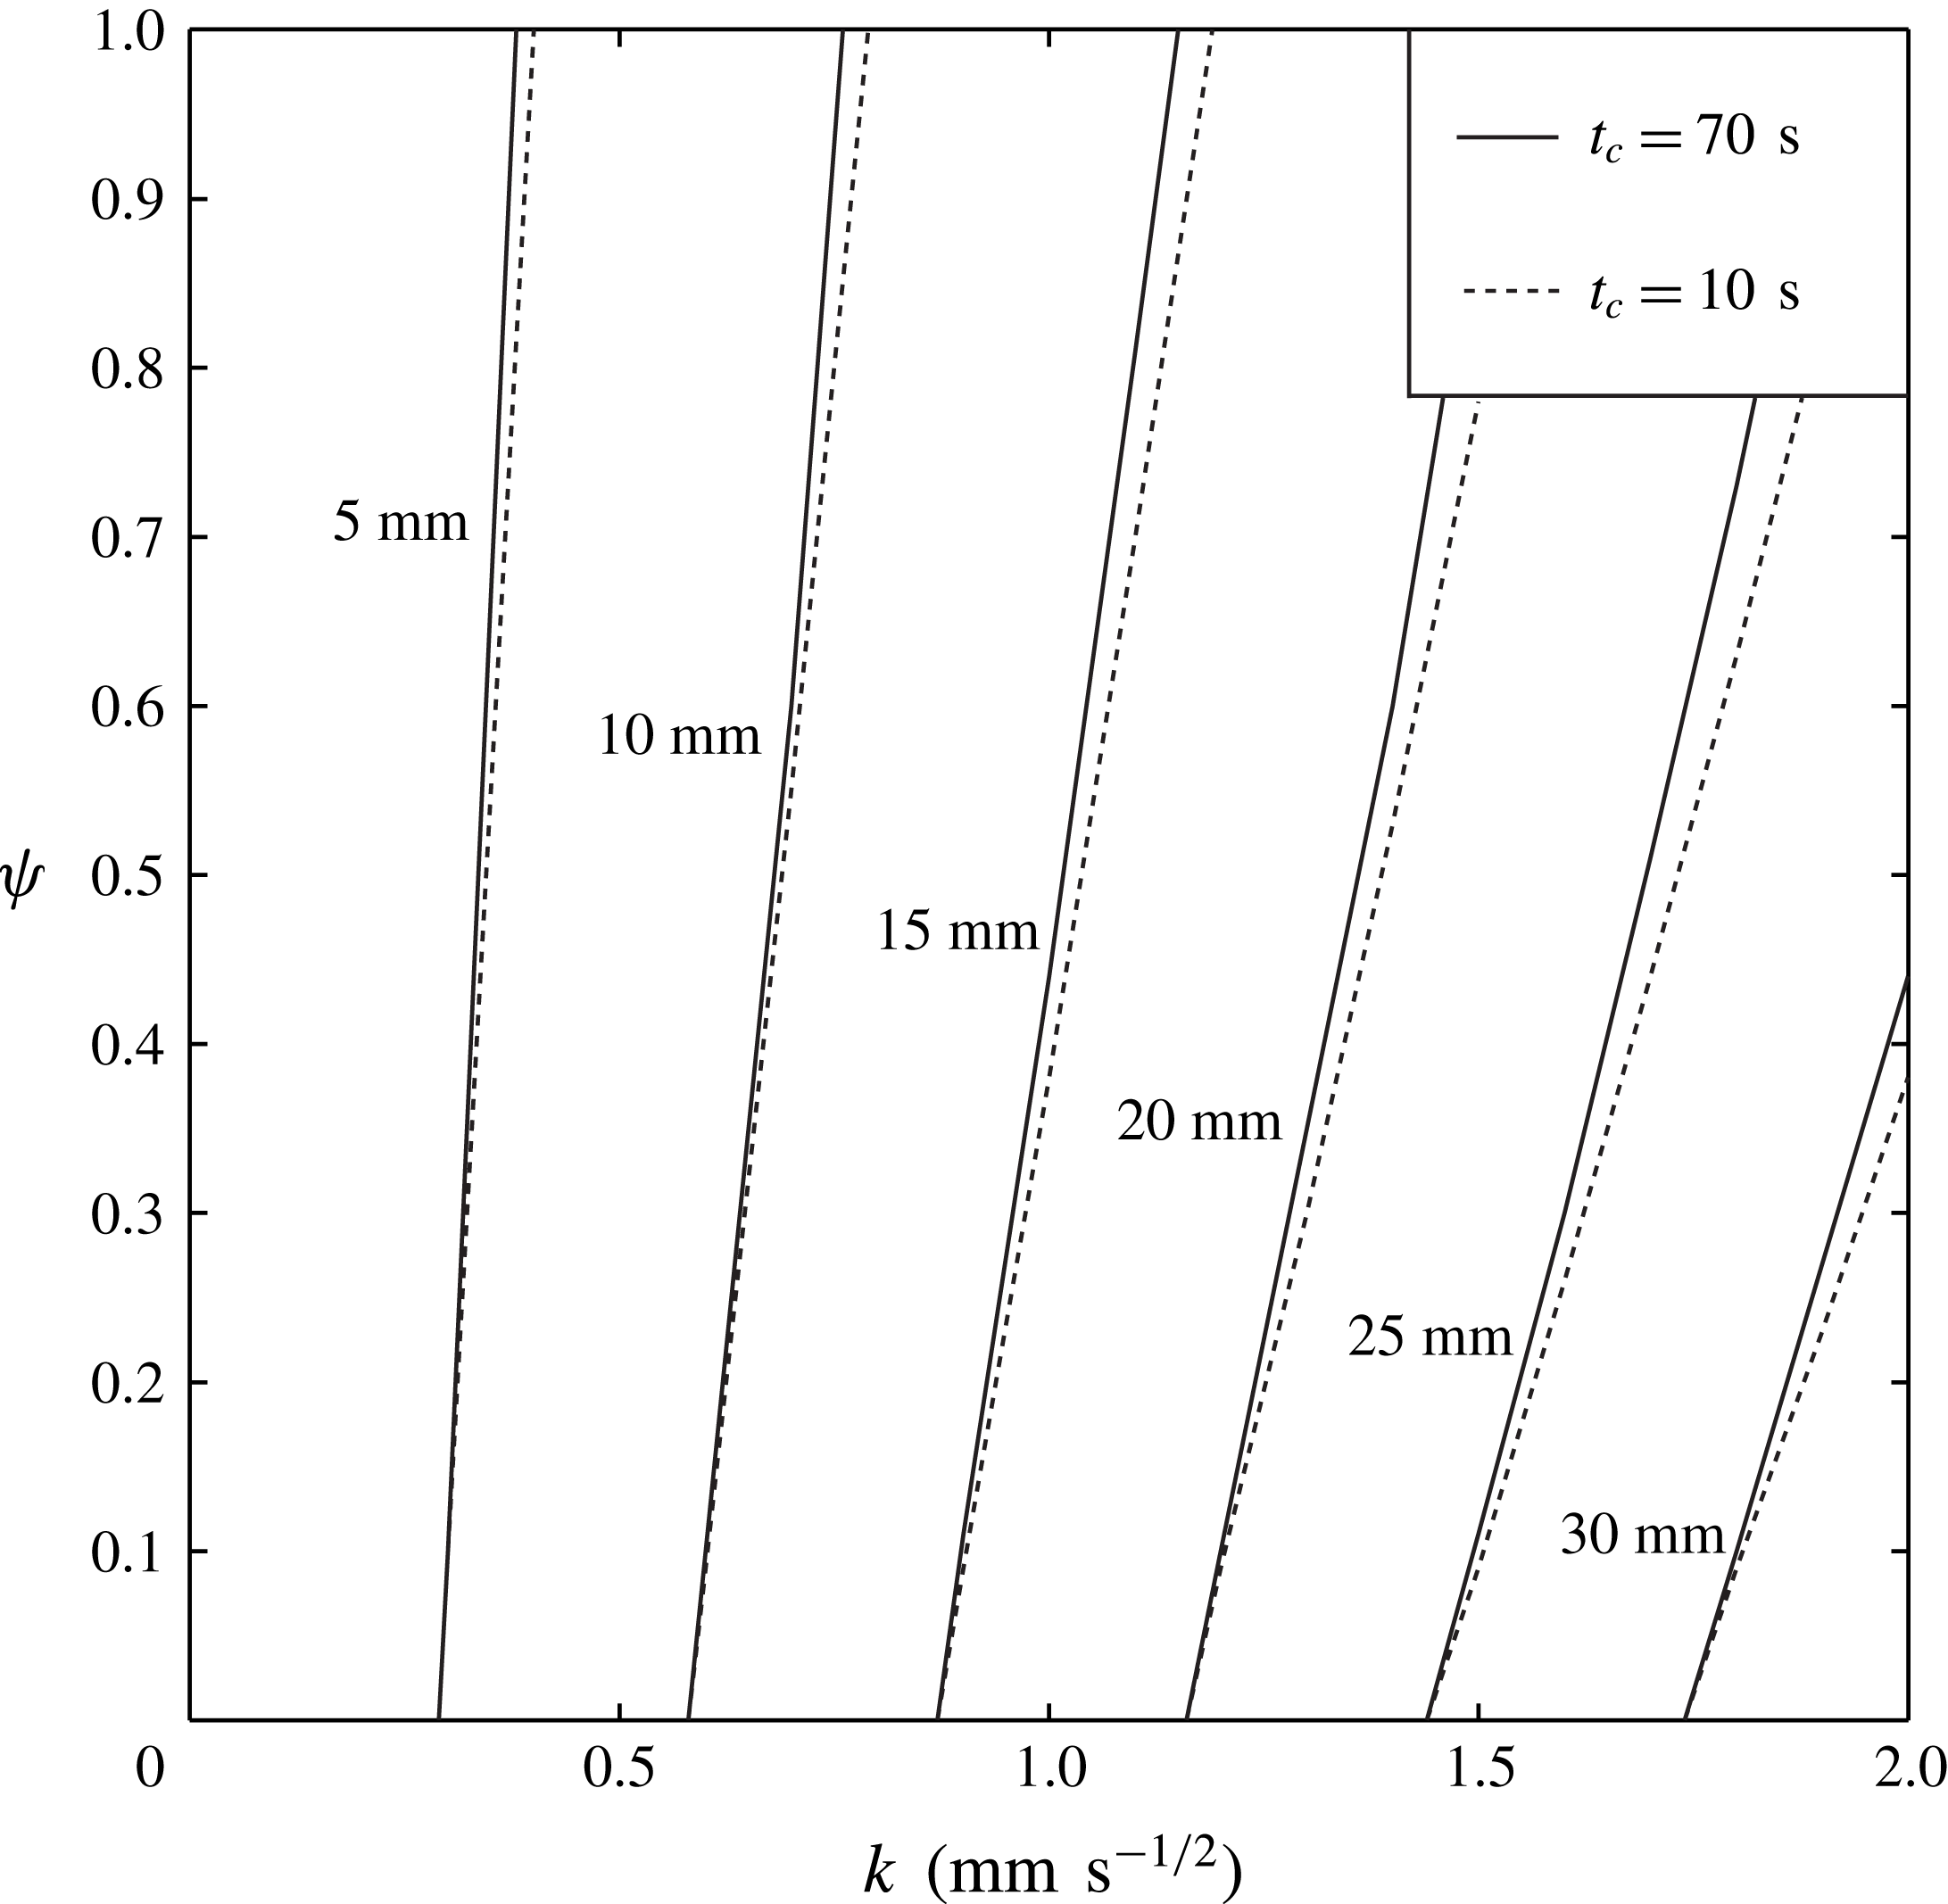
In figure 9, we plot the dependence of the imbibition length for 300 s on
 $k$
and
 $\unicode[STIX]{x1D713}$
for silicone oil with a viscosity of 5 mPa s. Since
 $t_{c}$
typically ranges from 10 s to 70 s based on our experimental results (see table 1), we draw lines corresponding to
 $t_{c}$
of 10 s and 70 s. These curves clearly illustrate how flow speed in the paper depends on
 $t_{c}$
and
 $\unicode[STIX]{x1D713}$
as well as
 $k$
. For instance, for paper with
 $k=1.5~\text{mm}~\text{s}^{-1/2}$
, the imbibition length for 300 s varies from less than 20 mm to more than 25 mm, depending on the size and volume of the intra-fibre pores, in spite of having the same inter-fibre structure. Therefore, our results demonstrate that an accurate prediction of the imbibition length through paper cannot be made with a single parameter
 $k$
, but requires additional parameters
 $t_{c}$
and
 $\unicode[STIX]{x1D713}$
to characterize the intra-fibre pores. The plot also reveals that paper with a large inter-fibre pore and a small intra-fibre pore volume fraction has a fast imbibition speed.
We lastly discuss the scaling of
 $l\sim t^{1/2}$
, which is generally used for capillary flow through paper. Our results indicate that this scaling may not be valid for paper with large
 $\unicode[STIX]{x1D713}$
in
 $t^{\ast }<1$
, in which case the use of the Washburn equation is limited. Over a long time scale
 $t^{\ast }\gg 1$
, the scaling of
 $l\sim t^{1/2}$
may be acceptable because our prediction seems to be a straight line in the domain of
 $l^{2}$
and
 $t$
. However, there is a caveat, because the proportional constant would be different from the constant
 $k$
predicted by data
 $t^{\ast }<1$
. In this case, the constant
 $k$
should be measured from the observation for
 $t^{\ast }>1$
.
6 Conclusions
We have elucidated the role of the intra-fibre pores in the dynamics of liquid imbibition through paper. Based on visualizations and experimental estimations of the intra-fibre pores, we have demonstrated how capillary flow through paper is affected by the intra-fibre pores. By introducing dimensionless parameters to characterize the structure of the internal pores of the fibres, we have successfully developed a theoretical model for the dynamics of liquid imbibition through paper fibres, showing good agreement with the experimental measurements. In particular, the dynamics significantly depends on the volumetric ratio of the intra-fibre to inter-fibre pores, which greatly varies between 0.17 and 0.6 for the papers that we tested. The intra-fibre pores cause a nonlinear dependence between
 $l^{2}$
and
 $t$
, thus abrogating
 $l\sim \sqrt{t}$
, which is widely used for capillary flows in porous media. This reveals the critical physical reason behind the limited accuracy of the Washburn equation for capillary flow in paper. The results provide a theoretical background to improve the performance of paper-based microfluidic systems.
Acknowledgements
This work was supported by the National Research Foundation of Korea (NRF) grant funded by the Korea government (MSIP) (grant nos 2015R1A2A2A04006181 and 2017R1E1A1A01073599).