





Poor diet is a risk factor for a large range of chronic diseases(1). However, in both observational studies and randomised control trials, dietary intake is usually measured or captured over a short period only that may not reflect habitual or long-term intake, and estimates of intake are prone to well-established errors such as recall bias, underreporting or favourability bias(Reference Dwyer and Coleman2,Reference Schwingshackl, Schünemann and Meerpohl3) . Food liking is the extent to which we inherently like different foods and may be distinct from what we actually eat. It is the consequence of a complex interaction between genotype(Reference May-Wilson, Matoba and Wade4), taste receptors(Reference Depoortere5), eating behaviours(Reference Ashcroft, Semmler and Carnell6), environmental exposure(Reference Pitt, Gallegos and Comans7) and personal and cultural experiences(Reference Monterrosa, Frongillo and Drewnowski8). Food liking is also influenced by satiety, its palatability, how food is perceived and how it affects sensory experience(Reference Johnson and Wardle9–Reference Forde and de Graaf11). In addition, the relationship between food liking and food intake depends on the ability to control one’s desire to eat certain foods(Reference Fedoroff, Polivy and Herman12). Food liking, however, is considered one of the central constructs when modelling food choices and diet quality(Reference Eertmans, Baeyens and Van den Bergh13,Reference Livingstone, Pnosamy and Riddell14) . Often expressed on a hedonic scale covering like/dislike, food liking was shown to correlate with habitual dietary intake(Reference Drewnowski and Hann15–Reference Carbonneau, Bradette-Laplante and Lamarche17).
Most studies of the relationship between food liking and health outcomes have focussed on liking for fat, sweet or salty foods and the association with obesity. Such studies are based on the hypothesis that highly palatable energy-rich food, especially dietary fat and sugar, can alter the brain rewards system, decrease taste sensitivity and lead to increased consumption, which in turn may result in obesity in the long term(Reference Brondel, Quilliot and Mouillot18). Cross-sectional studies found associations between liking fat and obesity(Reference Deglaire, Méjean and Castetbon19,Reference Lampuré, Deglaire and Schlich20) , however liking sweet was associated with obesity only in women(Reference Lampuré, Deglaire and Schlich20). Similarly, prospective studies suggest that adiposity is associated with liking fat, but liking sweet is associated with lower risk of obesity(Reference Lampuré, Castetbon and Deglaire21).
Except for adiposity, the relationship between food liking and health outcomes has remained largely under-explored. A prospective study of adults reported a positive association between liking fatty foods and hypertension, diabetes and CVD that was mostly explained by dietary intake and BMI; but no association with liking sweet foods only(Reference Lampuré, Adriouch and Castetbon22). A study by Duffy et al.(Reference Duffy, Lanier and Hutchins23) that investigated the associations between food liking and CVD risk factors found that while liking fat correlated closely with fat intake, only liking fat and no fat intake were associated with central obesity. In a separate study, neither liking sweet food nor intake of sweet food was associated with obesity or CVD risk factors(Reference Duffy, Lanier and Hutchins23). A more recent study of the UK Biobank cohort employed machine learning techniques to investigate the association between three food-liking phenotypes (health-conscious, omnivores and sweet-tooth) derived from principal component analysis and found associations with a large group of biomarkers, metabolites, risk factors and health outcomes(Reference Navratilova, Whetton and Geifman24). The study found that the ‘health-conscious’ group had lower risks of several CVD, mental health, bowel, kidney and liver conditions compared with both ‘omnivores’ and the ‘sweet-tooth’ groups, but no association with cancer was found(Reference Navratilova, Whetton and Geifman24). However, the ‘sweet-tooth’ phenotype derived in this study contained overlapping patterns of food liking for high-fat or high-sugar food items, as well as not liking fruit and liking processed food items, contrasting it to the ‘health-conscious’ group. This made the findings of the association between the health outcomes and liking for fat, liking for sweet or liking for unhealthy foods difficult to interpret.
In this context, using data from UK Biobank, our study is the first to investigate whether concomitant liking for high/low fat and sweet v. savoury profile foods was associated with a range of the most common health outcomes, after adjusting for known risk factors. In addition, we explore whether these associations were potentially explained by adiposity as estimated by baseline BMI.
Methods
Population and study design
UK Biobank is a prospective cohort study with over 500 000 participants aged 40 to 69 years at baseline, recruited from across England, Scotland and Wales between 2006 and 2010. During the recruitment phase, participants completed touchscreen questionnaires covering socio-demographic, lifestyle and psychosocial factors. Trained research staff recorded anthropometric measurements and verified medical histories and medication usage(Reference Sudlow, Gallacher and Allen25). The study received ethical approval from the North-West Multi-centre Research Ethics Committee (21/NW/0157), and data access was granted by the UK Biobank’s Access Sub-committee. All participants provided written informed consent, allowing for data linkage to health records. This study was conducted under application number 71392.
Exposure
Food liking was obtained through an online survey that featured 142 food items covering individual foods, beverages or groups of food, or food-related behaviours such as adding salt to food(Reference May-Wilson, Matoba and Wade4). Administered in 2019, all UK Biobank participants who had given consent to be contacted for further studies were invited to participate. The responses were collected using a nine-point hedonic Likert scale labelled ‘1 extremely dislike’, ‘2’, ‘3’, ‘4’, ‘5’, ‘6’, ‘7’, ‘8’ to ‘9 extremely like’. The instructions given were ‘The more you like the item the higher you should rate it. The less you like the item, the lower you should rate it. If you are unfamiliar with any of the foods …please select ‘Never tried’. Comprehensive details about the questionnaire are available at (https://biobank.ndph.ox.ac.uk/showcase/showcase/docs/foodpref.pdf).
In this study, we selected liking for foods across two dimensions: low v. high fat; and sweet v. savoury. Food-liking items were placed in one of four groups according to their total fat content and sweet or savoury taste: high-fat savoury (HFSa), high-fat sweet (HFSw), low-fat savoury (LFSa) and low-fat sweet (LFSw). HFSa and HFSw food items were selected to create the best match to the previous research, which identified the most representative items with likely ≥20 % fat content (rather than an exhaustive list of all items) for HFSa (such as bacon or salami) and HFSw (such as cakes or doughnuts)(Reference Finlayson, King and Blundell26), while LFSa and LFSw items diverged and reflected liking for vegetables and sweet fruits, respectively. While the derivation and subsequent use of the Leeds Food Preference Questionnaire(Reference Finlayson, King and Blundell26) fitted the hedonic and nutrient framework we wanted to follow, our intention was not to directly reproduce the Leeds Food Preference Questionnaire, but use it to inform and guide the initial selection of core items available within UK Biobank and then expand it to include similar foods where previously used items could not be matched. While Finlayson et al showed that it is not necessary to include all items available, rather that categories can comprise of representative items, previous studies using the Leeds Food Preference Questionnaire framework, including those by Finlayson and colleagues themselves(Reference Finlayson, King and Blundell27,Reference Charlot, Malgoyre and Bourrilhon28) , have also modified the core food items included within the categories according to study context, cultural relevance and available foods. The final included foods and groups were based on the predominant sensory and nutritional characteristics of foods rather than predefined quantitative nutrient thresholds and are shown in Supplementary Table 1a. Participants’ scores for liking in each of the four groups were calculated as their average liking score across all foods in that group (e.g. for HFSa, liking for all seventeen items were included and then averaged), and the average liking score was rounded to the nearest integer from 1 to 9 to reflect the original Likert scale used. For the analysis, the Likert scale was collapsed and participants in each group categorised as dislike (original Likert scale 1–5) or like (original Likert scale 6–9). As the scale was presented to participants in numbers, rather than predetermined categories of liking or disliking, including ‘5’ in the ‘dislike’ category was for two main reasons: first, it was selected based on our interest in food liking, and while the category 5 was presented to participants only as number, it was described in the available UK Biobank dataset as ‘neither like or dislike’. Therefore, it was considered a response reflecting ambivalence or indifference(Reference Olsen29,Reference Lim30) ; not expressing liking, the exposure of our interest. Second, grouping scores 1–5 together also improved stability of the comparison groups due to relatively smaller numbers at the lower end of the scale. Additionally, those who answered ‘Have never tried it’ and ‘Prefer not to answer’ to any of the included items were excluded from the analyses together with the participants missing information on food liking.
In addition to the four groups, in a separate analysis, the two high-fat-liking groups (HFSa and HFSw) were combined into one high-fat liking group since liking for high-fat high-sweet foods was shown to be genetically correlated and classed as ‘highly palatable food items’(Reference May-Wilson, Matoba and Wade4). For that, we created one categorical variable with four categories. We split the participants according to whether the participants disliked both high-fat foods (referent category), liked HFSa only, liked HFSw only or liked both the HFSa and HFSw foods. The Likert scale in the new categorical variable was collapsed and the categories coded as: 0 if the mean score for both groups was dislike (i.e. between 1 and 5 for both HFSa and HFSw); 1 if the participant only liked HFSa (between 6 and 9 for HFSa); 2 if the participant only liked HFSw (between 6–9 for HFSw); and 3 if the participant liked both HFSa and HFSw preferences (between 6 and 9 for both HFSa and HFSw).
To check how liking for food correlated with recorded food intake, dietary intake was compared to the food-liking group categories. Dietary intake was obtained by UK Biobank using a web-based, self-administered 24-h recall, conducted five times from 2009 to 2012(Reference Galante, Adamska and Young31). Dietary intake items included in each group are listed in Supplementary Table 1b. Food items were matched as closely as possible between food intake and food-liking groups and their intake in servings/day was calculated. Total daily energy (kJ/day), as well as total daily intake of sugar and fat measured as absolute intake (in grammes/day) or converted to % of total energy intake from fat, sugar and fibre, was derived from all food consumed.
Health outcomes
Included outcomes were all-cause mortality and the most common conditions that are related to diet. These included incident cases of all-cause cancer, four main cancer types (colorectal, lung, breast and prostate), T2D and CVD. Dates and causes of death were obtained from death certificates collated by the National Health Service Information Centre for England and Wales and the National Health Service Central Register Scotland for Scotland. Dates and causes of hospital admissions were identified through record linkage to Health Episode Statistics for England and Wales and the Scottish Morbidity Record 01 for Scotland. Additional information about the linkage procedure can be found at https://digital.nhs.uk/data. Incident T2D was additionally derived from linkage to primary care data available in England only (n 228 449; 45 % of the UK Biobank cohort). Detailed linkage procedures are available at https://biobank.ndph.ox.ac.uk/showcase/showcase/docs/primary_care_data.pdf. We ascertained relevant outcome events from hospital admission and death records using International Classification of Diseases, 10th Revision (ICD-10) codes. CVD encompassed ischemic heart disease I20–25), stroke (ICD-10: I60–64), heart failure (ICD-10: I11·0, I42·0, I42·6, I42·7, I42·9, I50) and peripheral vascular diseases (I70–73). All-cause cancer was defined as C00-C97 excluding non-melanoma skin cancer (C44). Four cancers were also studied separately, these included lung cancer (C34), colorectal cancer (C18-C20), breast cancer (C50) and prostate cancer (C61). T2D was defined as an ICD-10 code of E11 in hospital admission and death records or, from primary care records, using the mapped Read codes contained in the UK Biobank lookup table.
Hospital admission data were accessible until 31 July 2019 in England and Wales and 31 October 2015 in Scotland. Mortality data were available until the end of February 2021. The latest date for which primary care data were available was September 2017. Consequently, follow-up information was censored on the earliest of these dates relevant to the outcome.
Covariates
All covariates included in this study were recorded at baseline. Age was calculated from dates of birth and baseline assessment, and sex was self-reported. The calendar month that participants attended a UK Biobank assessment centre was recorded at baseline, while Townsend deprivation index was based on postcode of residence at baseline applied to the preceding national census output areas. Ethnicity was self-reported and categorised as white, black, South Asian, Chinese, mixed and other. Self-reported smoking status was categorised as never, former or current smoker. BMI was calculated as weight (kg) divided by height (m) squared. Types of physical activity undertaken were self-reported as ‘walking for pleasure’, ‘other exercises (e.g.: swimming, cycling, keep fit, bowling’, ‘strenuous sports’, ‘light DIY’, ‘heavy DIY’ ‘none of the above’ and ‘prefer not to answer).’ Total time spent doing sedentary behaviour (hours spent watching TV, using computer or driving) was categorised into tertiles. Frequency of alcohol consumption at baseline was self-reported as ‘daily’, ‘3–4 times/week’, ‘1 or 2 times/week’, ‘1–3 times/month’, ‘special occasions’ or ‘never’.
Statistical analyses
Physician-diagnosed conditions were self-reported during a nurse-led interview at baseline. We excluded participants with missing data on exposures and follow-up and those with the outcome of interest at baseline: diagnosis of any cancer, CVD (prevalent angina or history of stroke or MI) and T2D (Supplementary Figure 1). Continuous variables were expressed as medians and interquartile range, and categorical variables were presented as frequencies and percentages (Table 1). χ 2 tests for categorical variables were used to compare differences between each food-liking group (like v. dislike). Pearson r correlation coefficients were used to evaluate the correlations between dietary intake and food liking (nine-point scale). Cox proportional hazard models were used to investigate the associations between like and dislike in each food-liking group (ordinal dependent variable with ‘extremely dislike’ being the referent category) and each health outcome (binary independent variable), with follow-up as the timeline variable. Results are reported as hazard ratios (HR) together with 95 % CI per one point increment in the hedonic scale referent to ‘extremely dislike’. We also investigated the association between co-existing preferences for HFSa and HFSw using a single categorical variable, where ‘dislike both high-fat food groups’ was the referent category.
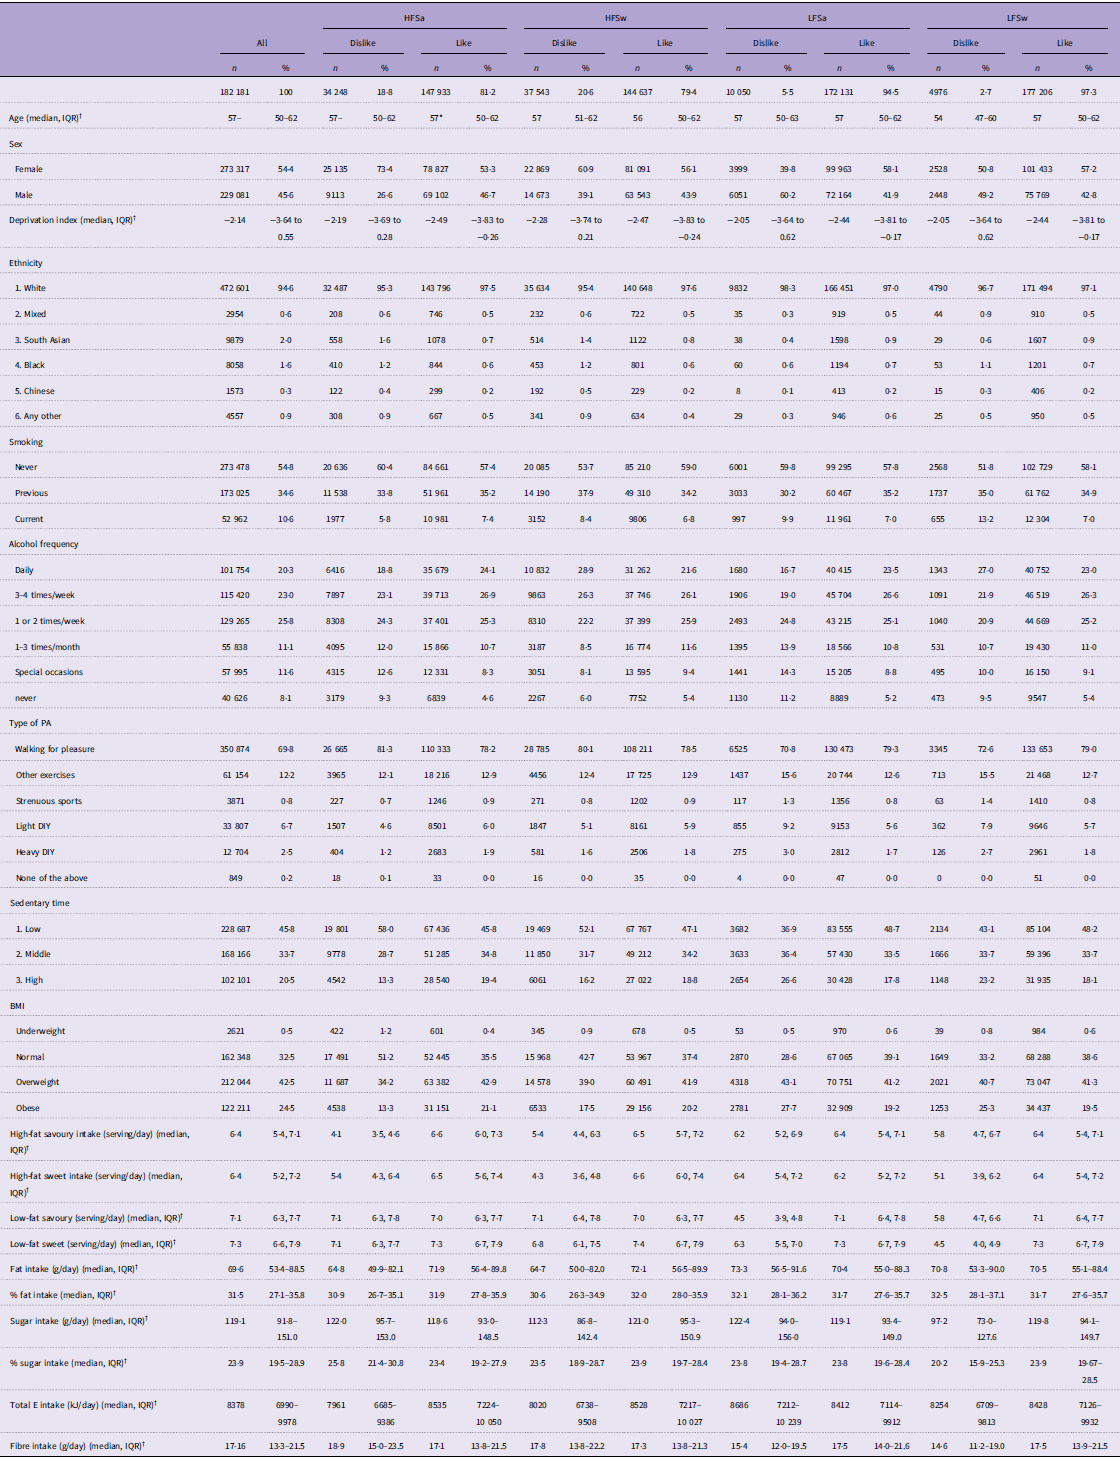
Baseline characteristics of the study participants‡

Table 1. Long description
The table presents baseline characteristics of study participants, comparing those who like and dislike various food categories. It includes data on age, sex, deprivation, ethnicity, smoking status, physical activity, dietary intake, and health conditions. The table has 12 columns and 50 rows, with column headers such as All, HFSa, HFSw, LFSa, and LFSw, each further divided into Like and Dislike categories. Each row provides specific characteristics like age, sex distribution, ethnic background, smoking habits, and dietary preferences. Notable trends include variations in age, sex distribution, and health conditions across different food-liking groups.
IQR, interquartile range; PA, physical activity.
* Not statistically significant.
† Median, IQR.
‡ BMI was categorised as underweight (less than 18.5 kg/m2), normal (18.5 to 24.9 kg/m2), overweight (25 to 29.9 kg/m2) and obese (30 or greater kg/m2).
For each of the food-liking groups, the associations were adjusted for covariates using three stepwise adjusted models with an increasing number of covariates. Model 1 was adjusted for sex, age, deprivation, ethnicity and month of recruitment, and model 2 was additionally adjusted for lifestyle factors including alcohol consumption frequency, smoking status, types of physical activity and total sedentary time. Model 3 was additionally adjusted for BMI (continuous), to explore whether any association was attenuated by BMI. The analyses were conducted using a 2-year landmark approach to reduce the risk of reverse causation affecting the covariates reported at baseline and undiagnosed prevalent disease.
Additionally, we ran two sensitivity analyses. First, in order to explore whether liking for other food groups impacted the associations with the food group of interest, we ran model 2 additionally adjusted for the three other food-liking groups. Second, to test the impact of being on CVD medication (antihypertensive or lipid lowering), we additionally adjusted model 2 for CVD medication.
Results
After excluding participants with missing data or prevalent disease at baseline, those who developed the conditions or died within 2 years of follow-up baseline, and those who withdrew, 182 181 participants (36 % of UK Biobank sample) were included in the final study sample (Supplementary Figure 1). The median follow-up was 9·2 years (interquartile range 9·6 to 9·9). The study population characteristics broken down by food liking (dislike (≤5) and like (>5)) are shown in Table 1.
Overall, ‘like’ was the most common response for all four food groups (Table 1). There were significant differences by sex and other characteristics. Women were much more likely to dislike both types of high-fat foods than men (of those who disliked HFSa: 73·4 % were women, 26·6 % were men; of those who disliked HFSw: 60·9 % were women, 39·1 % were men), while the opposite was observed for low-fat food groups. Those who disliked any of the four food-liking categories were less likely to live in a deprived area. Current smokers or frequent alcohol drinkers were more likely to like HFSa foods and dislike the other three food groups. Those who liked low-fat food were less sedentary and more likely to engage in walking for pleasure. No significant differences were observed by age. BMI category varied by food liking. The most significant differences in BMI were detected for HFSa group, where 51·2 % who disliked these foods had a normal BMI compared with only 35·5 % of those who liked these foods. Also, more of those who liked HFSa foods tended to live with overweight or obesity. On the other hand, 39·1 % of those who liked LFSa foods had normal BMI compared with 28·6 % of those who disliked LFSa foods.
Table 1 also shows the estimated intake of foods and nutrients for each food-liking group; the correlation coefficients (p-corr) between the four food-liking groups (analysed on 9-point scales) and deciles of relevant estimated daily intake of total fat, sugar and fibre as well as the specific food items included in the food-liking categories are shown as a heatmap in Supplementary Figure 2. The figure shows that the estimated intake of items included in the four food-liking categories was higher for the relevant foods (e.g. those who liked HFSa foods had a higher intake of HFSa foods). It also showed that total daily fat intake was higher for those who said they liked either HFSa or HFSw foods, daily sugar intake was also higher for those who liked HFSw or LFSw foods, but those liking LFSw foods had higher correlation with daily sugar intake than those who liked HFSw foods. While higher total energy was correlated with higher liking of HFSa and HFSw foods, higher fibre intake was correlated with liking of LFSa and LFSw.
Association between food-liking groups and health outcomes
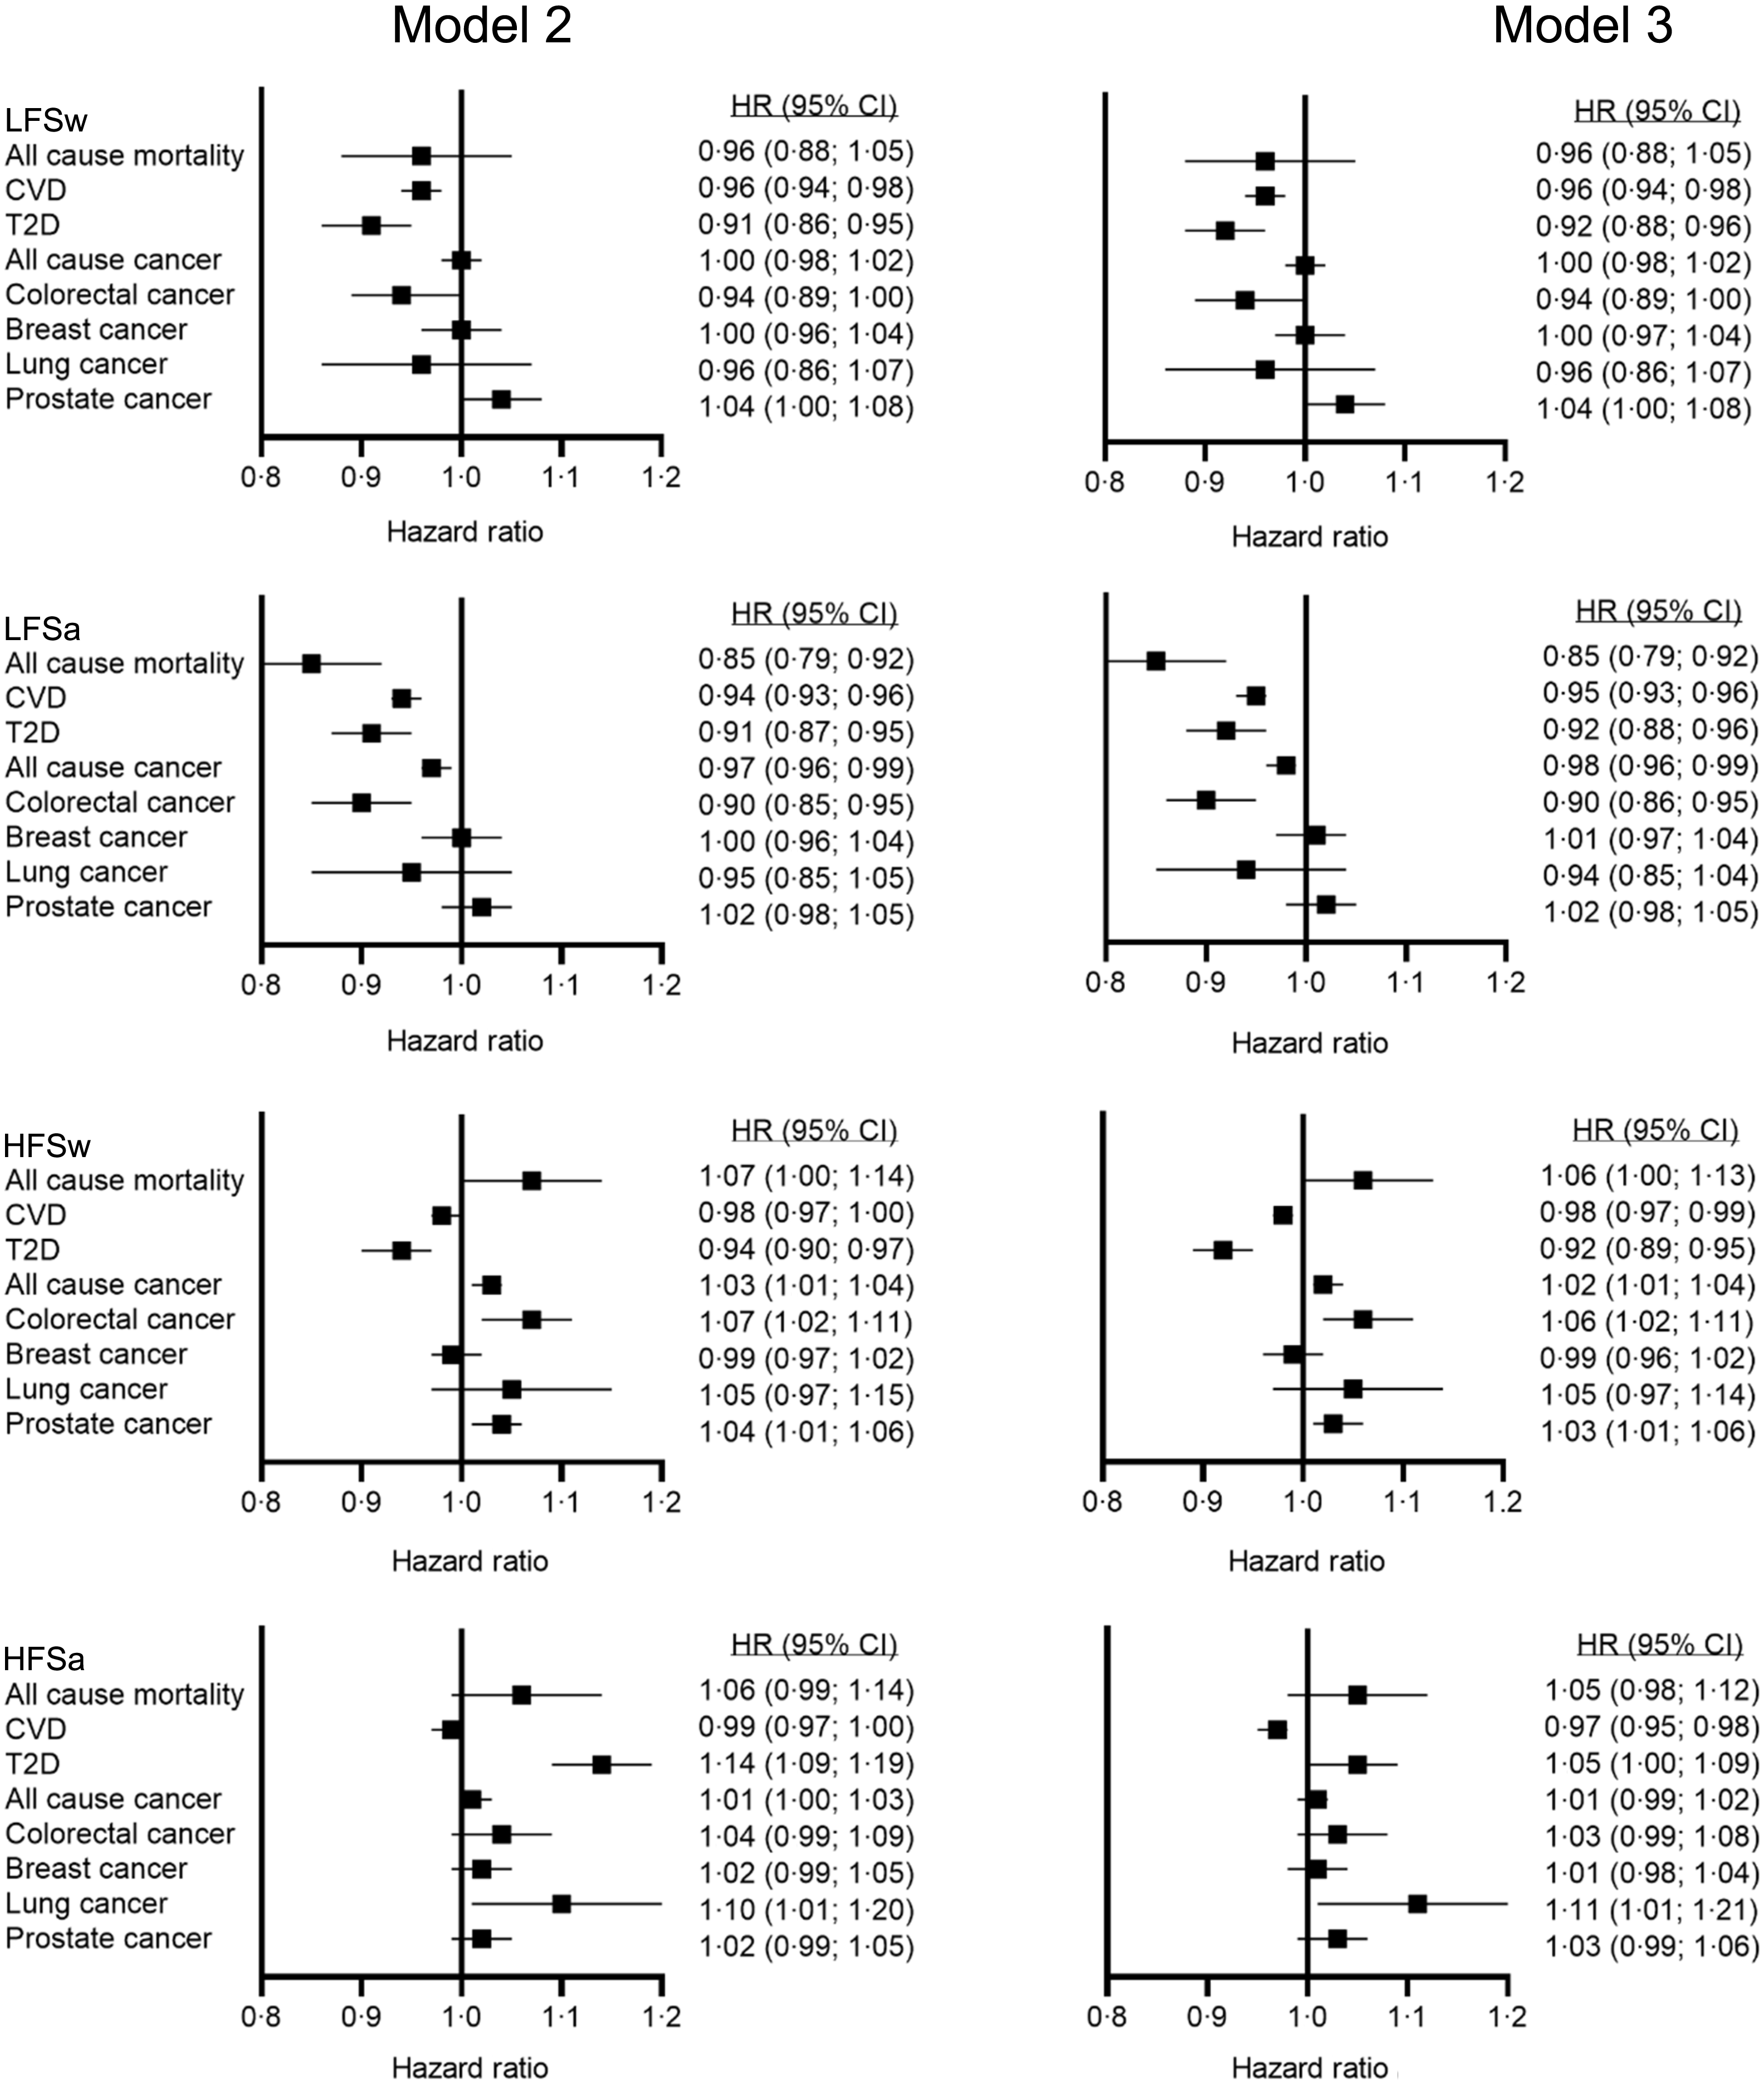
Figure 1 shows the associations between food liking (HR are expressed per 1-point increase referent to extremely dislike) and incident health outcomes for model 2 (adjusted for all included confounders) and model 3 (also adjusted for BMI as a potential mediator). All models are shown in Supplementary Table 2.
Association between four food-liking groups with health outcomes. Data are presented in hazard ratios with 95 % CI per one-point increase in the hedonic scale. The referent category is ‘extremely dislike’ of each food group. Model 2 was adjusted for age, sex, deprivation, month of recruitment, ethnicity, alcohol, smoking, physical activity and sedentary time. Model 3 was adjusted for variables in model 2 plus BMI.

Liking HFSa foods was associated with increased risk of T2D (model 2 HR: 1·14 95 % CI 1·09–1·19) and lung cancer (model 2: HR 1·10 95 % CI 1·01–1·20). The former was largely attenuated when adjusted for BMI (model 3: HR: 1·05 95 % CI 1·00–1·09). Liking HFSa was not associated with CVD risk nor with all-cause cancer and colorectal cancer independently of potential confounders (Figure 1, Supplementary Table 2).
Liking HFSw foods was associated with higher risk of all-cause cancer (model 2: HR 1·03; 95 % CI 1·01–1·04), prostate cancer (model 2: HR 1·04; 95 % CI 1·01–1·06) and colorectal cancer (model 2: HR 1·07; 95 % CI 1·02–1·11) independently of confounders. These associations were not attenuated after adjusting for BMI (model 3). Liking HFSw was also associated with all-cause mortality after adjustment for confounders (model 1, model 2). However, the association became non-significant after further adjusting for BMI (model 3: HR 1·06; 95 % CI 1·00–1·13, p = 0·061). Finally, those who liked HFSw foods had a significantly lower risk of both T2D (model 2: HR 0·94; 95 % CI 0·90–0·97) and CVD (model 2: HR 0·98; 95 % CI 0·97–1·00). These associations did not change after adjusting for BMI (model 3).
For those liking LFSa food, the patterns of association with health outcomes were opposite to those observed in those liking HFSa. Apart from lung, prostate and breast cancerm which were non-significant, liking LFSa foods was associated with lower risk of all outcomes before and after adjustment for confounders (Figure 1, Supplementary Table 2). These associations also did not change after adjusting for BMI (model 3).
Finally, liking LFSw food was associated with lower risk of T2D (model 2: HR 0·91; 95 % CI 0·86–0·95), CVD (model 2: HR 0·96; 95 % CI 0·94–0·98) and colorectal cancer (model 2: HR 0·94; 95 % CI 0·89–1·00). Again, these associations were not attenuated following adjustment for baseline BMI (model 3).
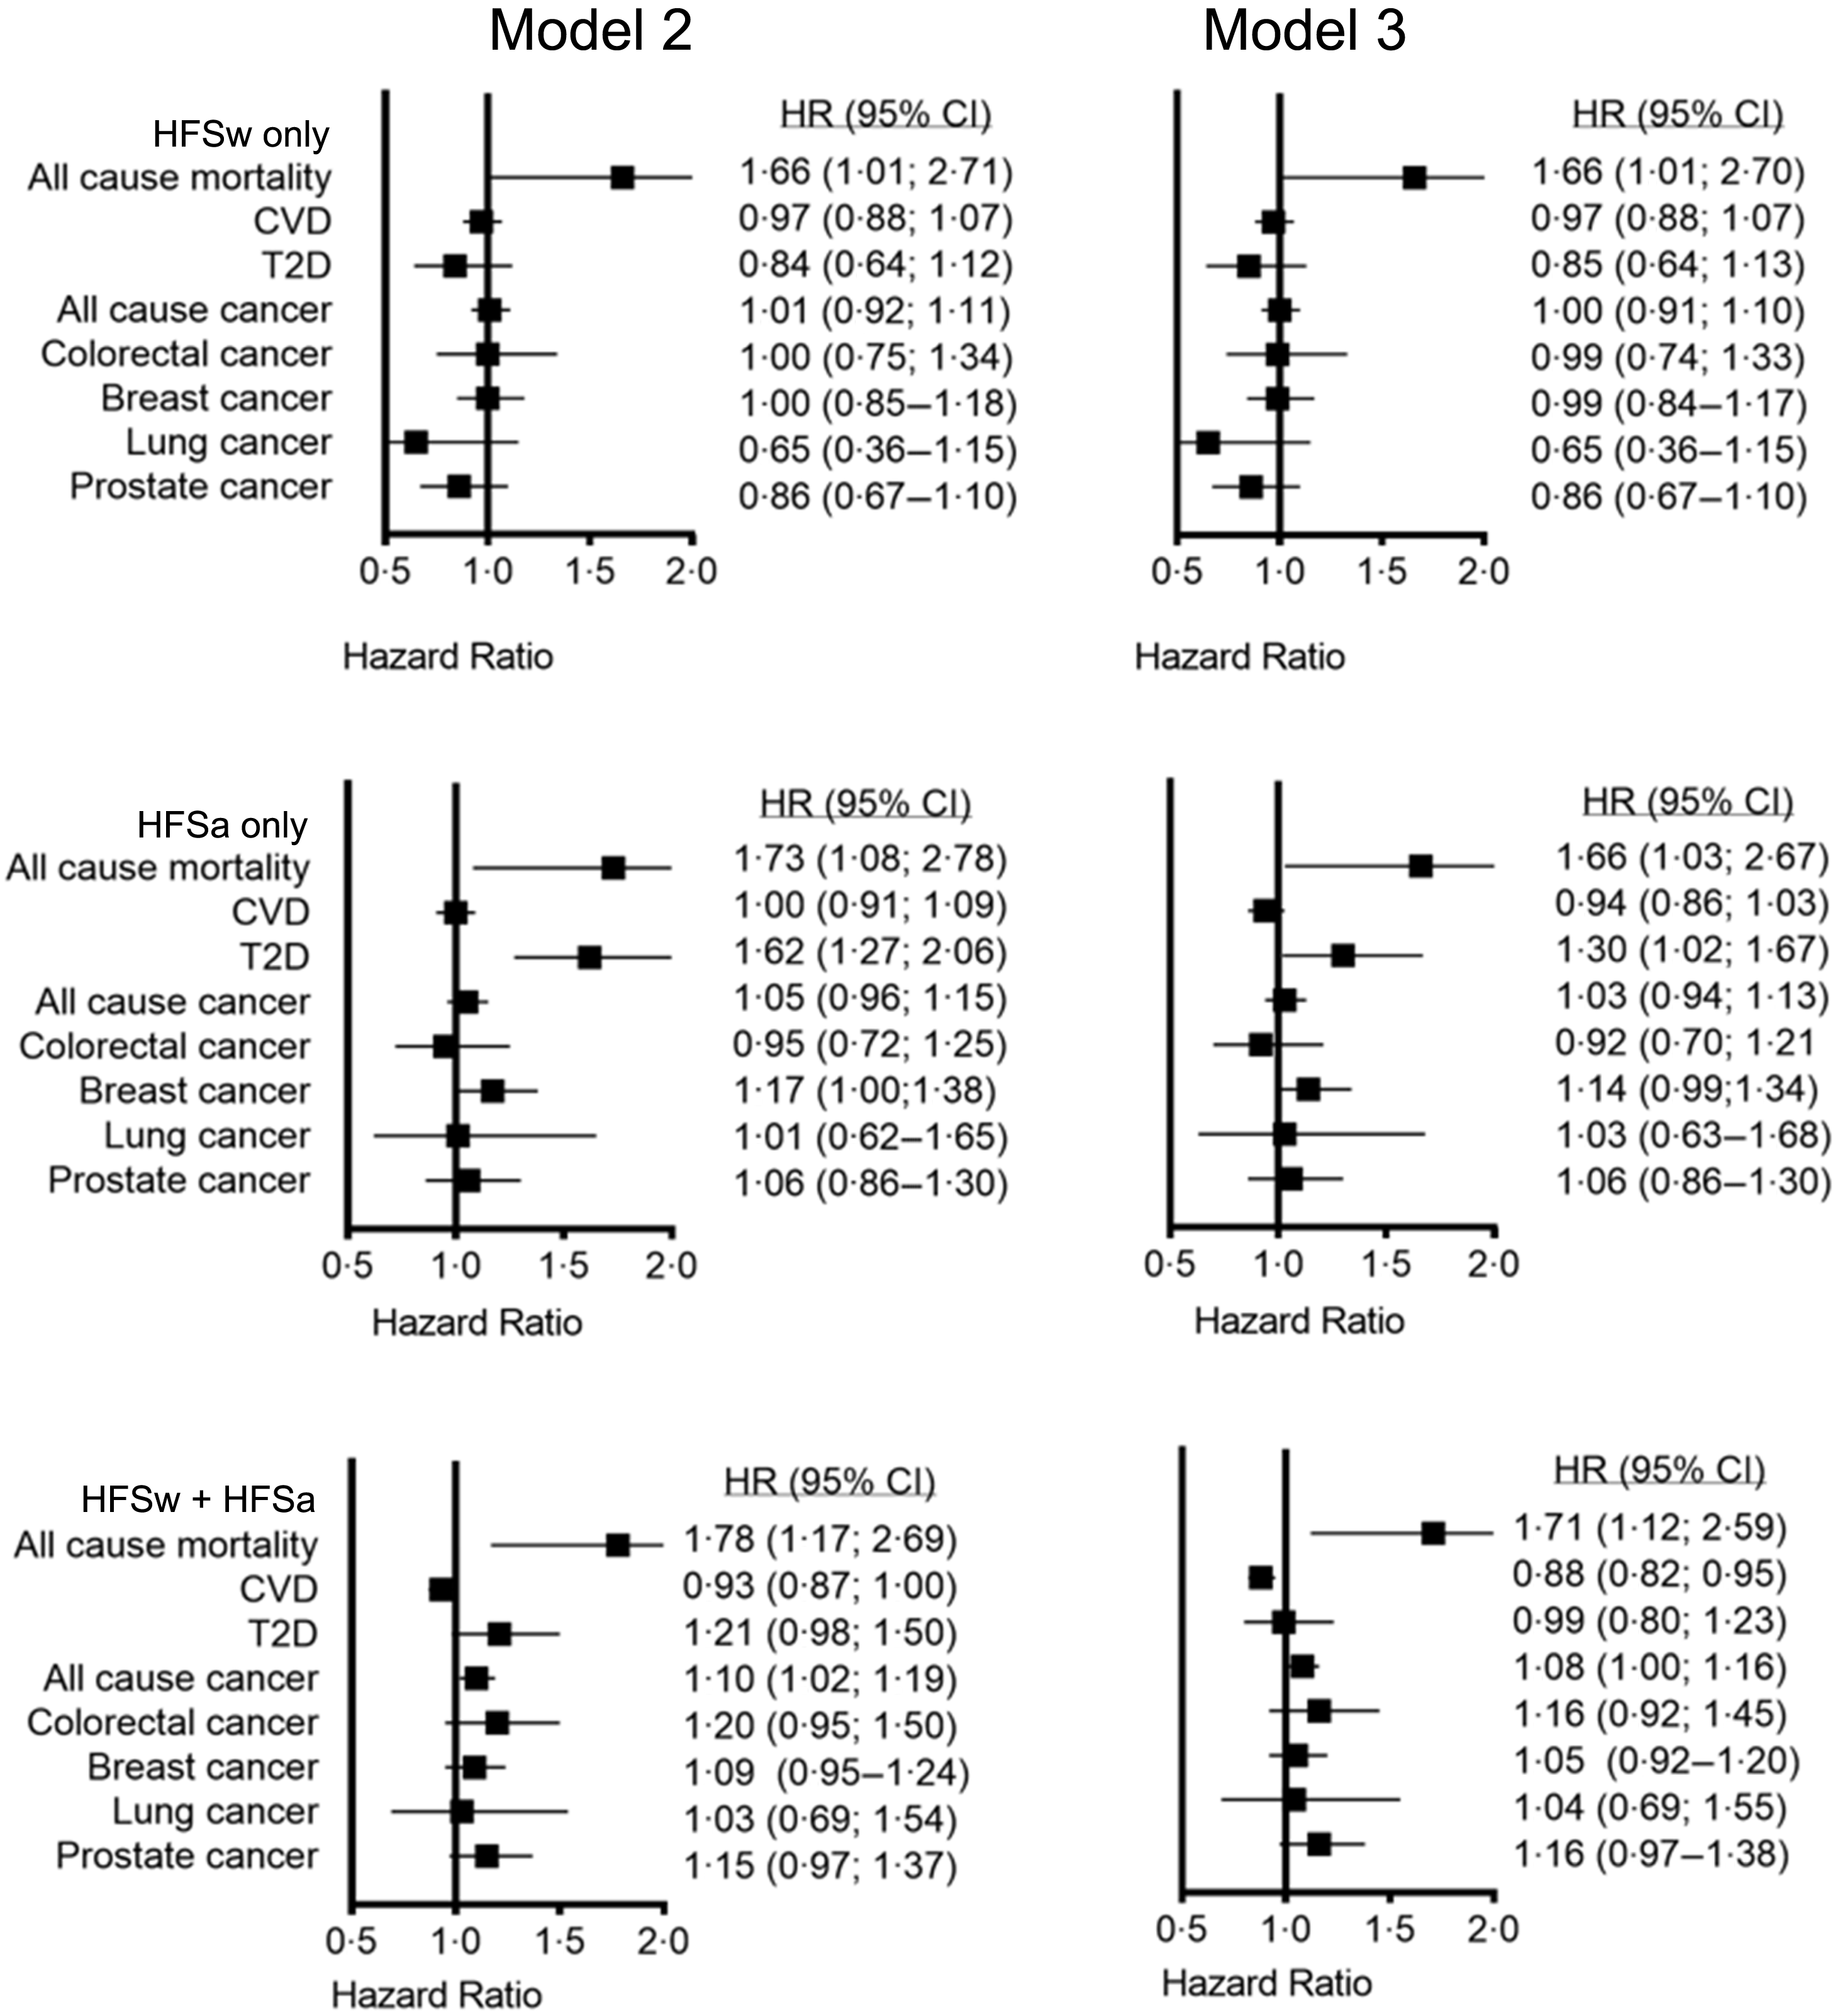
To assess the associations between combined liking for highly palatable foods and health outcomes as described in the Methods, Figure 2 shows the associations for both model 2 and model 3 (additionally adjusted for BMI), while Supplementary Table 3 shows all included models. Liking only HFSa was associated with a significantly higher risk of T2D (model 2: HR 1·62; 95 % CI 1·27–2·06) and all-cause mortality (model 2: HR 1·73; 95 % CI 1·08–2·78), compared with disliking both high-fat food groups. Addition of BMI into the model attenuated the association with T2D only, but it remained statistically significant (Figure 2, Supplementary Table 3). There was no association with breast cancer after adjusting for all confounders. Liking HFSw food was only associated with higher risk of all-cause mortality (model 2: HR 1·66; 95 % CI 1·01–2·71). This association was not attenuated when adjusted for BMI (model 3). Liking HFSw foods was not associated with other health outcomes when compared with disliking both high-fat food groups (Figure 2, Supplementary Table 3).
Association between HFSa and HFSw food-liking group, single and combined, with health outcomes. Data are presented in hazard ratios with 95 % CI. The referent group is dislike for both HFSa and HFSw. Model 2 was adjusted for age, sex, deprivation, month of recruitment, ethnicity, alcohol, smoking, physical activity and sedentary time. Model 3 was adjusted for variables in model 2 plus BMI. HFSa, high-fat savoury; HFSw, high-fat sweet.

Those who liked both HFSa and HFSw food (compared with those who did not like either) had a higher risk of all-cause mortality (model 2: HR 1·78; 95 % CI 1·17–2·69). This association remained unchanged after adjusting for BMI (model 3). Furthermore, there was a higher risk of all-cause cancer that was not detected in the liking HFSa or HFSw only categories (model 2: HR 1·10; 95 % CI 1·02–1·19). This association attenuated slightly when adjusted for BMI (model 3). Liking both HFSa and HFSw foods was not significantly associated with T2D or CVD independently of socio-demographic or lifestyle confounders.
Sensitivity analyses
To explore the somewhat unexpected associations of lower risk of T2D and CVD outcomes with liking HFSw food, we ran two sensitivity analyses exploring both high-fat food-liking groups further.
First, we ran model 2 for HFSa- and HFSw-liking groups as shown in Figure 1 but additionally adjusted for the three remaining food-liking groups. When we additionally adjusted HFSw analysis for liking for HFSa foods, LFSa and LFSw foods, the association between T2D and liking of HFSw group became even stronger (T2D: HR 0·88; 95 % CI 0·84–0·92, p < 0·001) compared with model 2 (data not shown). For CVD, additionally adjustment for liking for HFSa foods, LFSa and LFSw foods, the association between CVD and liking of HFSw group became non-significant (CVD: HR 0·99; 95 % CI 0·97–1·01, p = 0·207). This contrasted with liking of HFSa foods sensitivity analysis, where the association between both T2D and CVD remained comparable with model 2 (Figure 1). For the other included conditions, adjusting for other food groups had no effect on the association for either liking of HFSa or HFSw foods.
Second, we ran model 2 for HFSw and HFSa and T2D and CVD outcomes additionally adjusted for being on a blood pressure medication and on cholesterol-lowering medications (self-reported by participants), which attenuated the association between liking HFSw and CVD when adjusted for medication (HR 1·00; 95 % CI 0·98–1·02, p = 0·954), but it did not affect the association for HFSw and T2D (HR 0·87; 95 % CI 0·83–0·91, p < 0·001). Similarly, when adjusted for medication, associations of HFSa foods with both outcomes remained comparable (data not shown).
Discussion
This study investigated associations between liking for food high in fat content and sweet v. savoury taste preference and health outcomes. The findings suggest that liking high-fat foods is generally associated with higher risk of several major non-communicable diseases. In contrast, a preference for LFSa foods, comprising various vegetables, was consistently associated with reduced risks across multiple health outcomes. This pattern extended, though to a lesser degree, to LFSw foods (liking for fruits), despite their potentially high sugar content. However, a possible increased risk of prostate cancer in the LFSw-liking group warrants further investigation. Notably, liking sweet taste appeared to be associated with higher health risks only when combined with a preference for high-fat foods, with the exception of association of liking HFSw foods and CVD and T2D risk, which showed lower risk. Further adjusting for CVD medication or mutually adjusting for other food-liking groups did not modify these associations and the findings remained robust. Finally, while BMI adjustment attenuated the association with T2D, it did not significantly affect the majority of other outcomes suggesting most were unlikely to be meaningfully explained by adiposity, though admittedly, we only had baseline BMI information available for the models.
Our findings of associations between liking for high-fat foods and adiposity as health outcome add to the related evidence from our previous study which investigated intake of total fat and total sugar. We found that intake of fat (but not sugar) was associated with adiposity(Reference Anderson, Celis-Morales and Mackay32). Previous studies that investigated adiposity and liking for high-fat foods found that liking high-fat foods was found to be the main food preference-related adiposity risk factor(Reference Deglaire, Méjean and Castetbon19,Reference Lampuré, Castetbon and Deglaire21) .
Previous investigation looking at adverse health outcomes and food liking found that liking HFSa foods was associated with increased risk of hypertension, T2D and CVD(Reference Lampuré, Adriouch and Castetbon22). While liking high fat and high sweet was associated with T2D, liking for sweet was not associated with CVD risk and was associated with decreased risk of T2D(Reference Lampuré, Adriouch and Castetbon22). In agreement with this study, we also observed lower risk of T2D for those liking sweet foods, but unlike the earlier study, this included liking of both low-fat and HFSw tasting foods. Given the lack of a clear biological mechanism, this finding should be interpreted with caution. One plausible explanation is reverse causation, whereby individuals with T2D or those at elevated risk of T2D may modify their dietary preferences or report reduced liking for sweet-tasting foods following diagnosis or lifestyle advice. In agreement with many previous studies, we found that a larger proportion of participants who liked HFSa and HFSw food (compare with those who did not) were living with obesity (Table 1). However, contrary to a previous study by Lampure et al.(Reference Lampuré, Adriouch and Castetbon22), we did not find that the link between food liking and health outcomes was explained by BMI, except for liking HFSa and T2D where BMI appeared to partially attenuate the association. Furthermore, while those that liked HFSa and HFSw foods had slightly higher total energy intake/day than those who disliked them, their energy intake was similar to those in other food-liking groups and equivalent to the average energy intake of the sample; yet, higher total energy intake correlated with liking for high-fat foods. This suggests that the observed association between liking HFSa and HFSw foods and included health outcomes may not be explained by the self-reported total energy intake in this study. Some previous studies have also observed similar discrepancies, where while fat intake and liking fat correlated well, only liking fat and not fat intake was associated with health outcomes. This is possibly because food liking reflects habitual intake better with less reporting bias than recall of dietary intake using a questionnaire(Reference Duffy, Hayes and Sullivan16,Reference Duffy, Lanier and Hutchins23) .
Our findings provide evidence that liking foods high in fat is more strongly associated with health outcomes than liking sweet foods. However, it is important to note that the foods used to characterise food liking in this study differed in other ways in addition to their fat and sugar content. For example, while the LFSw and LFSa foods were mostly of plant origin (except honey), high in fibre and minimally processed, many of the foods used to define liking HFSa and HFSw were low in fibre, highly processed and of animal origin, which could also affect the observed associations with health outcomes and could be contributory factors. Unlike experimental food preference-capturing approaches using visual food stimuli under controlled laboratory conditions, the UK Biobank questionnaire may better reflect broader real-world food preference patterns relevant to habitual dietary behaviours.
There is emerging evidence from observational studies of associations between the intake of some processed and ultraprocessed foods and risk of multiple adverse health outcomes,(Reference Aramburu, Alvarado-Gamarra and Cornejo33) but it remains uncertain whether these associations are caused by effects of food processing. Also, intake of highly palatable foods can be influenced by mental health and emotional triggers,(Reference Bilici, Ayhan and Karabudak34) which, in turn, are linked to adverse health outcomes(Reference Stein, Benjet and Gureje35). On the other hand, healthy diet is associated with positive health behaviours such as enjoyment of food(Reference Dubois, Bédard and Goulet36), which can contribute to the association with good health outcomes through mechanisms other than the content of fat and sugar. Overall, the observed associations were consistent with population-based food preference research and likely reflect broader hedonic preference patterns for classes of foods rather than isolated preferences for fat or sugar alone. This is particularly relevant given that UK Biobank assessed liking for real-world foods rather than experimentally controlled nutrient stimuli.
Our study had several strengths. UK Biobank is a large cohort with granular information on the exposures of interest and covariates and long-term follow-up through linkage to health records. However, there were several important limitations. First, the temporality cannot be established using available data from UK Biobank, as exposure, confounders and potential mediators were collected at different times. Namely, the information on food liking was collected between 2019 and 2020(Reference May-Wilson, Matoba and Wade4), many years after the confounding variables and BMI (2006–2010) and food intake (2009–2012) and close to the time the follow-up data on health outcomes were censored for this study. However, this limitation is common in other longitudinal cohort studies, and we mitigated against this partially through use of a 2-year landmark analysis to limit reverse causality. And while BMI could have changed during the follow up, which we were unable to investigate further, dietary intake was shown to correlate well with food liking in a recent UK Biobank study(Reference May-Wilson, Matoba and Wade4). It was also showed in other studies that food liking tends to be quite stable over time(Reference Duffy, Hayes and Sullivan16,Reference Carbonneau, Bradette-Laplante and Lamarche17) . Second, we used the high-fat food items representative of food liking as per Finlayson et al.(Reference Finlayson, King and Blundell26), however, not all core food items were available in UK Biobank, such as doughnut, muffin or shortbread so these were replaced by similar HFSw foods such as marzipan, cheesecake and cakes; consequently, items in the high-fat food categories were adapted using conceptually similar foods available in the dataset. Our low-fat foods comprised of mostly vegetables and fruits, unlike previous studies(Reference Navratilova, Whetton and Geifman24,Reference Finlayson, King and Blundell26) . However, this was chosen as most original items in these categories were missing in UK Biobank (e.g. jelly, jelly babies, marshmallows and popcorn) and the resulting decision to include vegetables and fruit products only allowed to compare liking for high-fat food to healthy high-fibre options and focus on fat and sugar content only rather than other nutrient content or level of processing. However, the observed associations likely reflect broader hedonic preference patterns for classes of healthier foods rather than isolated preferences for fat or sugar alone. It is also important to note that unlike previous experimental food preference paradigms using visual food stimuli, UK Biobank assessed population study liking using text-based food descriptions, which may capture broader conceptual food preferences rather than immediate cue-reactivity responses, however, it can introduce differences when trying to compare findings to the previous literature. Third, the UK Biobank population is more health-conscious and well educated than the general population which not only limits generalisability(Reference Batty, Gale and Kivimäki37); in addition, it could impact conscious regulation of food preferences in terms of actual dietary intake(Reference Duffy, Hayes and Sullivan16) or impact the extent to which participants will admit to liking or consuming unhealthy foods(Reference Schwingshackl, Schünemann and Meerpohl3). Fourth, the dietary data in UK Biobank were self-reported and underreporting dietary intake and resulting total energy intake due to social desirability effect is a well-known issue in observational studies,(Reference Hebert, Clemow and Pbert38) and this could have impacted the way food liking relates to the actual dietary intake or energy intake in UK Biobank. The fifth limitation arises with the limitations of the nine-point hedonic scale. While scale responses are, in practice, treated as points on a continuum instead of categorical and discrete data can cause issues in analysis(Reference Olsen29,Reference Lim30) . When the Hedonic Likert scale of 1–9 was collapsed into a binary variable in this study, the middle response – ‘5’ – was included in the ‘dislike’ category. This was done to reflect the scale and the ambivalence and indifference in the response rather than its neutrality(Reference Olsen29) and including it in the ‘dislike’ category avoided erroneous inflation of results, since any bias introduced will have been towards the null. Also, grouping scores 1–5 together improved the balance of numbers in the ‘like’ and ‘dislike’ groups. The questionnaire did not provide verbal labels for intermediate scores and participants were instructed only that higher scores reflected greater liking and lower scores reflected lower liking. Therefore, score 5 was not labelled as a neutral category. The authors acknowledge that collapsing nine-point scale into two categories reduced information, but it was necessary to improve interpretation. The sixth limitation related to the interpretation of results without correction for multiple comparisons. While multiple statistical tests were performed, formal correction for multiple comparisons was not applied as analyses were conducted based on predefined hypotheses relating to four a priori food preference categories and obesity-related health outcomes rather than exploratory screening across all individual food items or health outcomes. Nevertheless, some findings – particularly those near the significance threshold – may reflect type I error and should therefore be interpreted cautiously and replicated in other studies. Finally, as with any observational study, causation cannot be automatically inferred from association and, in spite of adjustment for many confounders, residual confounding is likely.
Conclusions
This study demonstrated important associations between food liking and risk of common non-communicable diseases. While further research is needed to explore the mechanisms underlying these associations especially for CVD and T2D, our study highlighted the potential role of food liking in designing and targeting health promotion interventions. For example, there are opportunities to inform and tailor dietary guidance not only based on nutritional content but also on individual food liking profiles. Hedonic responses to food may also serve as early behavioural markers of dietary risk and health outcomes. Understanding population-level patterns in food liking may inform policy strategies such as reformulation targets, to promote transitioning to healthier dietary behaviours. However, trials are needed to explore this potential.
Supplementary material
To view supplementary material for this article, please visit https://doi.org/10.1017/S0007114526108022.
Acknowledgements
We would like to thank the participants and the staff of UK Biobank.
UK Biobank was funded by the Wellcome Trust, Medical Research Council, Department of Health, Scottish Government and Northwest Regional Development Agency. UK Biobank has also had funding from the Welsh Assembly Government and the British Heart Foundation. This project was completed using UK Biobank applications 71392. John Mathers’ research is funded by grant number IIG_FULL_2020_032 from the Wereld Kanker Onderzoek Fonds (WKOF), as part of the World Cancer Research Fund International grant programme.
Solange Parra-Soto: Formal analysis-Lead, Investigation-Equal, Methodology-Equal, Writing – original draft-Equal, Writing – review & editing-Equal; Jana J. Anderson: Formal analysis-Lead, Investigation-Lead, Methodology-Equal, Writing – original draft-Lead, Writing – review & editing-Equal; Jirapitcha Boonpor: Investigation-Supporting, Writing – review & editing-Equal; Carolina Araya Bastias: Investigation-Supporting, Writing – review & editing-Equal; Donald M. Lyall: Investigation-Supporting, Methodology-Supporting, Writing – review & editing-Equal; Frederick K. Ho: Formal analysis-Supporting, Investigation-Supporting, Methodology-Supporting, Writing – review & editing-Equal; Paul Welsh: Investigation-Supporting, Methodology-Supporting, Writing – review & editing-Equal; Jill P. Pell: Investigation-Supporting, Methodology-Supporting, Writing – original draft-Equal, Writing – review & editing-Equal; Naveed Sattar: Conceptualisation-Supporting, Investigation-Supporting, Methodology-Supporting, Writing – review & editing-Equal; Jason M. Gill: Conceptualisation-Supporting, Investigation-Supporting, Methodology-Supporting, Writing – review & editing-Equal; John C. Mathers: Conceptualisation-Supporting, Investigation-Supporting, Methodology-Supporting, Writing – review & editing-Equal; Carlos Celis-Morales: Conceptualisation-Lead, Formal analysis-Supporting, Methodology-Lead, Writing – original draft-Supporting, Writing – review & editing-Equal.
There are no conflicts of interest.


 Open access

