Implications
Paratuberculosis, caused by the agent Mycobacterium avium ssp. paratuberculosis (MAP), occurs worldwide and leads to high economic losses, due to reduced milk production, reduced fertility and higher management costs in dairy farms. Heritabilities for the susceptibility to MAP infection range between 0.031 and 0.283, whereas fecal culture shows a higher genetic background than ELISA test results. Due to different test systems used for phenotypic characterization of the MAP status of the cattle, so far association studies lead to inconsistent results. Therefore it was the aim of this study to perform a case-control genome-wide association study with MAP fecal culture phenotyped German Holstein cows which were simultaneous tested with four different ELISA tests to contribute to the understanding of genetic variability involved in MAP susceptibility.
Introduction
Paratuberculosis or Johne’s disease is a chronic intestinal disease especially in ruminants caused by the agent Mycobacterium avium ssp. paratuberculosis (MAP). Infection with MAP occurs worldwide and leads to economic losses due to lower milk production, reduced fertility and costs associated with the management of infected animals (McKenna et al., Reference McKenna, Keefe, Tiwari, van Leeuwen and Barkema2006). Estimated prevalence rates for MAP are among European cattle up to 20%, but at least 3% to 5% in some countries (Nielsen and Toft, Reference Nielsen and Toft2009). Due to a lack of country wide testing schemes, the long incubation time, subclinical phases (Chiodini et al., Reference Chiodini, van Kruiningen and Merkal1984) and problems with test method accuracy (Kohl et al., Reference Kohl, Geisbauer, Wassertheurer, Revilla-Fernández, Damoser, Österreicher, Dünser, Kleb and Baumgartner2012), it is difficult to make a statement about prevalence rates. In 2007, the US Department of Agriculture’s National Animal Health Monitoring System reported, that 68% of dairy herds in the United States were found to be infected with MAP, whereas 21.6% of these farms had at least 10% of cows infected with MAP. In contrast herd prevalence rates in Europe range from 6.9% in Austria (Dreier et al., Reference Dreier, Khol, Stein, Fuchs, Gutler and Baumgartner2006) to 54.7% in the Netherlands (Muskens et al., Reference Muskens, Barkema, Russchen, van Maanen, Schukken and Bakker2000). Another aspect is the controversially discussed relationship between MAP and Crohn’s disease in humans whereas the causal role of MAP has not been confirmed so far (Mendoza et al., Reference Mendoza, Lana and Diaz-Rubio2009).
As an infection with MAP is not treatable it is important to control the infection with MAP in farm animals, by (a) preventing transmission of the organism to susceptible animals by management strategies, (b) by identifying and culling infected animals, and/or by clarifying the genetic background of MAP susceptibility to improve selection options. Several studies have estimated heritabilities for paratuberculosis susceptibility. Depending on the test method for MAP and the model used, heritability for MAP infection status varies between 0.031 and 0.283 (Hinger et al., Reference Hinger, Brandt and Erhardt2008; Küpper et al., Reference Küpper, Brandt, Donat and Erhardt2012; van Hulzen et al., Reference van Hulzen, Nielen, Koets, de Jong, van Arendonk and Heuven2011). Thereby the fecal culture test results shows a higher genetic variation than ELISA test results. Fecal culture tests are also often used as standard when calculating sensitivity and specificity for ELISA tests (Donat et al., Reference Donat, Schau, Soschinka and Köhler2012).
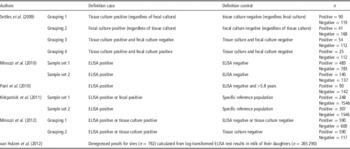
Recently the potential genetic loci associated with MAP in cattle have been reviewed (Purdie et al., Reference Purdie, Plain, Begg, de Silva and Whittington2011). These loci were identified by testing candidate genes, by genome-wide linkage or association studies. A genome wide linkage analysis identified a quantitative trait locus associated with MAP susceptibility on Bos taurus chromosome 20 (BTA 20) (Gonda et al., Reference Gonda, Kirkpatrick, Shook and Collins2007). Polymorphisms with significant associations to MAP susceptibility were found in the following candidate genes: CARD15 (Pinedo et al., Reference Pinedo, Buergelt, Donovan, Melendez, Morel, Wu, Langaee and Rae2009a; Ruiz-Larranaga et al., Reference Ruiz-Larranaga, Carrido, Iriondo, Manzano, Molina, Koets, Rutten, Juste and Estonba2010a), IL10 (Verschoor et al., Reference Verschoor, Pant, You, Schenkel, Kelton and Karrow2010), TLR1, TLR2, TLR4 (Mucha et al., Reference Mucha, Bhide, Chakurkar, Novak and Mikula2009; Purdie et al., Reference Purdie, Plain, Begg, de Silva and Whittington2011) and SLC11A1 (Pinedo et al., Reference Pinedo, Buergelt, Donovan, Melendez, Morel, Wu, Langaee and Rae2009b; Ruiz-Larranaga et al., Reference Ruiz-Larranaga, Garrido, Manzano, Iriondo, Molina, Gils, Koets, Rutten, Juste and Estonba2010b). The first genome-wide association (GWA) study using the Illumina Bovine SNP50 BeadChip related to MAP susceptibility was published by Settles et al. (Reference Settles, Zanella, McKay, Schnabel, Taylor, Whitlock, Schukken, van Kessel, Smith and Neibergs2009). In this study, regions on BTA 3 and 9 were identified with a high significance to MAP status tested by MAP culture in feces and tissue in US Holsteins. In different GWA studies several associations were found on different chromosomes (Minozzi et al., Reference Minozzi, Buggiotti, Stella, Strozzi, Luini and Williams2010; Pant et al., Reference Pant, Schenkel, Verschoor, You, Kelton, Moore and Karrow2010; Kirkpatrick et al., Reference Kirkpatrick, Shi, Shook and Collins2011; Minozzi et al., Reference Minozzi, Williams, Stella, Strozzi, Luini, Settles, Taylor, Whitlock, Zanella and Neibergs2012; van Hulzen et al., Reference van Hulzen, Schopen, van Arendonk, Nielen, Koets, Schrooten and Heuven2012), summarized in Supplementary Table S1. These studies provide in general evidence for the existence of genomic regions associated with MAP infection in dairy cows. Nevertheless the results are not consistent, probably because different test methods and study designs were used as summarized in Table 1, which may directly influence the statistical power.
Comparison of genome-wide association studies related to MAP-infection in dairy cows

MAP=Mycobacterium avium ssp. paratuberculosis.
Therefore, it was the aim of this study to perform a case-control GWA study with MAP fecal culture tested German Holstein cows which were simultaneous tested with four different ELISA tests, for a better understanding of associated genetic loci found by different paratuberculosis tests.
Material and methods
Data set and phenotyping
In 2008 and 2009, 11 285 German Holstein herdbook cows were tested for MAP infection by fecal culture, within a voluntary program in Thuringia, Germany (Donat et al., Reference Donat, Schau, Soschinka and Köhler2012). For the case-control study 152 fecal culture positive, animals were chosen as cases and following their pedigree information, we assigned every positive animal one animal as control. To exclude possible stratification factors we used the following criteria for the 153 fecal negative animals of the control group: (1) same farm, (2) same sire and (3) same age (±3 months). From these 305 animals blood samples were collected via K-EDTA Monovette® (Sarstedt, Nümbrecht). The samples were centrifuged (840×g) for 20 min. Buffy coat and plasma from each sample were kept at −20°C until further usage.
In addition to fecal culture, we tested in plasma of all the 305 animals included in the case-control study the MAP antibody titer with four different commercial blood ELISA tests: CATTLETYPE® MAP Ab (Labor Diagnostik, Leipzig, Germany), ID Screen® (ID.vet Montpellier, France), Parachek® (Prionics, Schlieren-Zürich, Switzerland), and Pourquier® Mycobactin (IDEXX Laboratories Inc., Westbrook, USA). These four tests were all accredited for Germany in 2010. Test executions, as well as the cut-offs for the qualitative analysis were done according to manufactures information.
Additional to the classification as fecal case and control, we regrouped the 305 animals according to their ELISA test results. On the one hand positive is defined whenever one animal was positive at least in one of the four different ELISA test results (ELISA+), and on the other hand positive is defined whenever one animal was positive in all four different ELISA test results (ELISA4+). In this analysis we considered only the ELISA tests to analyze the differences between ELISA test methods.
Illumina SNP50 BeadChip
DNA was extracted from the buffy coat according to Montgomery and Sise (Reference Montgomery and Sise1990) and genotyped using either the Illumina SNP50 BeadChip v1 with a total of 54 001 single-nucleotide polymorphisms (SNPs) for 178 animals (mean spacing between the SNPs of 51.5 kb) or the second generation Illumina SNP50 BeadChip v2 containing 54 609 SNPs for 127 animals (mean spacing between the SNPs of 49.4 kb). In total 48 186 SNPs are available in both BeadChips and are used for the statistical analysis. Samples were genotyped within the genotyping platform of the German Holstein breeding association routinely used for SNP typing for estimating genomic breeding values.
Statistical analysis and quality control
Quality control parameters for the SNP-data were measured with R using the ‘check.marker’ function by GenABEL package (Aulchenko et al., Reference Aulchenko, Ripke, Isaacs and van Duijn2007). Markers not displaying Hardy Weinberg equilibrium (P⩽5%), with low call (<95%) rates or minor allele frequencies (maf<2%) were excluded as well as markers with more than 5% of missing data. Also animals with low call rates (<95%) and high identical by state (IBS⩾95) were excluded. The ‘qtscore’ function for a binary trait of the GenABEL package (Aulchenko et al., Reference Aulchenko, Ripke, Isaacs and van Duijn2007) was used for the GWA study. The data were not pruned. Uncorrected P-values between 5×10⁻⁷ and 5×10⁻⁵ were considered as moderately significant and P-values <5×10⁻⁷ provided strong evidence of association SNPs without known map position were excluded for the Manhattan plots.
Results
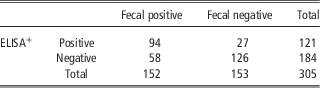
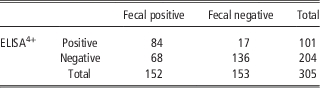
The results of the ELISA test in relation to the fecal test results are shown in Tables 2 and 3. From the total 305 animals (152 fecal positive and 153 fecal negative), 84 animals were identified as positive with all test methods and 126 animals were tested negative with all test methods. A smaller number of animals are detected as positive by ELISA test. From the 152 fecal positive tested animals 58 and 68, respectively, could not be detected by ELISA+ or ELISA4+ as positive.
Comparison of fecal culture and ELISA+ test results for MAP infection
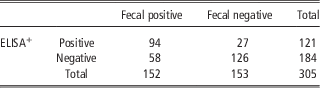
MAP=Mycobacterium avium ssp. paratuberculosis.
ELISA positive is defined whenever animals were positive in one of the four different ELISA test results.
Comparison of fecal culture and ELISA4+ test results for MAP infection

MAP=Mycobacterium avium ssp. paratuberculosis.
ELISA positive is defined whenever animals were positive in four of the four different ELISA test results.
GWA analysis
Quality control
A total of 6414 markers were excluded from the study due to low minor allele frequency and 1896 were excluded due to low call rate. In total, 40 079 markers and 305 animals were included in the statistical analysis.
Fecal positive v. fecal negative
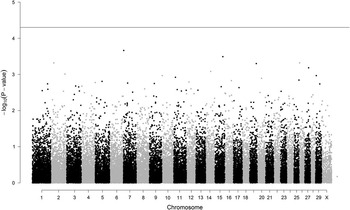
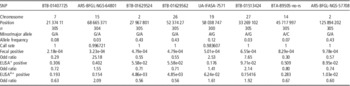
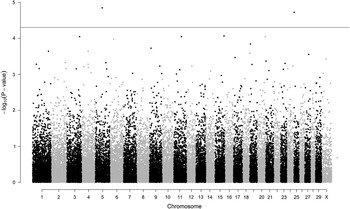
For the genome wide association analysis 152 fecal culture positive and 153 fecal culture negative animals were used. Figure 1 shows the results of the GWA scan. Table 4 summarizes the SNPs that show strongest association with MAP status based on serological testing either in one (ELISA+) or in four (ELISA4+) different ELISA tests. No significant association between the SNPs and the fecal test results could be demonstrated.
Association of single-nucleotide polymorphisms (SNPs) with Mycobacterium avium ssp. paratuberculosis (MAP)-infection in Holsteins phenotyped by fecal culture. Manhattan plot of –log10 (P-values) with results of the whole-genome scan for an association of loci with MAP fecal culture positive tested German Holstein cows. The straight line at −log10 (5×10⁻⁵) indicates a moderate significance level.

List with P-values of the most associated SNPs with MAP fecal culture positive and with MAP ELISA positive tested Holsteins

SNP=single-nucleotide polymorphism; MAP=Mycobacterium avium ssp. paratuberculosis.
ELISA positive is defined whenever animals were positive in one (ELISA+) or respectively four (ELISA4+) of the four different ELISA test results.
ELISA positive v. ELISA negative
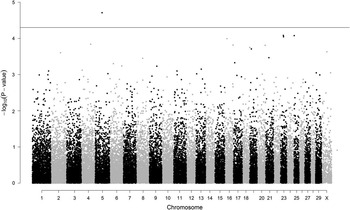
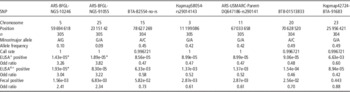
In the first analysis (ELISA+, where positive is defined whenever one animal was positive in one of the four different ELISA test results) 121 animals were used as case and 184 animals for control. The GWA scan (Figure 2) of this data set shows no strong associations with P-values of <5×10⁻⁷. Two SNPs with moderate associations were found: one on BTA 5 (position: 59 694 618, P=1.43×10⁻⁵) and the other on BTA 25 (position: 23 151 542, P=1.89×10⁻⁵). In the second analysis (ELISA4+), where cases (n=101) are defined as animals with positive test results in all four ELISA tests, only the SNP on chromosome 5 (position: 59 694 618, P=1.93×10⁻⁵) shows a moderate association to MAP infection (Figure 3).
Association of single-nucleotide polymorphisms (SNPs) with Mycobacterium avium ssp. paratuberculosis (MAP)-infection in Holsteins phenotyped by ELISA+. Manhattan plot of –log10 (P-values) with results of the whole-genome scan for an association of loci with MAP ELISA positive tested German Holstein cows. Positive is defined whenever one animal was positive in at least one of four different ELISA test results (ELISA+), regardless of fecal culture results. The straight line at −log10 (5×10⁻⁵) indicates a moderate significance level.

Association of single-nucleotide polymorphisms (SNPs) with Mycobacterium avium ssp. paratuberculosis (MAP)-infection in Holsteins phenotyped by ELISA4+. Manhattan plot of –log10 (P-values) with results of the whole-genome scan for an association of loci with MAP ELISA positive tested German Holstein cows. Positive is defined whenever one animal was positive in all four ELISA test results (ELISA4+), regardless of fecal culture results. The straight line at −log10 (5×10⁻⁵) indicates a moderate significance level.

The results are summarized in Table 5.
List of SNPs with P-values<1.0e-04 of MAP ELISA positive tested Holsteins

*Moderately significant (5×10⁻⁷–5×10⁻⁵)
ELISA positive is defined whenever an animals were positive in one (ELISA + ) or respectively in all four (ELISA 4+ ) of the four different ELISA tests.
Discussion
The differences in the number of positive/negative animals between fecal test results and ELISA test results (Tables 2 and 3) within the same population shows the diagnostic complexity and, therefore, the difficulty to define the phenotype for a case-control study in a correct way. Also the differences between the four ELISA test results reflect the same problem. The differences between the fecal test results and ELISA test results are caused by the specific pathogenesis of paratuberculosis (Collins, Reference Collins2003). The synthesis of antibodies is causally linked to the stage of the disease. First, after MAP infection the cell-mediated immune response to MAP is an early event in the pathogenesis, whereas the humoral immune response follows in later stages of the disease. Because of the different stages in the pathogenesis of paratuberculosis, it is evident to get different test results within the same animal, depending on time of testing and the test used for phenotyping. Antibodies are found in most of the clinically diseased animals, whereas in fecal shedders without clinical symptoms antibodies often are not detectable (Collins et al., Reference Collin, Sockett, Ridge and Cox1991; Sweeney et al., Reference Sweeney, Whitlock, Buckley and Spencer1995; Dargatz et al., Reference Dargatz, Byrum, Barber, Sweeney, Whitlock, Shulaw, Jacobson and Stabel2001). Therefore, the result of a serological test depends on the age of testing (Nielsen and Toft, Reference Nielsen and Toft2006) and the level of shedding (Sweeney et al., Reference Sweeney, Whitlock, Buckley and Spencer1995; Whitlock et al., Reference Whitlock, Wells, Sweeney and VanTiem2000; Dargatz et al., Reference Dargatz, Byrum, Barber, Sweeney, Whitlock, Shulaw, Jacobson and Stabel2001). A causal relationship between the increased antibody synthesis and enhanced MAP shedding is still not established, but a higher lysis of macrophages in later stages of the disease is assumed to cause a higher antigen presentation to T- and B-cells and, therefore an increase in antibody secretion (Coussens, Reference Coussens2001).
No SNP with strong or moderate associations to the presence of MAP in feces could be found. However, we searched within Genbank for putative functional candidate genes on the basis of the SNPs with the strongest associations (Table 4) and obtained a list with more than 100 genes (within 1 Mbp region of the different SNPs). Most of these genes appear to have a relation with immune response. None of these genes were found in previous published GWA studies (summarized in Supplementary Table S1). Also there is no functional candidate gene described in the literature within 1 Mbp region of the SNPs in the present study (Settles et al., Reference Settles, Zanella, McKay, Schnabel, Taylor, Whitlock, Schukken, van Kessel, Smith and Neibergs2009; Minozzi et al., Reference Minozzi, Buggiotti, Stella, Strozzi, Luini and Williams2010; Pant et al., Reference Pant, Schenkel, Verschoor, You, Kelton, Moore and Karrow2010; Kirkpatrick et al., Reference Kirkpatrick, Shi, Shook and Collins2011; Minozzi et al., Reference Minozzi, Williams, Stella, Strozzi, Luini, Settles, Taylor, Whitlock, Zanella and Neibergs2012; van Hulzen et al., Reference van Hulzen, Schopen, van Arendonk, Nielen, Koets, Schrooten and Heuven2012). This supports once more the conclusion that paratuberculosis is probably affected by a large number of genes. Susceptibility loci for complex disease identified in one population often cannot be replicated in other populations (Levinson et al., Reference Levinson, Holmans, Laurent, Riley, Pulver, Gejman, Schwab, Williams, Owen, Wildenauer, Sanders, Nestadt, Mowry, Wormley, Bauché, Soubigou, Ribble, Nertney, Liang, Martinoloch, Maier, Norton, Williams, Albus, Carpenter, deMachi, Ewen-White, Walsh, Jay, Deleuze, O’neill, Papadimitriou, Weilbacher, Lerer, O’Donovan, Dikeos, Silverman, Kendler, Mallet, Crowe and Walters2002). On the other hand it could be an effect of the unclear definition of the animal phenotype, because GWA-studies based on phenotype definition by different test methods identify different genes (Minozzi et al., Reference Minozzi, Williams, Stella, Strozzi, Luini, Settles, Taylor, Whitlock, Zanella and Neibergs2012). Most GWA studies used milk or blood ELISA for phenotyping (Minozzi et al., Reference Minozzi, Buggiotti, Stella, Strozzi, Luini and Williams2010; Pant et al., Reference Pant, Schenkel, Verschoor, You, Kelton, Moore and Karrow2010; Ruiz-Larranaga et al., Reference Ruiz-Larranaga, Garrido, Manzano, Iriondo, Molina, Gils, Koets, Rutten, Juste and Estonba2010b; Kirkpatrick et al., Reference Kirkpatrick, Shi, Shook and Collins2011; Minozzi et al., Reference Minozzi, Williams, Stella, Strozzi, Luini, Settles, Taylor, Whitlock, Zanella and Neibergs2012). ELISA may identify genes which are involved in the immune response to the agent, whereas bacterial culture of bacteria in feces or tissue will identify genetic loci, which are involved in the persistence of the MAP infection at different stages of the disease (Minozzi et al., Reference Minozzi, Williams, Stella, Strozzi, Luini, Settles, Taylor, Whitlock, Zanella and Neibergs2012), the development of the granulomatous enteritis and the release of MAP into the feces. Another aspect is the design of the diverse studies. We used the case-control design, with MAP positive animals as cases and MAP negative controls as counterpart. The control animals match the cases with regard to environment and genetics that makes the case-control study more efficient than a cohort study of the same population. When using the results of antibody presence against MAP in blood, instead of using fecal culture results, two SNPs with a significant association to the detection of MAP antibodies (ELISA+) were found on BTA 5 and 25. Considering only the animals with four positive ELISA test results (ELISA4+) only the SNP on BTA 5 remains. Compared with the analysis of the fecal culture results, we got a totally different list of genes.
The two SNPs on BTA 5 and 25 are in regions where no genes have been identified so far. Considering all genes in the 1 Mbp region around the SNPs as well as the function of these genes we can identify one gene of high interest on chromosome 25, the Interleukin 32 (IL32) gene (177.5 kb downstream of the putative SNP). Interleukins are proinflammatory cytokines, which are important in the signaling cascade of the immune response to a pathogen. The interaction and balance of the cytokines will influence the outcome of the immune response. IL32 has been implicated in inflammatory disorders, mycobacterium tuberculosis infections and inflammatory bowel disease in humans (Felaco et al., Reference Felaco, Castellani, de Lutiis, Felaco, Pandolfi, Salini, de Amicis, Vecchiet, Tete, Ciampoli, Conti, Cerulli, Caraffa, Antinolfi, Cuccurullo, Perrella, Theoharides, Conti, Toniato, Kempuraj and Shaik2009). These facts make IL32 both a biological and positional interesting candidate gene. To clarify this hypothesis further studies, for example sequencing of the interleukin, expressions studies and/or studies about the association of MAP status and the interleukins are necessary. To increase the evidence for the effects of genetic loci and the statistical power, one approach is the joint analysis of two or more GWA data sets (Minozzi et al., Reference Minozzi, Williams, Stella, Strozzi, Luini, Settles, Taylor, Whitlock, Zanella and Neibergs2012), but this approach requires that the same phenotyping method was used.
So we can conclude that several genes are located within 1 Mbp of the significant SNPs. One of these can be supposed as candidate gene for MAP susceptibility because of the function or as described in the literature. Compared with the literature, none of the significant markers found in this study were found in other GWA studies. Also within 1 Mbp region of the significant SNPs no candidate genes for the susceptibility to MAP are described in the literature so far. The GWA study showed that different chromosomes and chromosomal regions are of interest by detection of MAP in fecal culture or the presence of antibodies against MAP in blood. One explanation for these different results could be the difference in sensitivity between the diagnostic tests. Another suggestion is, that numerous loci are involved in different stages of the disease, as expected. Therefore one of the greatest challenges for researchers in the field of paratuberculosis will be to define the important aspects of the multifactorial disease and then to find secure and continuous test methods for the different aspects of MAP infection.
Acknowledgments
The authors would like to thank the herd book breeders from Thuringia for participating in the voluntary program and for providing the data and samples. Funding for parts of genotyping was performed by the EC MacroSys project ref. number FP7-KBBE- 2007–1–1–2–2211602. The authors acknowledge the support of German Holstein Association (DHV).