I. INTRODUCTION
Over the past decades, rare earth compounds have been extensively studied because of their practical and potential applications in high-performance magnets, luminescent devices, catalysts, photovoltaics, biological labels, and other functional materials based on the electronic, optical, and chemical characteristics arising from 4f electrons.Reference Mai, Zhang, Si, Yan, Sun, You and Yan1–Reference Liang, Chang, Chang and Wu5 Among them, the rare-earth-doped fluorides based on AREF4 (A = alkali metal, RE = rare earth) have been investigated for several decades due to their unique luminescent, ferromagnetic, insulating/magnetic, and piezoelectric properties and wide applications in laser devices, three-dimensional flat-panel displays, and low-intensity infrared imaging.Reference Menyuk, Dwight and Pierce6–Reference Shionoya and Yen10 Fluoride host materials provide some distinct advantages owing to the low frequency phonons usually observed in their crystal lattices.Reference Diamente, Raudsepp and van Veggel11, Reference Liu, Wang, Wang and Li12 Usually, rare earth ions (RE3+) doped into fluoride hosts display low probabilities for multiphonon relaxation processes, resulting in long lifetimes of their excited states and high luminescence quantum yields. For example, the hexagonal phase of sodium yttrium fluoride (NaYF4) is considered as the most efficient host material for green and blue upconversion phosphors until now.Reference Krämer, Biner, Frei, Güdel, Hehlen and Lüthi13 Lithium gadolinium tetrafluoride (LiGdF4) is an outstanding host for downconversion luminescence, for which the quantum efficiency is close to 200%.Reference Wegh, Donker, Oskam and Meijerink14 Rare-earth-doped single crystals of KYF4 are excellent solid-state laser materials, and laser action has been observed for ytterbium ions (Yb3+), thulium ions (Tm3+), and holmium ions (Ho3+) in the KYF4 lattice.Reference Möbert, Diening, Heumann, Huber and Chai15, Reference Braud, Girard, Doualan, Thuau, Moncorgé and Tkachuk16 Recently, due to both their structural and optical properties, the RE3+-doped KF–REF3 (RE = Y, Gd) system materials have received more and more attention.Reference Yang, Li, Kang, Cheng, Ma, Peng, Lian, Li and Lin17–Reference Li, Xu, Yang, Cheng, Hou, Ma, Lian and Lin23 In the present article, we will research the synthesis, phase evolution, and optical properties of europium ion (Eu3+)-doped KF–YF3 system materials.
In recent years, materials scientists have explored various synthetic strategies for the syntheses of reproducible and controllable nanocrystals with uniform size, morphology, and chemical composition. Dramatic efforts have been dedicated to synthesize rare earth fluoride nano-/microcrystals with uniform size and shape. In particular, high quality, such as monodisperse, single-crystalline, well-shaped, and phase-pure fluoride nanocrystals have been fabricated successfully due to their potential applications in biology and medicine. There are several successful methodologies for preparation of fluorides that have been well reviewed by Lin.Reference Li and Lin4 The hydrothermal treatment as a typical solution approach has been proved to be effective and convenient in preparing various inorganic materials with diverse controllable morphologies and architectures.Reference Liang, Peng, Wang, Zheng, Wang, Qiu, Nan and Li24 Especially, the hydrothermal method is relatively simple, and easy for implementation as also for production of a large amount of products. Therefore, the hydrothermal route has been adopted for the synthesis of KF–YF3 system materials in the study reported in the present article.
As the most frequently used activator ion in luminescent materials, the Eu3+ mainly shows emissions in the red range due to transitions of 5D0 → 7FJ (J = 1, 2, 3, 4). It is well known that the Eu3+ is a good probe for the chemical environment of the lanthanide ion. The 5D0 → 7F1 and 5D0 → 7F2 are typical magnetic dipole and electric dipole transitions, respectively, and the relative intensities of the two emissions depend strongly on the local symmetry of the Eu3+. In a site with inversion symmetry the magnetic dipole transition 5D0 → 7F1 is dominating, and in a site without inversion symmetry the electric dipole transition 5D0 → 7F2 is stronger. In the present study, by controlling the reactant ratios (KF:RE3+), the hydrothermal temperatures, and the pH values of the prepared solutions, the Yttrium (III) fluoride (YF3), potassium yttrium tetrafluoride (KYF4), and potassium triyttrium decafluoride (KY3F10) materials have been synthesized through a polyethylene glycol (PEG)-assisted hydrothermal method. Due to its sensitivity to local symmetry, the Eu3+ exhibits different optical properties and luminescence dynamics in the final products.
II. EXPERIMENTAL PROCEDURE
The samples were synthesized through a PEG-assisted hydrothermal method. The raw materials yttrium oxide (Y2O3) (99.99%, Sigma-Aldrich, Shanghai, China), europium (III) oxide (Eu2O3) (99.99%, Sigma-Aldrich, Shanghai, China), potassium fluoride (KF) (99+%, Sigma-Aldrich, Germany), and PEG (Mn = 8000, Sigma-Aldrich, Toyko, Japan) were all purchased from Aldrich and used directly without further purification. The PEG stock solution (5 wt%) was prepared by dissolving PEG in deionized water. The rare-earth trichloride (RECl3) stock solution [RE = yttrium (Y), europium (Eu), Y:Eu = 9:1, 0.5 M] was prepared by dissolving the stoichiometrical Y2O3 and Eu2O3 in hydrochloric acid at elevated temperatures. In a typical synthesis procedure, 4 mL of RECl3 solution was added into 21 mL of PEG solution. The obtained solution was stirred for 20 min, and then a 25 mL of PEG solution containing 16 mmol of KF was dropwise added. After agitation for another 15 min, the as-obtained milky solution was transferred into 70 mL of Teflon bottle held in a stainless steel autoclave, sealed, and maintained at 180 °C for 12 h. As the autoclave cooled down to room temperature in natural air under ambient conditions, the precipitates were separated by centrifugation, washed with ethanol and deionized water, and then dried in air at 60 °C for 24 h. Other conditions, such as the reactant ratios of KF:RE3+, the hydrothermal temperatures, and the pH values of prepared solutions, have been adopted to study the effects of the above factors on the crystalline phases and optical properties of the final products. For convenience, the final products synthesized at 180 °C with KF:RE3+ equaling 3, 3.5, 4, 6, 8, 12, 16, and 24 are denoted as Y3K, Y3.5K, Y4K, Y6K, Y8K, Y12K, Y16K, and Y24K, respectively. The final products synthesized with KF:RE3+ = 8 at 60, 100, 140, 180, 220, and 260 °C are denoted as Y60, Y100, Y140, Y180 (Y8K), Y220, and Y260, respectively. And the final products synthesized at 180 °C (KF:RE3+= 8) with pH values equaling 1, 5.5, and 10 are named as YpH1, YpH5.5 (Y8K), and YpH10, respectively. All the samples are treated hydrothermally for 12 h.
The crystalline structures of the obtained samples were characterized by x-ray diffraction (XRD; Xpert/MPD, Eindhoven, Netherlands) with Cu Kα (λ = 1.5406 Å) radiation. The morphology and size of the obtained samples as well as the energy-dispersive spectroscopy (EDS) were observed with field-emission scanning electron microscopy (FE-SEM, JSM-6700F, JEOL, Tokyo, Japan). The room-temperature photoluminescence (PL) excitation and emission spectra were recorded using a Photon Technology International (PTI, Birmingham, NJ) fluorimeter with a Xe-arc lamp of power 60 W as excitation source. The luminescent dynamic decay curves of Eu3+5D0 → 7F1 transition were measured using a phosphorimeter attachment to the PTI with a Xe-flash lamp (25 W) as excitation source.
III. RESULTS AND DISCUSSION
A. Crystalline phase
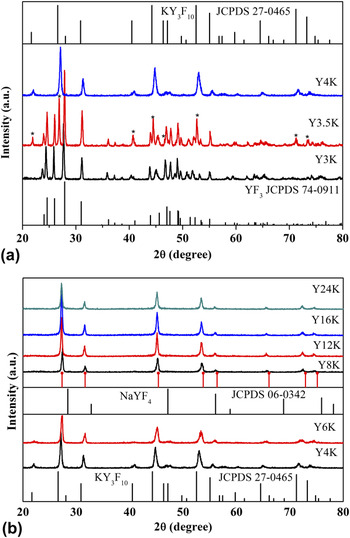
Figure 1 shows XRD patterns of the final products synthesized at 180 °C with different reactant ratios of KF:RE3+. The amount of KF has considerable impact on the crystalline phase of final products. As shown in Fig. 1(a), the XRD pattern of the sample Y3K can be well indexed to the orthorhombic phase of YF3 [Joint Committee on Powder Diffraction Standards (JCPDS) 74-0911], indicating that the potassium ion (K+) does not participate in the chemical reaction. When the ratio of KF to RE3+ increases to 3.5, new peaks marked as * emerge in the XRD pattern of the sample Y3.5K. The new peaks can be indexed to the tetragonal phase of KY3F10 (JCPDS 27-0465), suggesting that the sample Y3.5 is a mixture of the orthorhombic phase of YF3 and the tetragonal phase of KY3F10. The pure tetragonal phase of KY3F10 is obtained with the ratio of KF to RE3+ increasing to 4, as presented in Figs. 1(a) and 1(b). The sample Y6K remains the tetragonal phase of KY3F10, as shown in Fig. 1(b). Some diffraction peaks disappear in sample Y8K. The diffraction peaks can be indexed to the cubic phase of NaYF4 (JCPDS 06-0342, a = 5.45 Å), but the positions of the diffraction peaks move to lower angle for larger ionic radius of K+ replacing Na+, which means that the sample Y8K is isostructural to that of the cubic phase of NaYF4. Based on the assumption of the isostructure, a cubic unit cell with a = 5.65 Å was obtained by using the MDI JADE 5.0 software. The calculated diffraction peaks (red solid dot) are also plotted underside of the experimental pattern of sample Y8K. Increasing the ratio of KF to RE3+, the samples Y12K, Y16K, and Y24K remain as the cubic phase, as shown in Fig. 1(b). The XRD data suggest that the amount of KF has considerable impact on the crystalline phases of the final products. With the increase of the amount of KF, the final products evolve from the orthorhombic phase of YF3 to the tetragonal phase of KY3F10 to the cubic phase of KYF4 finally. Next, the KF:RE3+= 8 condition was selected to investigate the effects of the hydrothermal temperatures and the pH values of the prepared solutions on the final products.
XRD patterns of samples synthesized at 180 °C with different reactant ratios of KF:RE3+ and corresponding standard data.

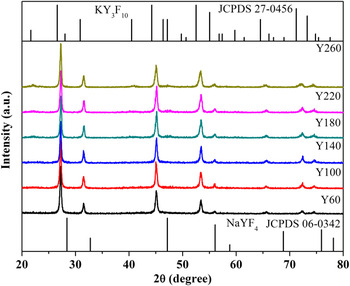
Figure 2 presents the XRD patterns of the final products synthesized at different hydrothermal temperatures with KF:RE3+ = 8 and pH = 5.5. The samples synthesized under lower temperatures (60, 100, 140, and 180 °C) tend to be the cubic phase of KYF4 and the reference data cubic phase of NaYF4 (JCPDS 06-0342) are also listed in Fig. 2. Increasing the hydrothermal temperature further, new peaks emerge in the samples Y220 and Y260. The two samples can be indexed to the tetragonal phase of KY3F10 (JCPDS 27-0465). The hydrothermal temperature dependent XRD patterns of the samples suggest that the lower hydrothermal temperature is beneficial for the formation of the cubic phase of KYF4 and the higher hydrothermal temperature is good for the formation of the tetragonal phase of KY3F10.
Hydrothermal temperature dependent XRD patterns of final products with KF:RE3+= 8:1.

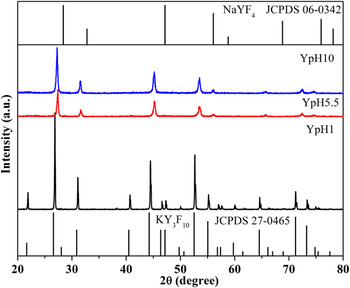
Figure 3 illustrates the XRD patterns of the samples synthesized at 180 °C (KF:RE3+ = 8) with different pH values of prepared solutions. The sample YpH1 synthesized with pH value equaling 1 can be well indexed to the tetragonal phase of KY3F10 (JCPDS 27-0465). From the narrowed peaks of the diffractions peaks, we can infer that the particle size of the sample YpH1 is relatively larger than that of the other KY3F10 samples. The samples YpH5.5 (Y8K) and YpH10 synthesized with pH value equaling 5.5 and 10 can both be indexed to the cubic phase of KYF4. For clarity, the reference data of the cubic phase of NaYF4 (JCPDS 06-0342) and the tetragonal phase of KY3F10 (JCPDS 27-0465) are also listed in the figure. The XRD data suggest that the strong acidic environment is propitious for the formation of the tetragonal phase of KY3F10 and the weak acidic environment and the alkaline environment are favorable for the cubic phase of KYF4.
XRD patterns of samples synthesized at 180 °C (KF:RE3+= 8) with different pH values of prepared solutions.

B. Morphology
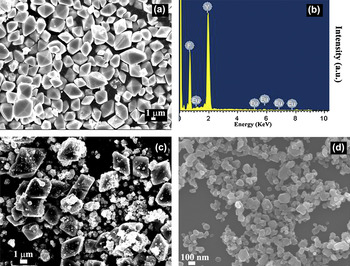
In addition to the crystalline phases of the samples, the morphology and the constituents of some representative samples have also been investigated. Figure 4(a) shows an FE-SEM image of the sample Y3K (YF3). The YF3 is octahedron-shaped with an edge length of 2–4 μm. The EDS pattern of the sample Y3K in Fig. 4(b) confirms that the constituents of the sample are composed of fluorine (F), yttrium (Y), and europium (Eu), indicating that the K+ does not participate in the chemical reaction. In addition to the octahedron-shaped particles, some nanoparticles emerge in the sample Y3.5K as shown in Fig. 4(c). The sample Y4K [Fig. 4(d)] is made up of some particles with an average size of 100 nm. The evolution of the FE-SEM images conforms well to the XRD data, which suggests that the concentration of KF also has considerable impact on the morphology of the samples.
FE-SEM images of (a) Y3K, (c) Y3.5K, and (d) Y4K. (b) EDS pattern of Y3K.

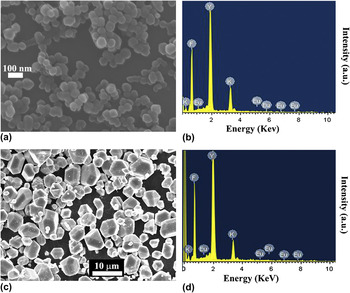
The FE-SEM image of Y8K, which is the cubic phase of KYF4, is shown in Fig. 5(a), and the corresponding EDS pattern is shown in Fig. 5(b). The sample Y8K is composed of spherical particles with an average size of 70 nm. The EDS pattern of the sample suggests that the Y8K is composed of potassium (K), Y, F, and Eu. The FE-SEM image and the EDS pattern of the sample YpH1 are shown in Figs. 5(c) and 5(d), respectively. The sample YpH1 is the tetragonal phase of KY3F10. As shown in Fig. 5(c), the sample KY3F10 is composed of polyhedral morphology particles with an average size of 5–8 μm. The sample Y4K [Fig. 4(d)] is also the tetragonal phase of KY3F10, but the size and the morphology have great differences with those of YpH1. The EDS pattern of the sample in Fig. 5(d) suggests that the YpH1 is also composed of K, Y, F, and Eu. The EDS patterns of the samples Y8K and YpH1 indicate that the two samples are both composed of K, Y, F, and Eu, but the relative proportions of the compositions are different, which also suggests that the crystalline phases of the two samples are different.
FE-SEM image (a) and EDS pattern (b) of Y8K, FE-SEM image (c) and EDS pattern (d) of YpH1.

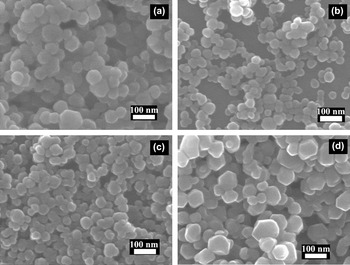
The morphologies of some other representative samples are also studied. The FE-SEM images of YpH10, Y24K, Y100, and Y260 are presented in Figs. 6(a)–6(d), respectively. The sample YpH10 is the cubic phase of KYF4, which is made up of sphere-like particles with an average size of 60 nm. The sample Y24K is also the cubic phase of KYF4, which has smaller size than that of Y8K [Fig. 5(a)] or YpH10 [Fig. 6(a)]. The sample Y100 is the cubic phase of KYF4, which is also composed of spherical particle. With the hydrothermal temperature increasing to 260 °C, the average particle size of the sample Y260 becomes larger. As discussed earlier, the crystalline phase of the samples evolved from the cubic phase of KYF4 to the tetragonal phase of KY3F10 with the hydrothermal temperature increasing. The morphology of the sample Y260 is similar to that of Y4K as shown in Fig. 4(d).
FE-SEM images of (a) YpH10 (b) Y24K (c) Y100 (d) Y260.

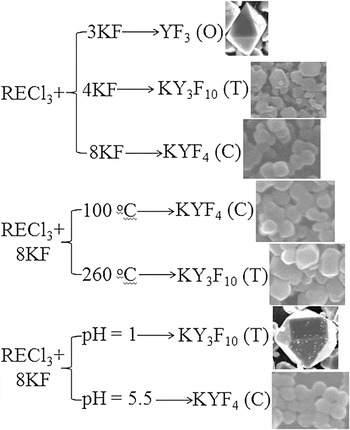
In brief, the formation, the crystalline phase, and the morphology evolution of the samples are summarized in Scheme 1. Based on the analysis of the above crystalline phases and morphologies of the KF–YF3 system materials, a possible formation and phase evolution process of the samples is proposed. For the samples synthesized with different reactant ratios of KF:RE3+, it is easy to understand the phase evolution of the final products. When KF:RE3+ = 3:1, the amount of F− is just adequate for the formation of the orthorhombic phase of REF3 and the K+ cannot participate in the chemical reaction. When the ratio of KF:RE3+ = 3.5:1, the amount of F− is surplus to form the orthorhombic phase of REF3 and the K+ can partially participate in the chemical reaction to form the tetragonal phase of KY3F10. With the increase of the ratio of KF:RE3+ further, the amount of F− is enough to form the tetragonal phase of KY3F10 then to the cubic phase of KYF4. For the sample synthesized with different hydrothermal temperatures and different pH values of the prepared solutions, the results suggest that a higher synthesis temperature and a lower pH value of the prepared solution are good for the formation of the tetragonal phase of KY3F10. Likewise, a lower synthesis temperature and a higher pH value of the prepared solution are beneficial for the formation of the cubic phase of KYF4. The phase evolution of the KF–YF3 system materials is relatively complex and the formation mechanism needs more exploration. The related work as investigated so far is insufficient to be conclusive.
Formation, crystalline phase, and morphology evolution of final products. O represents orthorhombic phase, T represents tetragonal phase, and C represents cubic phase.

C. Optical properties
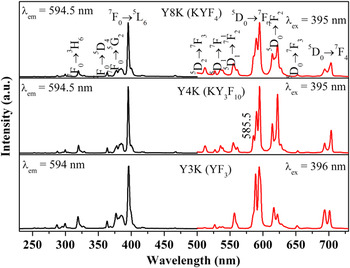
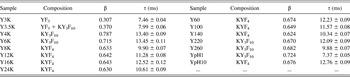
Figure 7 shows some representative PL excitation and emission spectra of the 1 mol% Eu3+-doped Y3K (YF3), Y4K (KY3F10), and Y8K (KYF4). In the three samples, the excitation spectra (the black line in the left part of the figure) are similar which are all consistent with respect to the characteristic excitation lines of Eu3+ within its 4f Reference Menyuk, Dwight and Pierce6 configuration from 230 to 500 nm. For example, in sample Y8K (KYF4), the excitation peaks can be clearly assigned from the ground state 7F0 to different excited states: 5H6 (320 nm), 5D4 (363 nm), 5G2 (384 nm), and 5L6 (395 nm) which is the strongest one, including those weak ones which have little contribution to the excitation of Eu3+.Reference Deshazer and Dieke25 Excitation into the strongest 7F0 → 5L6 transition of Eu3+ at 395 or 396 nm yields the emission spectra (the red line) of 1 mol % Eu3+-doped Y3K (YF3), Y4K (KY3F10), and Y8K (KYF4) as shown in the right part of the figure, which consists of the emission lines of Eu3+ from the excited 5D0,1,2 levels to the 7FJ level. For example, in sample Y8K (KYF4), there are emission peaks at 512 nm corresponding to the 5D2 → 7F3 transition; 527, 535.5, and 554.5 (561) nm corresponding to the 5D1 → 7F0 , 7F1, and 7F2 transitions; and 590 and 594.5 nm for the 5D0 → 7F1 transition, 614 and 622 nm for the 5D0 → 7F2 transition, 652.5 nm for the 5D0 → 7F3 transition, and 693.5 and 703.5 nm for the 5D0 → 7F4 transition, respectively.Reference Yu, Lin and Fang26, Reference Tao, Wang, Yao, Cai and Li27 The emission spectra are dominated by the 5D0 → 7F1, 7F2 transitions. The 5D0 → 7F1 transition is a magnetic dipole transition and not affected much by the crystal field around Eu3+ and the 5D0 → 7F2 transition is an electric dipole transition and hypersensitive to the local environment. The asymmetric ratio (β) of the integrated intensity I(5D0 → 7F2) (604–625 nm) to that of I(5D0 → 7F1) (578–604 nm) can provide some structural information such as distortion of ligand environment and site symmetry.Reference Chen and Liu28 The β value of the sample Y8K (KYF4) is about 0.633, indicating that the Eu3+ locates at a site without inversion symmetry in the host matrix. The PL emission spectrum of the sample Y4K (KY3F10) is some different from that of KYF4. The splits of the transitions, such as 5D0 → 7F1, 5D0 → 7F2, 5D0 → 7F4 are different. There is a distinct peak at 585.5 nm in the emission spectrum of the sample Y4K (KY3F10). And the β values of the asymmetric ratio in the sample Y4K (KY3F10) is 0.787, which are larger than that in the sample Y8K (KYF4) meaning that the Eu3+ locates in a more asymmetric lattice site in KY3F10 than that in KYF4. The emission spectrum of YF3 (Y3K) is also different from that of KY3F10 or KYF4. The β value in the sample YF3 (Y3K) is only 0.307, suggesting that the Eu3+ locates in a most symmetric lattice site in the three samples. For clarity, the samples and the corresponding asymmetric ratio β values are listed in Table I. The β values of the different KYF4 samples or the different KY3F10 samples change slightly, which is partly caused by the crystalline size of the particles in the samples.
PL excitation and emission spectra of samples Y3K (YF3), Y4K (KY3F10), and Y8K (KYF4).

Asymmetric ratio β values and lifetimes of 5D0 → 7F1 transition [λex = 395 nm, λem = 594.5 nm except Y3K (λex = 396 nm, λem = 594 nm) and Y3.5K (λex = 396 nm, λem= 594 nm)] of samples.

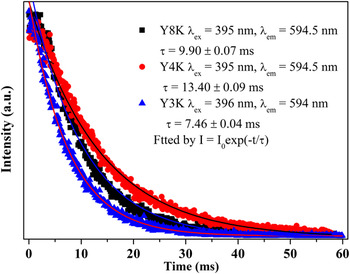
Figure 8 displays the representative luminescent dynamic decay curves monitoring at the 5D0 → 7F1 transition of Eu3+ in samples Y3K (YF3), Y4K (KY3F10), and Y8K (KYF4). The decay curves can be well fitted by a single exponential function as I(t) = I 0 exp(−t/τ), where I 0 is the initial emission intensity at t = 0, τ is the 1/e lifetime of the 5D0 level of Eu3+. The lifetime in the YF3 (Y3K) sample is 7.46 ± 0.04 ms, which is much shorter than that in the KY3F10 (Y4K, τ = 13.40 ± 0.09 ms) sample or the KYF4 (Y8K, τ = 9.90 ± 0.07 ms) sample. The deduced lifetimes of the 5D0 level of Eu3+ are also listed in Table I. When Eu3+ locates in a more symmetric lattice site, the 5D0 level of the Eu3+ has a shorter lifetime. On the contrary, the 5D0 level of the Eu3+ has a longer lifetime when it locates in a more asymmetric lattice site. There is an exception that is the sample YpH1 (KY3F10). In the sample, the Eu3+ locates in a more asymmetric lattice site but the 5D0 level of the Eu3+ has a shorter lifetime which is 7.37 ± 0.05 ms. As discussed in the foregoing, the KY3F10 presents a larger size in the particles and crystallizes well, meaning low nonradiative rate, which finally results in a shorter lifetime of the D0 level of the Eu3+ in the sample.
Decay curves monitoring at 5D0 → 7F1 transition of Eu3+ in samples Y3K (YF3), Y4K (KY3F10), and Y8K (KYF4).

IV. CONCLUSIONS
In conclusion, a series of KF–YF3 system materials have been synthesized through a PEG-assisted hydrothermal method. With the increase of the reactant ratios of KF:RE3+, the final products evolve from the orthorhombic phase of YF3 to the tetragonal phase of KY3F10 to the cubic phase of KYF4 finally. With the increase of the hydrothermal temperatures, the final products evolve from the cubic phase of KYF4 to the tetragonal phase of KY3F10. With the increase of the pH values of the prepared solutions, the final products inversely evolve from the tetragonal phase of KY3F10 into the cubic phase of KYF4. The XRD patterns, the FE-SEM images, and the EDS pattern of the samples suggest the phase evolution of the samples. The PL spectra and the luminescent decay curves of the doping Eu3+ also prove the phase evolution of the final products. The synthesis, the phase evolution, and the optical properties of Eu3+-doped KF–YF3 materials can be extended to study the other KF–REF3 system materials.
ACKNOWLEDGMENTS
This research was supported by Basic Science Research Program through the National Research Foundation of Korea (NRF) funded by the Ministry of Education, Science and Technology (No. 2010-0022540) and also this research was supported by NCRC (National Core Research Center) program through the National Research Foundation of Korea funded by the Ministry of Education, Science and Technology (2010-0001–226). The first author thanks for the financial support of National Natural Science Foundation of China (Grant No. 61205217), the project of Young Excellent Doctor (JZB11001) of Jinggangshan University, and the project of the Key Subject of Atomic and Molecular Physics supported by Jiangxi Province (2011-1015), China.