1. INTRODUCTION
Time-domain simulation of dynamic systems has increased in popularity along with inexpensive computer power, simulation suites and the availability of time-domain models of complex systems. Time-domain system formulations are attractive due to the pervasiveness of specifying systems with differential equations in the time domain and the ease of implementing performance prediction, design and exploratory analysis. Time-domain simulations of ship manoeuvring have traditionally been applied in design of automatic control systems, performance prediction of ships and crew training. As the capabilities of computer hardware and simulation software have increased, application of Monte-Carlo style analysis has become feasible in risk analysis of ship manoeuvring and traffic patterns. Synthetic simulation studies are attractive and sometimes necessary as they allow low-cost investigation of system dynamics and offer a way to explore the effects of planned changes to systems and the environment.
Probabilistic safety assessment as a frequency domain application is limited to static operating conditions or to a predefined sequence of events. But ship manoeuvring is a process where the evolution of the ship's trajectory is highly dependent on the actions on the bridge and the environment; conversely the position and orientation of the ship can necessitate a set of actions required from the bridge crew. The dynamics of ship manoeuvring from the effect of control and environmental forces is modelled based on “first principles” understanding of mechanics in the time-domain. This formulation has been applied to generate data for frequency domain analysis. Such application of time-domain simulation of ship manoeuvring can be separated into real-time and fast-time studies, while the purpose of both is to derive a quantitative description of the risk, either by direct estimation from simulation results, or by expert opinion based on experiences from the simulation studies.
Simulator training of crew is a special case of real-time simulations where the aim is to expose and train the operators for new operations and rarely encountered situations. These simulations are employed in exploratory analysis where the performance or perception of the human operator is of primary importance. Examples of such studies include assessment of the effect of changes to the fairway (Hutchison, Reference Hutchison, Gray and Mathai2003) and measurement of crew response times (Chen and Moan, Reference Chen and Moan2004). The drawback of real-time simulation studies is inherent in its name; simulations progress with the speed of the wall-clock, crew and simulator facilities are a limited resource and the effort required to undertake extensive studies is considerable. This has led to the application of fast-time simulators (Hutchison, Reference Hutchison, Gray and Mathai2003) where the human element is replaced by a combination of navigation and control algorithms. This substitution enables the time-compression of the simulation to be increased to the upper attainable limit for the combination of computer power and model complexity. This allows fast-time simulations to serve either as an inexpensive screening process for real-time simulation studies, or as an inexpensive desktop simulator experiment. While the numbers of accidents and lost vessels are stable or showing a slight decrease (Soares and Teixeria, Reference Soares and Teixeria2001), there has been a profound shift in the attribution of the root causes of accidents towards human actions, either as an isolated element on the bridge, or as a part of the wider socio-technological system that designs, builds and operates the ship (Hollnagel, Reference Hollnagel1998). There are numerous models for human performance ranging from simple time response models to models of human cognition and elaborate information processing models. This plethora of models illustrates both the increased focus on the human element and the ambiguity of resulting description where multiple models describe the same process. While a large effort has been expended in the area, recent developments show their strength as explanatory tools for use in psychology or retrospective analysis, but possess limited predictive powers. This situation presents a dichotomy in the use of fast-time simulation in risk analysis where the simplifications necessary to exploit the advances in dynamic system models and computer power, also remove the element most prone to errors and deficiencies. This situation persists since the integration of contemporary models of human operators is hindered by the heterogeneous model structures and lack of predictive ability. This results in simulations of systems that conform to the behaviour of computer controlled systems and that lack a representation of the dynamics and structural composition of the human element. It is evident that analysis of dynamic systems without considering the human element only answers questions of the system's technical abilities, not its actual performance and mode of operation of non-autonomous systems.
In this paper we will combine a human reliability model and time-domain simulations of ship manoeuvring and show how this approach can be implemented, and in turn simulated, to form a dynamic model that shares both the traits of the human operator and the dynamics of the vessel.
2. SYSTEM DESCRIPTION
Construction of system models for prediction and design verification is an integral part of engineering disciplines. The increase in available computer power has been crucial for simulations, training simulators and increasingly realistic simulations available in computer games. Whereas training simulators and computer games are constructed to interact with a human operator, Monte-Carlo style studies contain an implicit model for the human element.
2.1. Vessel dynamics and autopilot systems
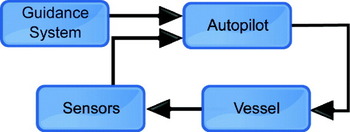
Ship manoeuvring simulations rely on two theoretical fields: hydrodynamics and automatic control. Hydrodynamics describes the dynamic behaviour of structures in water under the effect of waves and current, while automatic control provides guidance and suitable inputs to make the vessel fulfil a manoeuvring objective, be it station keeping or trajectory tracking. Models for ship dynamics with scale models can be found in (Fossen, Reference Fossen2005), (Norrbin, Reference Norrbin1971) and (Perez and Blanke, Reference Pérez and Blanke2002). The equations of motions of the vessel are formulated as a set of first order differential equations. A typical system structure is seen in Figure 1, the formulation of the autopilot subsystem proceeds in a fashion where the combined system of the autopilot and vessel achieves reference tracking from the guidance system while repressing disturbances from the environment. The guidance system provides a reference-desired state to the autopilot which compares it to the actual state of the system and devises an appropriate response. A classical structure for an autopilot is the Proportional-Integration-Derivative (PID) control which stabilizes the system by a suitable mapping from the difference in the system state versus the desired state, the rate of change and the accumulated error to the system's control inputs. The PID formulation has been used successfully to design autopilots and to investigate the dynamic response of ships and has additionally been applied in risk analysis and fairway design studies (Hutchison, Reference Hutchison, Gray and Mathai2003). However this structure only accurately depicts the process of autopilot control and neglects the underlying method of ship manoeuvring where the human operator and automatic control forms a joint system, while automatic control is a necessity in fast-time simulations as it provides the mechanisms to control the dynamic system in place of the human operator. The direct and exclusive application of automatic control as a substitute for the human element lends little support to the final results as the element most prone to errors has been replaced.
Ship manoeuvring in the context of automatic control.

2.2. The bridge as a man-machine interface
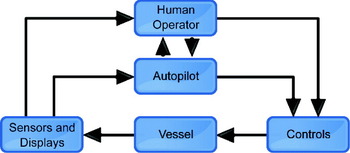
Studies of human performance and automatic control of engineering systems emerged when the performance demands and technical abilities increased beyond the capabilities of the human operator. The last 50 years have seen a dramatic increase in the complexity of power plants and transportation systems such as aircraft and ships. Ships have increased in size, speed and gained new propulsion and position control devices in conjunction with a trend of increasing automation, with a system configuration where the human operator occupies a supervisory role as seen in the joint system of Figure 2. The two main components in the system are the skills of, and the availability of plans and procedures to, the human operator. Both elements must be represented in order to construct a system model with exploratory power for analysis by simulation.
Ship manoeuvring as a joint cognitive, supervisory control model. The structure of the joint cognitive system is presented in (Hollnagel, Reference Hollnagel1998).

2.2.1. Joint cognitive systems
Neglecting fully autonomous vessels, ship manoeuvring involves the human element in the control loop. The human element appears engaged in manual control, but the operation of modern ships is accurately described as a joint system with the operator in a supervisory role. This system structure reflects the trend of increasing automation in transportation systems with the human operator responsible for high level planning and outcome with the automation system responsible for low-level operation. A typical example of the structure of such a system is depicted in Figure 2, which is an adaptation of the structure presented in (Hollnagel, Reference Hollnagel1998). This formulation poses a problem for use in manoeuvring simulations as the human operator will appear in the simulation loop leaving two options:
• Devise a suitable model for human performance.
• Use an actual human operator in the simulation loop and lower the time-compression to real-time.
Leaving the human element intact results in an expensive method which fails to take advantage of the possible time savings from an autonomous simulation, but autonomous simulations must include a model better suited to represent the operator than direct application of automatic control. The available models for the human operator originate in risk analysis, human reliability analysis and psychology and have not only inhomogeneous structures but also differ in system boundaries, a situation that impedes the exchange of ideas and theories between the disciplines.
2.2.2. The human operator
Developments of models of the human element have been motivated by the needs for more knowledge about reasoning and the cognitive interaction with the environment and the need to include human operators in operational analysis. The models from these two areas of study differ in their orientation in the time domain, analysis of the human brain proceeds backwards in time in order to explain “why” and “how” something happened while systems analysis is directed forward in time to explain “when” and “how often” something will happen (Hollnagel, Reference Hollnagel1998). The underlying model of human reliability varies from simple frequency of failure models (no underlying model of the human operator) to models with elaborate explanation of the underlying mental structure (over modelling of the human operator). The nature of human reliability analysis is that of indirect analysis by inferring mental activities and reasoning hidden from direct observation and places them into a cause-and-effect relationship with the observable result. Thus intentions behind, and causes of, the variation in human performance remain in the covert realm of the mind, while the resulting actions, intended or unintended are overt and possible to observe. One of the most influential models of the human operator has been Rasmussen's Skill-Rule-Knowledge (SRK) framework which divides the possible performance modes of the operator into three categories corresponding to level of familiarity and training:
• Skill: High level of familiarity, automatic translation of situation to actions
• Rule: Familiar procedures available, selection of the right procedure for execution
• Knowledge: Low level of familiarity, situation analysis required with formulation and selection of procedures
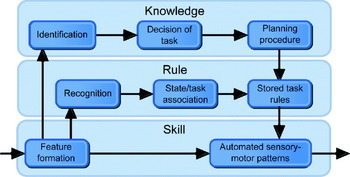
The SRK framework provides an information-processing model of the human operator with a step-ladder model that represents the flow of information between the different cognitive activities. The different levels of familiarity with the situation are represented by horizontal short cuts in the stepladder model bypassing higher cognitive functions. The internal processes involved in the different processing stages are seen in Figure 3. The one feature in models for human performance that is consistent across models is the importance of procedures and training. This is explicitly formulated as the cornerstone in the Skill-Rule-Knowledge framework of Rasmussen, a similar construct appears in both the HCR (Hannaman and Worledge, Reference Hannaman and Worledge1988) (different response times) and CREAM (Hollnagel, Reference Hollnagel1998) (different modes of control) methods. The development of simple success/failure system components to cognitive models has provided an explanatory model for the intentions behind the actions, but it is impossible to derive a realization due to the unknown ordering of the cognitive functions forward in time. The model for human cognition/performance that provides an internal structure to the cognitive process serves as a frame of reference for discussion and retrospective analysis and not a definitive description of the covert processes of the human operator. With a system model formulated in the time domain, a model for human performance that provides the frequency of success/failure is of little use if one attempts to answer questions like “how will the spread of traffic be if influenced by environment and variations in human performance” as the timing of actions are paramount when the system is formulated in the time domain. A model in the time domain should be able to represent the infinitely large sets of possible outcomes that are achievable by the simple timing of actions.
The step-ladder model of human cognition implied by the skill-rule-knowledge framework of Rasmussen, as presented in (Hollnagel, Reference Hollnagel1998).

2.2.3. Navigation
The foremost process with a significant human contribution on a ship is navigation. The process itself is a demonstration of the interconnection of planning and execution. Navigation as the process of deciding the appropriate set of actions to arrive at a specific destination consists of several separate sub-processes. The theoretical model of navigation and way-finding as presented in (Chen and Stanney, Reference Chen and Stanney1999) has been applied as a structural framework for performance analysis of bridge crews during navigation and ship manoeuvring (Gould et al, Reference Gould, Røed, Saus, Koefoed, Bridger and Moen2009). The model separates the processes required for successful navigation into three layers:
1) Cognitive mapping, internalized representation of the environment.
2) Decision-making process, evaluation of the environment and the formulation of strategies and plans required to arrive at the destination.
3) Decision-execution process, translation of the navigational plan into decisions and actions.
In transportation systems, such as ships and aircraft, the actions or strategies used are determined by the capabilities of the operator in conjunction with the available support systems of the vehicle. Transportation systems where the capabilities surpass those of the operator apply the notion of basic manoeuvres that can be combined into a navigational plan. The operator is trained in the execution of these manoeuvres and this representation is desired instead of an ad-hoc approach and provides a firm structure for activities such as planning, training and execution. In the context of sea transportation, ship masters and pilots develop a familiarity with the environment during their certification procedure for a particular area. Navigational plans for the area are also developed as a part of the certification procedure (Lützhöft and Nyce, Reference Lützhöft and Nyce2006). The internalized representation and plan formulation is assumed to be completed or derived from other sources, leaving the decision execution process for the human operator in the joint cognitive system.
2.3. An on-line human operator model for autonomous simulation
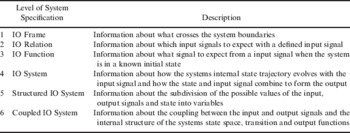
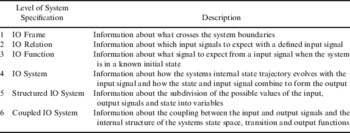
The framework for modelling and simulation presented in (Zeigler et al, Reference Zeigler, Praehoffer and Kim2000) is used as a frame of reference when formulation of systems and components are discussed. The framework provides a tiered system which describes an increasing knowledge of system outputs in response to inputs and internal state transitions in the levels of system specification. The level of system specification is described in Table 1 where the amount of information available increases in the top-down direction. The relation between this framework and mathematical modelling of dynamic systems can be seen in the two different approaches to systems modelling, first principles and system identification. System identification techniques use knowledge or measurements of the input and output signals of a system to determine a system with an a-priori known system structure that exhibits the same dynamics in response to the input signal; this procedure places the system model at the level of the IO-relation level. The addition of an initial state establishes a one-to-one mapping between inputs and outputs and shows replicative ability and at the IO-function level. Models based on first-principle are formulated from a position of increased knowledge, particularly the response of system states to input signals. These formulations are at the structured IO system level where the permissible values of the state, input and output functions are known as well as how these contribute to the overall behaviour of the system. It follows directly that a modular model of differential equations with coupling from input to output shows a system at the coupled IO system level. A system on the IO system level is fully specified by:
• T is the time base
• X is the set of all permissible input values
• Y is the set of all permissible output values
• ω⊆Ω is the set of all permissible input signals
• Q is the set of states in the system
• Δ:Q×ω→Q is the state transition function
• Λ:Q→Y is the output mapping function
An additional system theoretical element from (Zeigler et al, Reference Zeigler, Praehoffer and Kim2000) is the morphism and homomorphism concept, which describe the similarity between systems and establishes a set of conditions to check if a simplified (small) system is a valid derivation of a complex (big) system. The morphism is used to establish the validity of simplified models in relation to complicated base systems and models as well as ensuring the correct representation of the model by a simulator algorithm. A morphism between a small system S′ and the big system S is a set of functions g, h and k such that:
• g: Ω′→Ω encodes the permissible signals ω∊Ω of the small system into the signals ω∊Ω permissible in the big system
• h:Q→ ontoQ′ where
 , h maps the subset of the big state set Q onto the small state set Q′
• k:Y→ ontoY′ maps the output values Y of S onto Y′ of S′ for all q⊆Q and Ωω′∊Ω.
 , h maps the subset
 of the big state set Q onto the small state set Q′
The morphisms between two systems must conform to the following two criteria:
• Transition function preservation: h(Δ(q,g(ω′)))=Δ′(h(q),ω′), a mapping of the state Q→ ontoQ′ where the big system receives an encoded ω=g(ω′) and undergoes a state transition Δ(q,g(ω′)) is equal to the same transition in the small system Δ′(h(q),ω′) with a state q′=h(q)
• Output function preservation: k(Λ(q))=Λ′(h(q)), a mapping of the output of the big system Λ(q) is equal to the output of the small system Λ′(q′) with a state q′=h(q)
The morphism concept has practical implications for derivation of models from detailed base systems and further simplification of existing models as it imposes requirements on the derivation or simplifications of state space, transitions, admissible inputs and output behaviour:
• The mapping of the state space between S and S′ ensures that an aggregation or simplification of the state space still retains some of the original structure and explanatory power
• The transition function preservation ensures that some of the behaviour in S is found in S′. S′ cannot undergo state transitions that are not evident in S, but does not necessarily have to reflect all the state transitions possible in S
• That there is a correspondence between input signals and behaviour of the two systems. The system S′ cannot accept inputs that are incompatible with the system S.
• If both systems receive corresponding input signals, they both undergo a state transition and the resulting output must also be in correspondence. The internal behaviour of S′ must be uniquely mapped into the output of S. The converse is not true as the output of S′ can represent a set of internal behaviours in S.
It is straightforward to show that the ship dynamics coupled with models for the response of steering machinery and the effect of lifting surfaces as presented in (Norrbin, Reference Norrbin1971) is an example of a morphism between an infinitely complex real-system to a small system of selected physical variables. The real system has a larger state-space, but the identification of the simplified system parameters ensures that the system description fulfil the transition and output function preservation properties. A similar argument can be presented for different formulations of the manoeuvring problem. There is no corresponding argument for the relationship between the human operator and the model, as there is no model that is neither verified (consistent predictions) nor validated (predictive powers outside the base case). The system theoretical knowledge of the human operator is confined to levels 1 to 3 in Table 1, which implies that we can only hope to describe the system boundaries and at most arrive at a one-to-one correspondence between observed system inputs and outputs at the functional level.
The hierarchy of system specifications outlining the available information and what can be represented in a simulation.
3. A TIME DOMAIN REPRESENTATION OF THE HUMAN ELEMENT
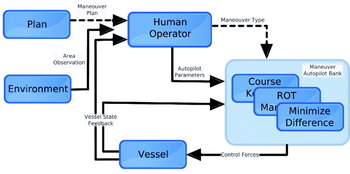
The learning process for pilots manoeuvring in confined waters described in (Lützhöft and Nyce, Reference Lützhöft and Nyce2006) shows great care taken to establish a manoeuvre plan consisting of individual manoeuvres with transition points defined by available navigational markers. Passage plans are described as constant course sections connected by transition on circle sections. The locations of prominent features and navigational markings in the area are used to estimate the location of the vessel in relation to the transition points. The plan relies on a set of clearly defined manoeuvre types utilized in restricted waters to control the future position and orientation of the vessel. This structure is utilized in the derivation of the human operator model with separation of planning as a static input to observation/decision and execution. Further decoupling of the decision and observation from the execution of the manoeuvre is possible by assuming that the operator is well trained in the manoeuvre set and thus will select the correct control strategy for each manoeuvre. The operator influences the vessel trajectory by deciding when the conditions to advance the plan are fulfilled by executing the next manoeuvre. (See Figure 4.) The internal structure of the implementation of the human operator model must not be confused with the structural validity presented in Section 2.3 since it is result of a formulation that suits the technical implementation.
Guidance and navigation system configuration. The planning process is represented by a fixed plan of passage that references manoeuvre types. The transition between manoeuvres is controlled by the human element that observes the vessels relative position in the area and activates the corresponding autopilot with the proper set of parameters.

3.1. Observation-decision-response model
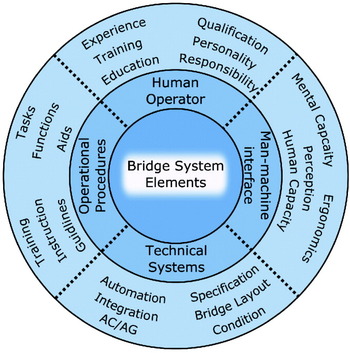
The challenge when attempting to represent the human operator is to derive a coherent model for his actions even though there is a lack of understanding about the underlying mechanisms and causal relationships. The actions of others are observable and offer the only glimpse of the underlying mechanisms from individual introspection. This level of knowledge in the context of the levels of system specification from (Zeigler et al, Reference Zeigler, Praehoffer and Kim2000) presented in Table 1 is at the IO-relation level. This is at the IO-relation level since it is possible to observe a variation of responses to the same input signals which are recognized as an inherent feature of human performance. Time domain simulations frequently rely on simplified models for the system response due to hydrodynamic, structural and environmental forces derived from detailed base models, or identified from experiments. It is impossible to construct and validate a simplified time domain model by a (homo)morphic relation to a detailed base model for the human operator due to the absence of first-principles theories for human performance or even detailed empirical models. Instead of establishing a morphism relationship at a high level, the current state of knowledge leaves the option of constructing a lower level morphism and then attempt to build from theory or experiments a system specification at a higher level. Since the coupling with the ship dynamics and environment is specified the admissible variables and the system boundaries are known and are at the structured IO-frame level. It would be impractical to attempt to account for all the possible interactions between the experimental frame (interacting system, in this case the environment and other vessels) and the possible interactions between the human operators on the bridge of the vessel. Such an attempt will inevitably lead to either an over-modelled complex system or a failure to capture all the possible interactions. The system boundaries for the human element are extended from the individual operator to the entire bridge including navigation equipment, autopilots and human operators. The focus is shifted from deriving the mode of the individual operator to a model which describes the interaction between the total bridge system (the operators, technical equipment, training and man-machine interface) and the mechanical properties of the vessel and environment.
The total system is depicted in Figure 5 and defines the areas encapsulated by the operator model. A model for the human operator which includes interaction between the individual operators, the possible interactions between operators, vessel systems and other vessels will quickly grow to an unmanageable size. This reduced representation leaves a well-defined system component interacting with the vessel and environment through observations, visual and electronic, of objects in the area and the state of the vessel & environment. The bridge system manipulates the vessel by changing the settings of the propulsion and control systems either by automatic or manual control. This results in the well-defined structured IO-frame:
• T is the time base T={t∊R, t>t0}
• X is the input set X={External Objects, Vessel State, Environment State}
• Y is the output set Y={Rudder Commands, Engine Commands}
This choice of system boundaries represents a simplification as it eliminates the possibility of studying the individual and is thus only capable of producing a result as an aggregation of the underlying process. The presence of an initial state is needed to elevate the description of the bridge and human element to the level of the IO-function which provides an untangling of the one-to-many into a one-to-one description of system inputs vs. outputs. The selected system boundaries reduce the external manifestation of the vessels bridge activity to the time-to-action in comparison to an ideal case where the correct actions are executed at the precise time where they are required. In real conditions there is a variation in the timing of an action in the continuum “too-early” – “too-late”. In the case of ship manoeuvring the strategy changes as the vessel traverses the plan of passage in the form of a sequence of manoeuvres. The transitions between the manoeuvres are determined by the vessel's relative position in the environment and the human operator's perception of this relation. The variability in human performance, environmental conditions and technological aids influence the accuracy in this judgment. An experienced and well trained captain will have an accurate perception of the vessel's relative position by combining reference systems and personal observations with experience, while a novice, or master unfamiliar with the area, may focus on a particular reference signal and misjudge or require time to confirm the position according to the passage plan (Findlay, Reference Findlay2006).
Schematic representation of the complete bridge system. The systems on the bridge are conceptually divided into groups representing the technical systems, the human capabilities, training and man-machine interface. The combination and interaction between these systems form the total system one can identify by thorough analysis a vessel bridge.

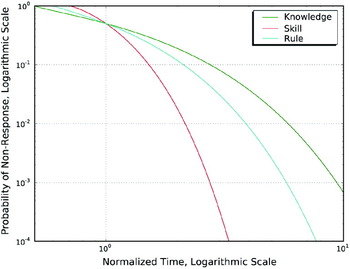
The time response curves applicable to the SRK framework from (Hannaman and Worledge, Reference Hannaman and Worledge1988) represent the effect of familiarity with the situation on the response time on the bridge in the time domain. From the SRK framework this corresponds to the different levels of cognitive processing required to formulate a response to an observation. The response curves are based on simulator experiments with human operators and are provided as a set of three parameter Weibull distributions for the response time. A logarithmic plot of the non-response probability (1− Presponse) is shown in Figure 6. The response time is normalized by the median response time of the crew and the non-response probability is as seen in Equation 1 where t is the time available,  is the median response time while βi, Cγi and Cηi are the shape, location and scale parameter of the three parameter Weibull distribution for cognitive processing modes i ={skill, rule, knowledge}
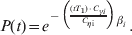
Operator time response probability curves form (Hannaman and Worledge, Reference Hannaman and Worledge1988) with increasing response time with increasing cognitive demands. Response time is normalized with the median response time T1/2.

A description on the IO-Function level is achieved by adopting a time-shifting mechanism for the transition between manoeuvres based on the response time formulation of (Hannaman and Worledge, Reference Hannaman and Worledge1988). The familiarity with the situation as skill, rule or knowledge together with a probability level serves as initial states to produce a one-to-one relationship between input and output signals in the form of different activation times of manoeuvres in response to the same observations. By first defining the auxiliary time-shift function Ftimeshift: P, i→ T with P as the selected probability level and i as the response mode and the TESTPLAN: T, X, j→ T function to test the ideal transition time with regard to the manoeuvre plan.

It is evident that the time-shift function is the result of a state transition in the operator. This transition conforms to the conditions in Section 2.3 as the prescribed model of sequential manoeuvres necessitates the transition. It is therefore impossible for this formulation to undergo state transitions not in the detailed navigation model. In addition to the transition time, we must define the function MANEUVERPARAM: j→ Y, which provides the manoeuvre parameters of manoeuvre no j in the plan and the IO-function relation then becomes:

The model of the total bridge system receives a stream of observations of the area and activates transitions between manoeuvres when the orientation of the ship fulfils the conditions of the manoeuvre plan. The functional relationship between the fulfilment of the manoeuvre plan transition conditions and the response time completes the description of the human element with a delay action. The response of this system component is simply the activation of the next item in the manoeuvre plan.
3.2. Plan and rules for navigation
The navigational plan is represented as a nested binary list of basic manoeuvres. The structure allows for a branching pattern of manoeuvres, such as emergency manoeuvres or a cancellation path for the ship during the progression through the list. Each manoeuvre definition in the list contains:
• A manoeuvre type identifier, a set of parameters for the unique manoeuvre and specific observation conditions such as geometric parameters and anticipation of own ships future position by extrapolation
• A set of conditions directly related to the navigation area that specifies the conditions which the position of the ship must fulfil in order to progress to the next manoeuvre in the list.
The manoeuvre plans can be elicited from expert opinion or estimated from available ship traffic data such as in (Aarsæther and Moan, Reference Aarsæther and Moan2009). The manoeuvres are executed in a context and the manoeuvre plan therefore refers explicitly to the available navigational markings of an area. The manoeuvre plan must be specified in relation to these navigational markings to be capable of acting as a plan for the IO-frame relation described in Section 3.1.
3.3. Execution
Execution is the action from either the autopilot or the operator to translate the intention of a particular manoeuvre into commands to low-level control and machinery systems. The separation of planning, observation and decision from execution allows classic automatic control theory to be used to represent the execution of basic manoeuvres. The execution appears as commands to the underlying systems. With the selected system boundary the combination of autopilots and human operators on the bridge is anonymous with respect to the rest of the vessel. A list of specialized autopilots is used to represent the change in manoeuvre strategy in the progression through the list of planned manoeuvres. This formulation is extensible as it allows additional manoeuvre behaviours to be added later. The list of implemented manoeuvres for the autopilot is as follows;
• Course keeping, track a specific course to make the vessel follow a straight line.
• Elliptic turn manoeuvre, turn manoeuvre with control of the future track of the vessel which regulates the speed/rate-of-turn relationship to the curvature of an ellipse. Ellipse can represent a perfect circle, or a deformed circle (ellipse) due to cross-track offset of the vessel at the turn initiation point.
• Pass between two markers in the area, regulates the vessel to a imaginary line running perpendicular to the line joining two navigational targets in an area.
• Minimize difference between the apparent courses of two markers, regulates the vessel to an imaginary line that passes through two navigational targets. This manoeuvre emulates navigating after leading lights.
All autopilots are implemented as regular PID controls with suitable reference signals generated by associated guidance algorithms. The transition point between manoeuvres is located according to the geometric specification of the manoeuvre plan, but the dynamic behaviour of a vessel necessitates an earlier transition to allow the vessel enough time to either start turning or transition back to a static course. The distance from the ideal transition point in the manoeuvre and the actual transition point should be based on the dynamics of the vessel. The standard measure “advance” of the IMO turning circle manoeuvre is used to calculate the vessel transition point in relation to the ideal transition point. The individual vessel initiation point is placed a distance d=advance− Rturn in front of the ideal transition point. The effect is achieved in the human operator implementation by introducing anticipation in the form of observing the environment at a position d[m] in front of the ship.
4. RESULTS
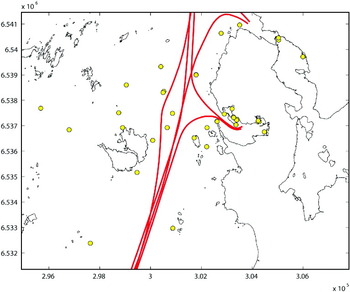
The proposed model was implemented in Simulink as a block diagram together with the dynamic manoeuvring model for tankers from (Van Berlekom and Goddard, 1974). The model was complemented by a simple realization of wind forces for tanker ship profiles by applying the simple wind force formulation for a given wind speed and direction form (Aage, Reference Aage1971). The overall system configuration was identical to Figure 4 with the addition of wind forces acting on the model. The manoeuvre area selected, motivated by convenience, was the same area used in (Aarsæther and Moan, Reference Aarsæther and Moan2009). The available navigational markings in the area were provided in machine readable form by the hydrographic service of the Norwegian Mapping Authority with position, name and type available for all markers. The area with navigational markers is seen in Figure 7 with the large concentration of navigational markers in the middle of the area being a harbour.
Sample area for simulations with navigational markings indicated as circles. The main ship traffic routes in the area shown with star markers where the traffic routes change from constant course to course change sections.

4.1. Simulations
Simulation experiments were conducted to test the ability of the system formulation to demonstrate replicative ability of manoeuvre patterns in the sense of the levels of system specification represented in 2·3. This investigation is divided into a test of whether the formulation is able to successfully navigate using a manoeuvre plan formulated in relation to the area, and if it is possible to replicate the full behaviour of traffic with the proper set of initial conditions.
4.1.1. Manoeuvre plan
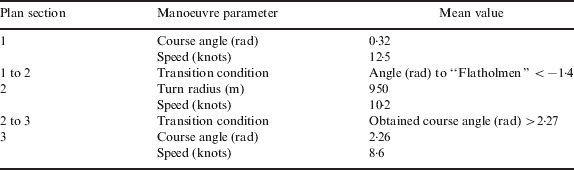
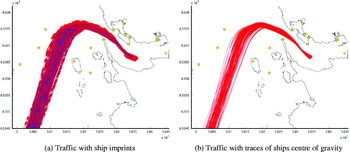
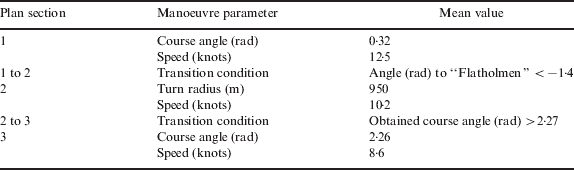
The traffic pattern in the area as observed from AIS is seen in Figure 7. The manoeuvre plans of the area and initial conditions for the simulations are obtained from analysis of AIS data and the navigational markings in the area. The analysis produces a manoeuvre plan in the form of straight course sections interconnected by circular turns together with a set of navigational markers suitable for initiation of the turn manoeuvres. The traffic entering the area from the south and proceeding into the harbour was selected as a test case. The manoeuvre plan for this traffic section is seen in Table 2. Simulations conducted to illustrate the mean or median traffic in this passage plan has no need for initial conditions and manoeuvre parameters other than the mean values presented in Table 2.
A sample manoeuvre plan as a sequence of straight course sections and circular turn manoeuvres. The plan combines objects in the area and the evolution of the ship state to formulate area dependent conditions for transition between manoeuvres. The navigational marker “Flatholmen” is located on a small island close to the ship-lane in the centre of Figure 7.
4.1.2. Traffic spread
A statistical depiction of the traffic was generated as skew-normal probability distributions. To represent the spread of the traffic, the initial conditions for position and course are drawn from the skew-normal distributions with parameters from Table 2. A varying set of initial conditions is needed to replicate the traffic patterns of the recorded data. The initial condition is a triplet of positions in north/east direction and the course. In order to replicate narrowing spread of traffic during the approach to the harbour the positions of the vessels were sampled both at the initial point and at the transition to the first turn. A random course can then be calculated from a combination of any two points in the two bands. The end result is an initial condition that fulfils both the initial spread of traffic with course, but also the narrowing of traffic during the first manoeuvre. The spread of traffic along the initial plan section is preserved by sampling both the initial position and the position at the transition to the next manoeuvre. The sampling of the two distributions was conducted by selecting a random number in the range [0, 1] (uniform distribution) and solving the corresponding value for the cross track spread from the cumulative distribution function. Cross track spread values were converted to (x, y) pairs by placing them on a vector perpendicular to the mean course line. The initial course was computed by considering the angle between the initial point and subsequent sampled transition point. This procedure maintains both the mean course angle and evolution of the traffic spread as observed in the first section of the manoeuvre plan.
4.1.3. Response time
Response times are obtained from the statistical model by the same sampling procedure as the traffic spread. The response time is assumed invariant during simulations such that subsequent decisions share the same activation time. The median response time is parameterized from the vessel length and speed and is calculated by T 1/2=Dreponse Lu with u being the ships speed, Lpp the length between main pp perpendiculars of the ship and Dresponse a fraction specifying the number of ship-lengths required for action. This formula translates between the standard navigation measures of “ship lengths” to seconds which is used in the response model. The response time for the human operator, or the activation time of the functional relationship, is then derived as the time required travelling D number of ship-lengths at the present speed. A further modification of the median response time due to the impact of man machine interface, training and situation type is deferred due to the uncertainty already introduced through the calculation of the response time.
4.2. Manoeuvre reproductions
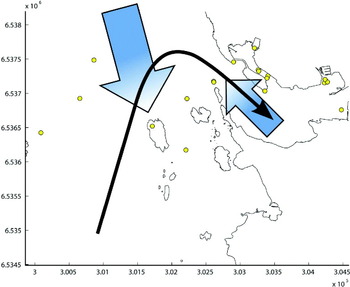
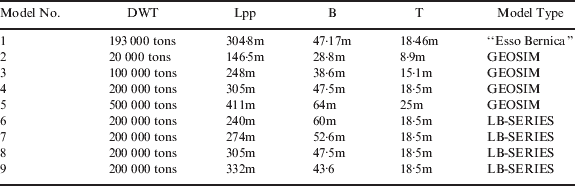
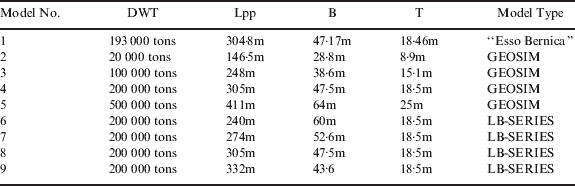
The first test of the formulation of the human element is the ability to execute manoeuvres and achieve the desired result. A dynamic model for a tanker with parameter sets for nine different vessel sizes from (Van Berlekom and Goddard, Reference Van Berlekom and Goddard1973) was used to test the manoeuvre performance of the autopilot formulation. The available parameter sets are summarized in Table 3. The model formulation from (Van Berlekom and Goddard, Reference Van Berlekom and Goddard1973) is favourable since it represents vessel dynamics as an IO-system with rudder angle and engine power is system inputs, an ideal interface to test the human element against. The area was modelled as a set of navigational markings with wind and current influencing the dynamics of the ship. The wind direction was from the north with a wind speed varying about 10m/s to represent harsh, but not severe, weather. The current was modelled as two flow fields, an outer field following the land contour with a typical current velocity form the area, and a smaller field in the narrow harbour entrance with a flow direction out of the harbour as seen with a rough indication of the manoeuvre plan in Figure 8.
Manoeuvre plan and current directions in the area, current velocity is 0·5knots, strength and direction from meteorological observations of the area. Outflow current is added to increase manoeuvre complexity.

Ship particulars for parameter sets available for the tanker model. Model No. 5 is a ULCC tanker and does not represent a ship that is encountered in the area. The ship is included in the table to summarize the complete set of parameters available, and has been used to check the autopilot procedure, but does not represent an operational case nor is it applied in simulations other than to check the ability of the autopilot formulation to control vessels.
The simulated manoeuvre plan is as follows:
• Follow a straight vessel course in the approach. Transition to next manoeuvre when the angle to “Flatholmen” is less than 80° starboard.
• Turn into the harbour with an ideal turn radius of 950m. End turn when course of own ship is more than 130°.
• Pass between the two navigational markings “Laksholmbåen” and “Tananger Lighthouse” at the harbour entrance.
• Continue toward harbour leading lights and minimize the apparent difference in course between them.
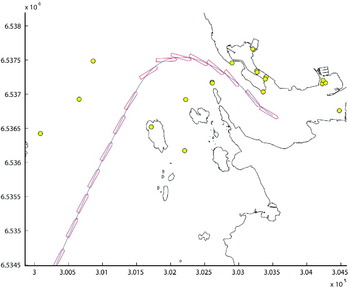
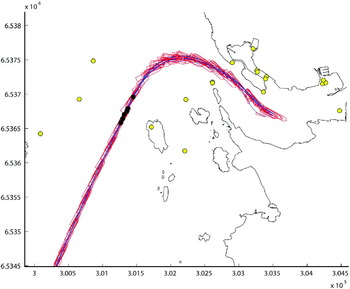
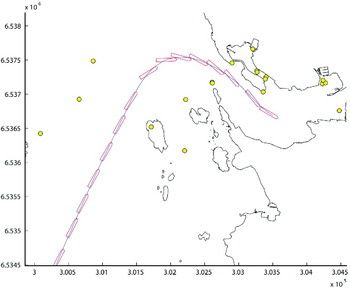
The simulated path of model No 4 in Table 3 is seen in Figure 9 with the imprint of the vessel superimposed. It is evident that the autopilot formulation is capable of manoeuvring the ship according to the manoeuvre plan in Table 2. Similar simulations for the all the parameter sets presented in Table 3 are seen in Figure 10.
Ship position and orientation during mean manoeuvre with 200 000 DWT tanker model No. 4, ship imprint is plotted with 60s interval. The true heading of the ship is not equal to heading from the centre of gravity trace in the approach due to influence from current.
Reproduction of the mean manoeuvre plan with nine different ship dynamics. Operator performance is assumed to be on the “skill” level with response time derived from Presponse, skill=0·1. The figure shows the track of the ships centre of gravity with ship imprints at approximately 60sec intervals. The wheel over point is shown as black dots on the track-line.

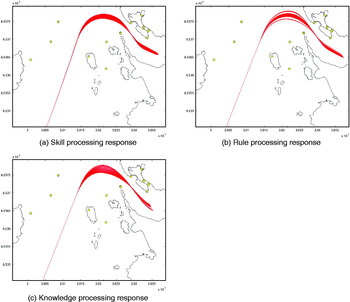
The effect of ship dynamics and variation in activation times on the mean manoeuvre of Table 2 is seen in Figure 10. The results are obtained by navigating the sample manoeuvre plan with turn initiation points derived from the plan modified by the advance parameter of the corresponding dynamic model. From the results it is evident that the dynamic of the ship contributes to the shape of the traffic, but the magnitude of this contribution is smaller than the possible variation in traffic resulting from a variation in activation time as prescribed by the SRK framework seen in Figures 11. The reproductions of traffic patterns cannot rely entirely on mean manoeuvre predictions as traffic that enters the area already exhibit a dispersed pattern. The influence of the initial condition on the traffic spread is seen in Figure 12 where the starting point of the simulation together with the course is calculated by drawing samples from the distribution estimated from the dispersed arrival pattern obtained form analysis of AIS data.
Mean manoeuvre simulation of model No. 4 (200 000 DWT) with varying response times from skill-rule-knowledge processing. The response time was derived by selecting a probability level Presponse, i=x, where i∊{skill, rule, knowledge}. The actual response time was calculated form the response curves of (Hannaman and Worledge, Reference Hannaman and Worledge1988) with x ∊ [0, 1), values of x were evenly spaced in the interval. The expected spread from variation of the response time is seen consistently increasing with the processing type.

Traffic reproduction with model No. 4 (200 000 DWT) with varying initial conditions and operator response. Operator performance is assumed to be on the “skill” level with response time derived from Presponse, skill=0·1.

5. DISCUSSION
It is crucial that the formulation of the navigational plan and the implementation of switching between individual autopilots according to the manoeuvre strategies are capable of successfully piloting the vessel models into the harbour. This property is evident in Figures 9 to 12, which show the system negotiating the harbour entrance by geometric observations of the surrounding navigational markers. The traffic patterns of the SRK framework all converge on a specific point in the harbour approach. This is due to the introduction of a rule to pass between the navigational markers at the harbour entrance. The natural spread in traffic is captured by the simulation when the variability in performance is introduced by the SRK based response functions which result in a fan-like evolution of the traffic as the response time is varied along a continuous scale. However, the spread in traffic is greatly influenced by the entry point into the area; the entry point represents the past variation in performance and origin of the vessels. The entry point and orientation must be combined with the SRK response function to fully capture the behaviour of the traffic in the area. From Figure 12 it is evident that this combination captures the observed traffic pattern in Figure 7, but lacks traffic in areas in close proximity to islands and protruding landmasses. This is believed to be due to the inability of the navigation model to capture opportunistic manoeuvring patterns of highly manoeuvrable vessels that can follow the coastline without a prescribed or intended shape of manoeuvring.
It might be possible to capture this traffic component by application of a separate navigational plan, but the single navigational plan identified from AIS by the method established in (Aarsæther and Moan, Reference Aarsæther and Moan2009) cannot be used to support an additional manoeuvre plan of this form. Another aspect of the simulation model that needs to be scrutinized is the representation of the human element. The SRK framework with response curves necessitates a reduction of the complex human element to a simple time-response component. This effectively eliminates any possibility of attributing the behaviour of the vessel past the response time. The representation of the human element appears in the causal chain as a singularity where the complex behaviour of the human element is distilled down to a single number. The man-machine interaction that in reality is taking place can be envisioned as a dynamic system with multiple actors and interactions, but the whole process is reduced to a single property in the time to respond. This reduction is irreversible and the additional information that could have been represented in the model of the human element is superfluous since the reduction to a single number renders the actual behaviours indistinguishable from each other. The simulated environment on the reverse side of the singularity only experiences the effects of the time-response system. This is analogous to the placement of the human operator model on the functional system description level where we only have enough information to reproduce the system response, not model it or derive the relationships between the components of the system. This implies that while the simulated model can represent the variation of human performance, via the time-response component, it cannot be used to make any predictions about how or why the response time is as experienced. This singularity is similar to the effect of integrating human factors analysis into classical fault tree based risk analysis techniques where the human reliability analysis is used to deliver a probability of success or failure that is subsequently treated as any other as a system component.
6. CONCLUSION
The autonomous system model with a simplified human operator model has been shown to be capable of navigating from a plan based on navigational markers as well as capable of reproducing observed manoeuvre patterns. The structure of the autopilot with a separation of planning, decision and execution was inspired by research in human performance, but based on the old stimulus-response operator models due to the lack of time-domain applicable developments in recent years. This relationship is beneficial because it provides an underlying model for the implementation but also the application of simulation theory highlights the deficiencies of operator modelling. The deficiencies of operator models are in the realm of quantitative models; recent human operator models has focused on robust quantitative models of human behaviour, whereas the quantification of effects are of uttermost importance in simulation studies.
ACKNOWLEDGMENTS
The author wishes to thank the Centre of Ships and Ocean Structures (CeSOS) at the Norwegian University of Technology and Science (NTNU) for financial support during the work on this article.