Introduction
About two-third of the Australian dairy farming system is characterised by seasonal calving, low-input, pasture-based milk production reliant on family labour. In the seasonal calving system, cows are often required to calve within a short time period (6 to 15 weeks) to take advantage of pasture growth and maximise labour efficiency. Furthermore, almost all cows are milked for about 300 days and are dried off at a pre-determined date. Recently, the seasonal calving system is being challenged due to increased herd size, increased use of bought-in feed, premium paid for off-season milk, increased milk production potential, reduced reproductive performance and pressure from animal welfare groups to minimise induced calving (Borman et al., Reference Borman, Macmillan and Fahey2004). As a result of these factors, interest in milking cows beyond the standard 305 days (over an extended lactation period) has increased and the proportion of herds that practice seasonal calving in Victoria, Australia, has decreased from 63% to 41% (Auldist et al., Reference Auldist, O’Brien, Cole, Macmillan and Grainger2007). Expected benefits of extended lactations include reduction in insemination costs and in number of days dry within the cow’s lifetime. Reduced metabolic stress and less exposure to the high-risk period around calving and increased longevity are other likely benefits (British Farm Animal Welfare Council (FAWC, 1997)). Reduced efficiency in pasture utilisation, reduced milk after the standard lactation period compared with cows that re-calve and inability of some cows to re-conceive due to heavy weight are the possible disadvantageous of extended lactation.
Extending the period between calvings beyond a specific period for farmers who are used to operating a strict seasonal calving system is a huge change in management. Besides a number of other issues, this involves deciding to delay mating of cows, assuming that they will be milked profitably beyond the standard 300 days. Variation between cows in the ability to maintain lactation after 300 days is large (Bertilsson et al., Reference Bertilsson, Berglund, Ratnayake, Svennersten-Sjaunja and Wiktorsson1997; Van Amburgh et al., Reference Van Amburgh, Galton, Bauman and Everett1997) even in countries where average milk production levels are over 9000 kg of milk. In Australia, where mean milk production varies between 4000 and 7000 kg, a large variation in ability of cows to produce milk after the standard 300 days was observed in an experimental herd (Auldist et al., Reference Auldist, O’Brien, Cole, Macmillan and Grainger2007). The risks associated with delaying mating could be high due to losses in the current and future performance of cows. The response of cows to extended lactation or delayed breeding could be influenced by their sire and the parameters that can be used to determine which cows will react beneficially to extended lactations need to be identified (FAWC, 1997).
Among other things, adopting extended lactation as a management strategy, particularly in pasture-based milk production systems, depends on using cows that are able to maintain profitable milk yield beyond 300 days. Ultimately, the identification and selection of cows most suitable for extended lactations will be useful for dairy farmers who are planning to milk their cows beyond the standard 305-day lactation. Although genetic and phenotypic relationships between part lactation within the standard 305 days of lactation are high (Wilmink, Reference Wilmink1988), such estimates for lactations from cows that are milked beyond the standard 305 days are not available. Therefore, this study analysed recent test-day data on milk production traits from Australian dairy herds that milk cows after 300 days to determine genetic and environmental relationship in the first 300 days and after 300 days of lactation. Specifically, we estimated heritability, genetic and phenotypic correlations between milk yields at different stages of lactation, including 300 to 600 days after calving. We performed these using both random regression (RR) and multi-trait models where part lactations are considered as different traits.
Materials and methods
Data
From the Australian Dairy Herd Improvement Scheme (ADHIS) database, data on daily milk-yield traits and somatic cell count (SCC) of cows that calved between 1998 and 2005 were extracted. From these, herds with at least 60 calving per year were selected. In addition, the selected herds were required to have at least 5% of their cows tested after 365 days of lactation. Based on these criteria, close to 5 million test-day milk-yield data from 587 herds were obtained. In this data set, about 17% of the tests were recorded after the standard 305 days. The number of tests, cows and daily milk and protein yield and log (natural) SCC based on the original dataset extracted for this study for Holstein Friesian (HF) and Jersey is presented in Table 1. Test day milk yield records that were between 4 and 605 days were kept for analysis. Cows that calved between 17 and 35 months of age in the first parity were selected.
Number of cows with test-day data for the first and second 300 days with mean days in milk, daily milk yield, daily protein yield and daily log SCC (somatic cell count) by breed in parity 1 and 2

†Standard deviation of the mean.
‡Mean days in milk for the stage of the lactation.
Test-day records of cows that are progeny of bulls in the artificial insemination programme were retained. From this data set, sires that had progeny in less than three herds as well as herds that used less than three sires were excluded. In addition, sires with less than six daughters in the first parity data were deleted. However, such restrictions were not applied on second parity data. To eliminate records of cows that have calved for the second time without being reported to ADHIS, cows were excluded if the highest milk yield recorded between 331 and 395 days is at least 2 kg more than the highest milk yield recorded before 121 days (early lactation). This removed about 2% of the total number of cows.
Statistical methods
To provide information on the general performance of the cows, data on Jersey and HF were used to estimate the level of milk yield, total solid yield (protein plus fat yield) and log SCC. The model for these analyses was
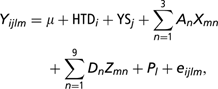
where Yijlm is the test-day observation on milk yield, protein plus fat yield or log SCC; μ is the overall mean; HTDi is the fixed effect for herd-test date i; YSj is the fixed effect for year–season of calving (two seasons each year) j; Xmn is the nth order orthogonal polynomial corresponding to age on the mth test-day; An is a fixed regression coefficient corresponding to age on the mth test-day; Zmn is the nth order orthogonal polynomial corresponding to DIM on the mth test-day; Dn is a fixed regression coefficient corresponding to days in milk on the mth test-day; Pl is the random effect for cow l to account for repeated tests within the lactation; and eijlm is the residual error variance. These analyses were performed separately for Jersey (parity 1 only) and HF (parity 1 and 2). The data used for this study are shown in Table 2.
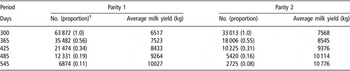
First and second parity Holstein Friesian cows that had at least 1 test-day milk record after 300 days and the number that continued milking with their milk yield in each period

†Cows with at least 300 days of lactation are considered.
The data on HF cows were used for genetic analysis to determine the genetic and environmental relationship over days in milk to 605 days of lactation. To identify an early measure of milk or protein yield that can be used to predict the ability of cows to produce after the standard 305 days of lactation, milk-yield traits early in lactation (first 5 months) were analysed with their milk yield that was produced after 300 days considering each as different trait. Test-day milk-yield traits in the first 2, first 3, first 4 and first 5 months and that after 300 days were analysed using bivariate repeatability (to account for repeated test-day records in each period) sire models based on the first parity data of HF cows.
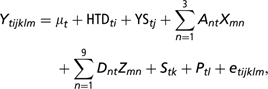
where Ytijklm refers to an observation of the tth trait (trait 1 is milk or protein yield in the first 2 or first 3 or first 4 or first 5 months and trait 2 is milk or protein yield after 300 days of lactation); Stk is the random effect for sire k and trait t; the other effects are as defined in model 1 but are fitted for each trait; etijklm is a random residual effect assumed to have the same (co)variance matrix within a stage of lactation (considered as a trait). The (co)variance structure for sire or cow effect is a symmetric matrix of size 2 (number of traits), whereas the residual is a diagonal matrix of size 2 (one for each trait).
The relationship between test-day milk or protein yield in the first 200 days (4 to 200), the second 200 days (201 to 400) and the third 200 days (401 to 605) based on the first and second parity data was estimated in a six-trait sire model analyses. The model assumed for these analyses was the same as model 2 above, except for that the number of traits was six instead of two. The (co)variance structure for sire or cow effect is a symmetric matrix of size 6, whereas the residual is a diagonal matrix of size 6. To account for possible effect of selection, second parity data of cows were used if they had test-day data in the first parity.
Finally, test-day data on milk, protein and fat yield and protein percentage and log SCC of cows that were recorded between days 4 and 540 were analysed by fitting univariate RR models, having the following general characteristics:
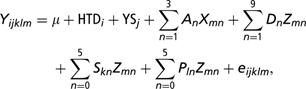
where Yijklm is the observation on milk yield, fat yield, protein yield, protein percentage or log SCC; the definitions of μ, HTDi, YSj, Xmn, An, Zmn, Dn are given in model 1 above; Skn is an additive genetic RR coefficient of Zmn for sire k; Pln is a permanent environmental RR coefficient of Zmn for cow l; and eijklm is a random residual effect assumed to have the same (homogeneous) variance within a test period (∼30 days) but allowed to vary across tests. The following co(variance) structure was assumed:
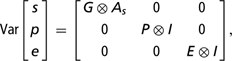
where G = sire variance–covariance matrix among additive genetic RR coefficients, As = additive numerator relationship matrix between sires and their parents, P = cow variance–covariance matrix among permanent environmental RR coefficients, E = a residual variance matrix consisting of 18 diagonals, one for each month of lactation period, I = identity matrix and ⊗ is Kronecker product.
For the RR analyses due to computational limitation, 200 herds with at least two test-days recorded after 500 days were selected. The total number of cows included in these analyses was 43 618. These cows were progeny of 1460 sires and 28 893 dams. For this analysis test-day records of cows’ that occurred between days 4 and 540 were grouped into 18 classes. The first class or test record consisted of tests that were between 4 and 30 days from calving and all the subsequent tests were of 30 days interval each. Due to software restriction in the modelling of the error variance, cows were not allowed to have more than one test record in a particular interval (∼30 days). As a result, about 6% of the records were deleted. Only 64% of the cows had valid test-day record in the first month (4 to 30 days), which increased to 80% in the second test and dropped to about 10% in the test interval 18 (511 to 540 days). The percentage of valid test-day yield records between 511 and 540 days in milk in the original data extracted for this study was 8. Over 96% of the cows had more than four valid test-day milk-yield records.
To find out whether milk yield after 300 days (300 to 605 days) is more correlated with persistency of yield in the first 300 days than with mean yield in the first 300 days, a two-step procedure was used to obtain genetic and environmental correlation among mean yield in the first 300 days (trait 1), persistency of yield in the first 300 days (trait 2), mean yield after 300 days (trait 3) and persistency of yield after 300 days (trait 4) using the first parity data. First, two traits (daily test-day milk yield in the first 300 days and daily test-day milk yield after 300 days) were formed. Then the test-day yield in each period was analysed to derive a measure of mean yield and persistency of yield for each cow by fitting the following model that consisted of permanent environmental RR coefficients for each cow:
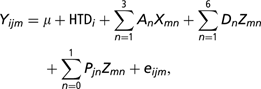
where Yijm is observation on the test-day daily milk yield in the first 300 days or after 300 days, HTDi, An, Xmn, Dn and Zmn are as defined in model 1. Pjn is a permanent environmental RR coefficient of Zmn for cow l; eijm is a random residual effect assumed to have the same variance within a test period (∼30 days) but allowed to vary across tests (a diagonal matrix of size 10). The deviation from the population mean of the jth cow is represented by a straight line whose mean or intercept is Pj 0 (intercept is taken at days 4 or 301 depending on the part of lactation considered) and whose slope is Pj 1. Thus, a positive slope Pj 1 indicates a cow whose milk yield is increasing with the stage of lactation relative to an average cow (i.e. a cow of higher than average persistency).
In the second step, solutions for each cow for mean (intercept, Pj 0) yield in the first 300 days and after 300 days, and the slope (linear, Pj 1) for yield in the first 300 days and after 300 days, were re-analysed using a four-trait sire model. In preliminary analyses, the genetic correlations between the mean (intercept) and the slopes (linear) were found to be near −0.6. The slopes were made independent of their respective means as follows: First, the genetic regression of the slope (b) on mean was calculated by dividing the genetic covariance between slope and mean by the genetic variance of the mean from the preliminary analyses for each cow. Then the product of b and mean was subtracted from the slope. The result was considered as a measure of persistency (adjusted for mean yield). The cow solutions for mean and persistency of yield after adjusting were re-analysed using the following four-trait sire model:

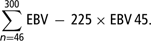
where Ytijk is the tijkth mean yield in the first 300 days, persistency of yield in the first 300 days, mean yield after 300 days and persistency of yield after 300 days for each cow; μ t is the mean for the tth trait; HYSti is the ith herd–year–season (two seasons of 6 months each) of calving effect on trait t; Stj is the jth random-sire effect on trait t; etijk is the random error term. For comparison purposes, persistency of milk yield was also calculated from the daily milk yield estimated breeding values (EBVs) from an RR model (model 3 but considering the first 300 days yield only) based on the first 300 daily milk yield for sires with 20 or more progeny as follows:
All data analyses were performed using the ASREML software (Gilmour et al., Reference Gilmour, Gogel, Cullis and Thompson2006).
Results
Lactation performance
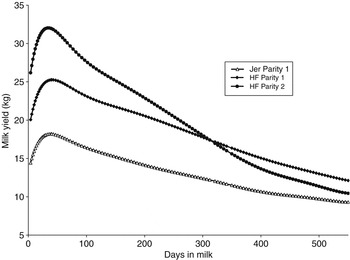
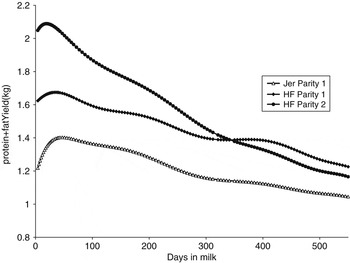
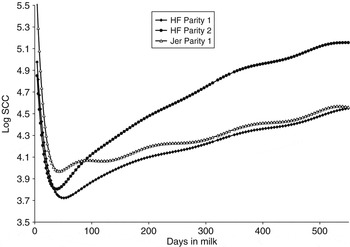
Table 1 shows the mean milk and protein yield and log SCC of HF and Jersey cows used for this study. The mean lactation length based on HF cows that had lactations longer than 300 days was 403 and 396 days in the first and second parity, respectively. The mean lactation length in Jersey cows was 392 and 384 days in the first and second parity, respectively. Table 2 shows the number and milk yield of HF first and second parity cows that were milked to 545 days of lactation. Of the cows that were milked to 300 days, the proportion that were milked after 305 days decreased consistently with the increase in lactation length. The average daily milk yield and protein plus fat yield for HF cows based on the first and second parity data and for Jersey cows based on the first parity data up to 540 days of lactation are shown in Figures 1 and 2, respectively. Peak yield in protein plus fat yield is attained earlier particularly in second parity HF cows (Figure 2) than in the first parity cows and than that in milk yield (Figure 1). Although based on a small number of cows, Figures 1 and 2 show that Jersey cows are similar to HF cows in their ability to maintain lactation beyond 305 days. Figure 3 shows that as lactation progresses beyond the 305 days up to 540 days, log SCC, particularly in the second parity HF cows, increases.
Lactation curve for milk yield of first parity Holstein Friesian (HF), second parity HF and Jersey (Jer) cows with test-day yield after 300 days of lactation.

Protein plus fat production for first parity Holstein Friesian (HF), second parity HF and Jersey (Jer) cows with test-day yield after 300 days of lactation.

Natural log somatic cell count (SCC) for first parity Holstein Friesian (HF), second parity HF and Jersey (Jer) cows with test-day data after 300 days of lactation.

Relationship between early yield and yield after 300 days of lactation
The genetic correlation between milk yield in the first 2 months and that after 300 days is reasonably high (Table 3). The genetic correlation increased from the 2nd to the 4th months, but the increase after the 4th month was small. In the case of protein yield, the genetic correlation between the first 2 months and that after 300 days was the same as that between the first 5 months and that after 300 days, indicating that protein yield is less variable (Table 3). The permanent environmental correlations are also high (Table 3); however, phenotypic correlations are lower due to the residual variance that is specific to a single stage of lactation. The heritability of milk yield increased from 0.17 to 0.2 and that for protein yield increased from 0.15 to 0.18 with the increase from 2 months to 5 months. The heritability of milk and protein yield after 300 days was 0.19 and 0.16, respectively.
Genetic, permanent environmental and phenotypic correlation between lactation in the first 5 months and that after 300 days (extended lactations) for milk and protein yield in first parity Holstein Friesian cows

†Standard errors rounded to zero.
Perm. env. = permanent environmental correlations.
Relationship between the first, second and third 200 days of lactation for first and second parity cows
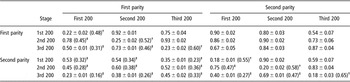
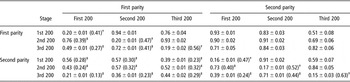
Table 4 shows that the heritability of milk yield in the first parity was slightly higher (0.25) for days in milk between 201 and 400 days than milk before or after this interval. As expected, heritability of both milk (Table 4) and protein yield (Table 5) was lower in the second parity than that in the first parity. The genetic and permanent environmental correlations between successive 200-day milk or protein yields are reasonably high (Tables 4 and 5). Genetic correlations between stages of lactation within the second parity are less than those in the first parity. Particularly, the third 200 days are less correlated with the first 200 days (0.6) in the second parity than that between the third and first 200 days (0.76) in the first lactation.
Genetic and phenotypic parameters for first and second parity of HF cows divided into three 200 days (heritability on, genetic correlation above, permanent environmental correlations below the diagonals) for milk yield

†Diagonals in parenthesis are ratios of permanent environmental variance to total variance.
‡Phenotypic correlations are below the diagonal in parenthesis.
All standard errors for permanent environmental correlations, phenotypic correlations and the ratio of permanent environmental variance to total variance below 0.01 are rounded to zero.
Genetic and phenotypic parameters for the first and second parity of HF cows divided into three 200 days (heritability on, genetic correlation above, permanent environmental correlations below the diagonals) for protein yield

†Diagonals in parenthesis are ratios of permanent environmental variance to total variance.
‡Phenotypic correlations are below the diagonal in parenthesis.
All standard errors for permanent environmental correlations, phenotypic correlations and the ratio of permanent environmental variance to total variance below 0.01 are rounded to zero.
Relationship between daily yields to 540 days of lactation from RR models
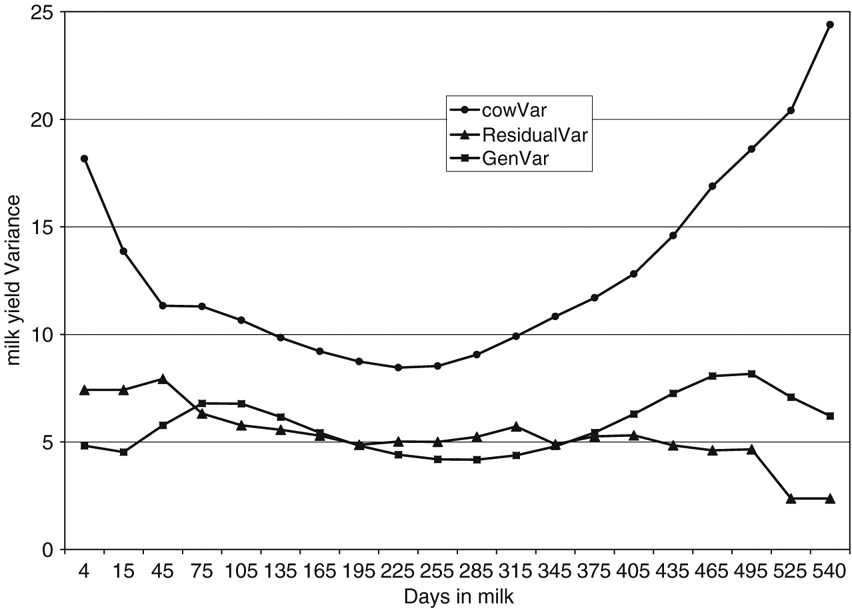
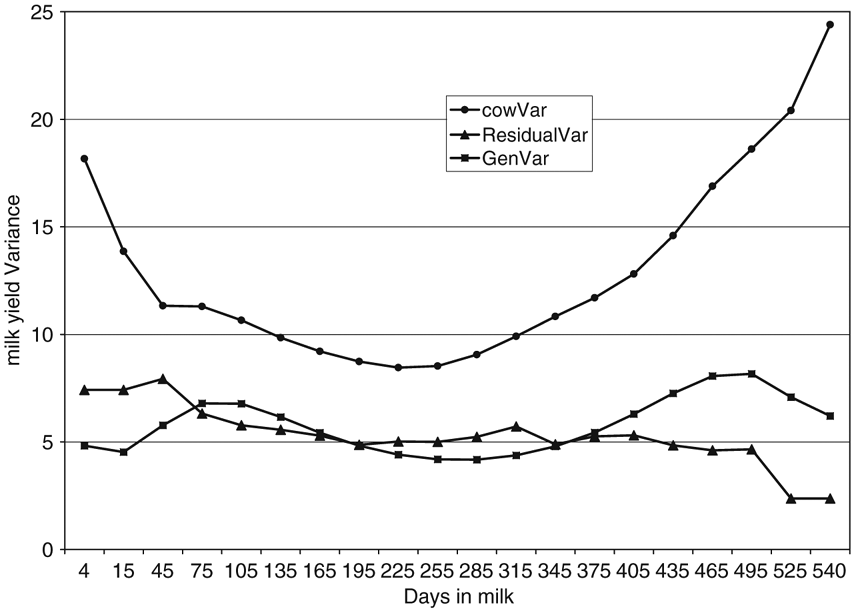
With the increase in days in milk, the permanent environmental variance decreased to about 255 days of lactation. From this point, it increased until the end of lactation (Figure 4). The residual variance was relatively high at the beginning of the lactation and declined after peak yield and remained constant until about day 500 and then declined further (Figure 4).
Permanent environmental, residual and genetic variance for milk yield over the lactation in Holstein Friesian (HF) cows.
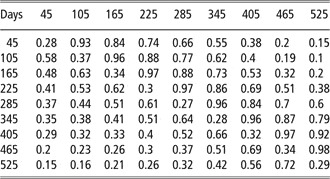
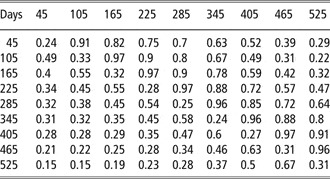
The heritability for milk yield was relatively low at the beginning of lactation and increased to as high as 0.37 by the 4th month and declined to 0.26 by the 11th month of lactation and rose again to 0.34 by the 16th month of lactation before declining by the end of the 18th month (Table 6). The genetic correlations for milk yield between the beginning and end of the lactation were as low as the phenotypic correlations (Table 6).
Genetic (above) and phenotypic (below) correlation and heritability (on the diagonal) for milk yield on selected days in the first lactation

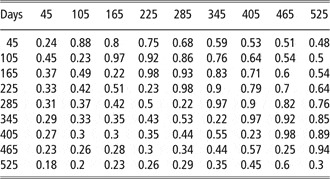
The heritability for protein yield over the 540 days was slightly lower (Table 7) than that for milk yield (Table 6). Phenotypic correlations between days for protein yield (Table 7) were similar to those for milk yield (Table 6). However, genetic correlations between the beginning (e.g. day 45) and the end (day 525) of the lactation for protein yield are not as low as those for milk yield (Table 6v. 7).
Genetic (above) and phenotypic (below) correlation and heritability (on the diagonal) for protein yield on selected days in the first lactation

The heritability for fat yield (Table 8) showed less variation compared with milk (Table 6) and protein yield (Table 7), except for the rise at about 525 days of lactation (18 months). Compared with genetic correlation for milk (Table 6) and protein yield (Table 7), correlations between fat yields at different days were high and less variable (Table 8).
Genetic (above) and phenotypic (below) correlation and heritability (on the diagonal) for fat yield on selected days in the first lactation

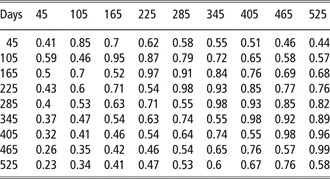
The heritability values for protein percentage are higher than those estimated for the other traits in the current study (Table 9). Similarly, genetic correlations between days in milk are also higher for protein percentage compared with estimates for other traits, suggesting that protein percentage is less variable than other traits. Similarly, fat percentage was more heritable and showed less variation over the course of the lactation (result not tabulated) than that for yield traits.
Genetic (above) and phenotypic (below) correlation and heritability (on the diagonal) for protein percent on selected days in the first lactation

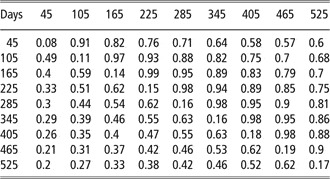
The heritability values for log SCC increased from 0.08 at 45 days to 0.19 by 465 days of lactation and dropped slightly to 0.17 by the end of the 18th month (Table 10). Genetic correlations between days decreased rapidly early in the lactation in a similar pattern to that for milk yield but remained more or less constant in the second half of the lactation. The lowest genetic correlation of 0.57 was between days 45 and 525. However, phenotypic correlations were much lower than genetic correlations (Table 10).
Genetic (above) and phenotypic (below) correlation and heritability (on the diagonal) for log somatic cell count on selected days in the first lactation

Relationships between mean milk yield and persistency of milk yield in the first and second 300 days of first parity
The genetic correlation between mean milk yield in the first 300 days and that after 300 days (0.87) is slightly lower than the correlation of 0.9 estimated for milk yield in the first 300 days and that after 300 days considered each as different traits and tests as repeated records (result not tabulated). Despite adjusting persistency of milk yield in the first 300 days to have genetic correlation of zero with mean milk yield in the first 300 days, the genetic correlation between persistency of milk yield based on the first 300 days and mean milk yield after 300 days is 0.34 (Table 11). These results suggest that selection on mean milk yield and persistency of milk yield based on the first 300 days can be used to improve milk yield after 300 days.
Genetic and phenotypic parameters in the first parity for milk yield in the first 300 days and the second 300 days for mean yield and persistency (Per.) of yield (heritability on, genetic correlation above and residual correlation below the diagonal)

†Standard errors rounded to zero.
‡Persistency is made independent of the respective mean milk yield.
The simple correlation between EBVs of sires with 20 or more progeny for persistency calculated using formula (1) and persistency for the first 300 days calculated in the current study from the re-analyses of slope (Pj 1) using model 5 (Table 11) was 0.8.
Discussion
The data used for this study are deliberately selected to include herds that milked their cows after 300 days and hence the result from this study may not be representative of the average HF cows in Australia. Compared with an average first parity HF cow, cows selected for this study produced 23% more milk in the first 300 days. The average milk yield of HF cows in Australia in the standard 305-day lactation is 5425 and 6181 kg in the first and second parity (ADHIS, 2005), respectively, and is lower than the average 305-day milk yield of cows selected for this study (Table 2).
The fact that first parity cows are more persistent than second parity cows is in agreement with Van Amburgh et al. (Reference Van Amburgh, Galton, Bauman and Everett1997). Schutz et al. (Reference Schutz, Hansen, Steuernagel and Kuck1990) also showed that after 250 days of lactation, daily milk yield of HF cows in the first parity cows was higher than that in the second parity cows. The fact that log SCC levels increased with parity and with days in milk, means milking a large number of mature cows in a herd after 300 days could have a negative economic consequence and result in a loss of premium milk price. The slightly higher level of log SCC for Jersey than for HF cows observed in this study is in agreement with Schutz et al. (Reference Schutz, VanRaden and Wiggans1994) in the US.
In agreement with the current study, a high permanent environmental variance at the beginning and at end of the first lactation was also observed by Druet et al. (Reference Druet, Jaffrézic, Boichard and Ducrocq2003) and Silvestre et al. (Reference Silvestre, Petim-Batista and Colaço2005). The pattern of heritability estimates observed in the current study for milk yield are generally similar to those estimated based on HF data between days 5 and 348 in Portugal by Silvestre et al. (Reference Silvestre, Petim-Batista and Colaço2005). The current heritability estimates for milk yield are higher than those reported earlier based on Australian HF data (Meyer et al., 1989; Veerkamp and Goddard, Reference Veerkamp and Goddard1998; Van der Werf et al., Reference Van der Werf, Goddard and Meyer1998). On the other hand, the current heritability estimates are slightly lower than those reported by Olori et al. (Reference Olori, Hill, McGuirk and Brotherstone1999) and Pool et al. (Reference Pool, Janss and Meuwissen2000) in the first 305 days.
In agreement with the current study, lower heritability values for protein yield compared with milk were also estimated by Veerkamp and Goddard (Reference Veerkamp and Goddard1998) working on HF data in Australia. The similar pattern of genetic correlations observed for milk and protein yield in the current study are in general agreement with the study of Silvestre et al. (Reference Silvestre, Petim-Batista and Colaço2005). However, the less variable genetic correlations between days in milk for fat yield compared with protein and milk yield is not in agreement with that reported by Silvestre et al. (Reference Silvestre, Petim-Batista and Colaço2005).
For log SCC, the heritabilities, phenotypic and genetic correlations estimated in the current study are higher than those reported by Haile-Mariam et al. (Reference Haile-Mariam, Bowman and Goddard2001) based on the first 305 days of lactation.
The heritability of mean milk yield in the first 300 days was slightly higher (Table 11) than our earlier estimate based on HF data collected before 1999 when estimated in the same way, but that for persistency of milk yield was the same (Haile-Mariam et al., Reference Haile-Mariam, Bowman and Goddard2003).
Literature estimates of correlations between part lactations within the first 305 days show that milk yield early in lactation has a reasonably high phenotypic and genetic correlation with milk yield late in lactation. For example, Wilmink (Reference Wilmink1988) estimated genetic correlations of 0.76, 0.64 and 0.67 for milk, fat and protein yield in the 2nd month of lactation and with the corresponding yield recorded between 91 to 180 days, respectively. Others have shown similar results (Meyer et al., 1989; Van der Werf et al., Reference Van der Werf, Goddard and Meyer1998; Veerkamp and Goddard, Reference Veerkamp and Goddard1998; Olori et al., Reference Olori, Hill, McGuirk and Brotherstone1999; Pool et al., Reference Pool, Janss and Meuwissen2000). The results in this study suggest that the pattern of relationships among days of lactation to 540 days is, in general, similar to that observed in the first 305 days.
The low heritability values for milk-yield traits from the repeatability model (Table 4) compared with the RR models (Table 6) observed in the current study are in agreement with results in the US (Bormann et al., Reference Bormann, Wiggans, Druet and Gengler2003). The highest heritability value for milk yield at about 4 months of lactation observed in the current study is in agreement with some recent estimates based on RR models (Olori et al., Reference Olori, Hill, McGuirk and Brotherstone1999; Pool et al., Reference Pool, Janss and Meuwissen2000; Bormann et al., Reference Bormann, Wiggans, Druet and Gengler2003) in HF cattle. Pool et al. (2000) also reported a heritability of 0.31 from a repeatability model considering tests as repeated records compared with 0.20 to 0.46 from various RR models.
Although most dairy cows are nowadays milked for longer than 305 days, dairy cattle genetic evaluations are based on milk yield recorded in the first 305 days. Schaeffer (Reference Schaeffer2004) and Swalve (Reference Swalve2000) argue such restriction is unnecessary. One of the main justifications for performing genetic evaluation on early lactation yield was to minimise possible bias that may occur due to culling based on early lactation (Wilmink, Reference Wilmink1988). In recent years with the popularisation of RR models that consider milk yield on each day of lactation, this may not be a major problem (Jamrozik et al., Reference Jamrozik, Schaeffer and Dekkers1997). Nevertheless, in the current study, the simple correlation between sires EBVs for the first 300 days  was high (0.94) for milk yield, suggesting the advantage from considering longer lactations is small.
The decision to delay mating of cows after calving with the aim of milking them over an extended lactation period, will have to be made early in lactation. The high genetic and permanent environmental correlations between milk or protein yield early in lactation (first 5 months and first 200 days) with corresponding yield later in lactation (after 300 days of lactation) suggest that progeny of sires with high EBVs and cows that produce at a higher level at the beginning of the lactation are likely to continue to produce at a higher level if milked in the extended lactation period.
The positive genetic correlation between persistency of milk in the first 300 days with mean yield in the second 300 days suggests that selection on persistency could be an additional selection criterion, particularly if cows are going to be milked after the standard 305-day lactation. Dekkers et al. (1998) reported that the economic value of selecting for persistency relative to that of milk yield increases with increase in the length of lactation. Therefore, particularly herds that aim to milk cows after the standard 305 days could select sires for persistency of milk yield in addition to milk yield provided official genetic evaluation for persistency are released. EBVs for persistency could be a by-product of an RR test-day genetic evaluation (Jamrozik et al., Reference Jamrozik, Schaeffer and Dekkers1997). The simple correlation between the sum of EBVs from days 4 to 540 with persistency of yield calculated according to formula (1) is 0.21 for sire with 20 or more progeny, indicating that the additional benefit from considering persistency is only marginal. This compares to near-zero (−0.07) correlation between the sum of EBVs from days 4 to 305 and persistency of yield (formula (1)).
The effect of stage of gestation on the milk yield of cows is not taken into account in this study due to lack of adequate data on pregnancy for most cows. However, ignoring the effect of the stage of pregnancy on estimated genetic parameters from a sire model are likely to be small. At a given time during the lactation, some daughters of a bull are likely to be open while others could be at different stages of pregnancy, but on average the effect could cancel out. Based on data in the first 300 days, ignoring or accounting for stage of gestation had little effect on genetic parameter estimates (Haile-Mariam et al., Reference Haile-Mariam, Bowman and Goddard2003), though stage of gestation had important effect on daily milk yield after about 150 days of pregnancy.
According to the British FAWC (1997), increased longevity is one likely advantage of extended lactations. The simple correlation between EBVs for survival from the official genetic evaluation (ABVs released by ADHIS in August 2006) and bull solutions calculated in this study based on milk yield after 300 days (0.29) was similar to the correlation of survival EBVs with milk yield in the first 300 days (0.34). Thus, longevity measured as survival to the next lactation does not seem to be particularly associated with high EBV for milk yield after 300 days of lactation. Similarly, the correlation of EBVs for fertility and angularity from the official genetic evaluation with bull solutions for milk yield after 300 days of yield was not different from that with milk yield in the first 300 days (results not tabulated).
Conclusions
Protein yield early in lactation (e.g. first 2 months) has a genetic correlation of about 0.8 with protein yield produced after 300 days of lactation. Genetic correlations between lactation stages that are adjacent to each other were high (0.9 or more) within parity. Across parities genetic correlations were high for both protein and milk yields if recorded in the same stage of lactation. The pattern of genetic correlations between milk yield over 540 days of lactation does not markedly differ from the pattern in the first 300 days of lactation. As the time interval between 2 test-days increases, the genetic correlation on those days decreases to as low as 0.15, between milk yields on days 45 and 525. The result from this study shows that progeny of bulls with high EBV for yield traits and those that produce at a relatively high level in the first few months are the most likely candidates for extended lactation.
Acknowledgements
Funding for this project is provided by Dairy Australia and the Department Primary Industries Victoria. ADHIS provided the data for this study. We thank Dr. Kevin Beard for extracting the data from the ADHIS database.