Introduction
Resilience of the healthcare system has been described as the ability to absorb, adapt, and respond to stressors and shocks, which is critical to ensuring ongoing safe provision of care both routinely and during periods of emergency.Reference Tan, Prager, McClelland and Dark1 Stressors such as inadequate staffing and limits on bed capacity were known risk factors for worse patient outcomes prior to the COVID-19 pandemic, but the COVID-19 pandemic exacerbated these existing challenges.Reference McKenna, Heslin, Viccellio, Mallon, Hernandez and Morley2
During the height of the pandemic, hospitals experienced staffing shortages, both temporary and permanent, with particular concern around the loss of highly skilled nursing staff, due to attrition and illness of staff, including furloughs of infection prevention staff.Reference Advani, Cromer and Wood3–5 Patients hospitalized with COVID-19 often require complex care with the need for intense infection control measures including the use of personal protective equipment and physical separation from other patients.
A particular concern has been the effect of the strained conditions on patient safety, including measures of healthcare-associated infections (HAIs) such as central line-associated bloodstream infections (CLABSIs).Reference Fakih, Bufalino and Sturm6 Previous results from the Centers for Disease Control and Prevention’s (CDC) National Healthcare Safety Network (NHSN) have shown that the national rate of CLABSIs increased during the first and second years of the pandemic.Reference Patel, Weiner-Lastinger and Dudeck7–Reference Lastinger, Alvarez and Kofman9 Hospitalized patients with COVID-19 often have multiple comorbidities and may be more likely to require central lines as part of their clinical management.Reference Kompaniyets, Pennington and Goodman10 Prior to the pandemic, the national rate of CLABSIs had been dropping for several years, and by 2019, there had been a 31% reduction compared to 2015, with a national unadjusted rate of 6.9 CLABSIs per 10,000 central line days in 2019.11 During July 2020 through June 2021, the first 12 months of the pandemic, when hospitals were treating higher numbers of COVID-19 patients, the monthly rate of CLABSIs rose. Resilience of the US healthcare system has historically not been under routine surveillance. However, understanding the relationship between observable staffing shortfalls and increased patient safety events such as nationally reported HAIs can help describe the need for greater resilience in the US healthcare system. To evaluate how factors related to operations and resource use may have affected HAIs, we performed a statistical analysis of hospital-level CLABSI and COVID-19 data from July 1, 2020, to June 30, 2021, using 4 measures that reflect the strain on resources placed upon hospitals by the COVID-19 pandemic.
Methods
NHSN data
A monthly analysis dataset was constructed based on patient care location-level data (eg, oncology services, intensive care units) reported to the NHSN Patient Safety Component covering the period July 1, 2020, to June 30, 2021. Hospitals receiving payment from the Centers for Medicare & Medicaid Services (CMS) reported data on CLABSI to the NHSN Patient Safety Component in accordance with CMS reporting rules and state reporting mandates. Data from US inpatient hospitals classified in NHSN as general acute care, inpatient surgical, oncology, orthopedic, women’s, women and children’s, children’s, military, and Veterans Administration hospitals were analyzed. The analysis included CLABSI events and number of central line days for locations within each hospital with a monthly CLABSI reporting plan that reported at least 1 central line day. Hospital characteristics were obtained from the most recent NHSN annual hospital survey including hospital type, medical school affiliation, and number of inpatient beds set up and staffed. Location type was assigned by the hospital using standardized CDC location definitions; inpatient rehabilitation units were excluded.12
Measures of hospital operational strain and COVID-19
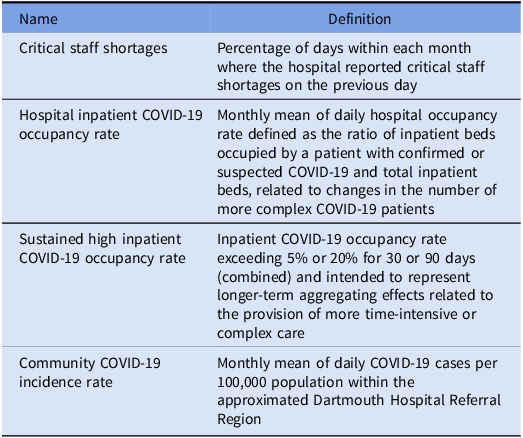
Four measures of stress on resources in hospitals were established that exploit mandatory reporting requirements during the COVID-19 pandemic and are defined in Table 1. Three of these measures were based on available data from reporting on COVID-19 in hospitals that were established during the COVID-19 pandemic: critical staff shortages, hospital inpatient COVID-19 occupancy rate, and sustained high inpatient COVID-19 occupancy rate. The COVID-19 occupancy rate measure was intended to represent potential short-term impacts on patient safety related to the burden of managing time-intensive or complex COVID-19 patients. The sustained inpatient COVID-19 occupancy rate measure was intended to capture the potential impacts of longer-term aggregating effects (such as staff burn-out due to high occupancy or pressure on supplies) related to the provision of more time-intensive or complex care over an extended period. Data on COVID-19 in hospitals were obtained from the NHSN Patient Safety Component COVID-19 Module (prior to July 14, 2020) and from the US Department of Health and Human Services Unified Hospital Data Surveillance System, HHS Protect (from July 15, 2020, to June 30, 2021). Hospitals from the HHS Protect data source were matched to NHSN and de-duplicated where necessary. Hospital data were cleaned to remove extreme outlier values, which were likely to be erroneous by using sigma checks and by automated comparison with the surrounding values in the time series. To address variability in the values of the total inpatient beds, a stable count of inferred base inpatient beds was created by removing erroneous values and imputing the most recent value forward in time.
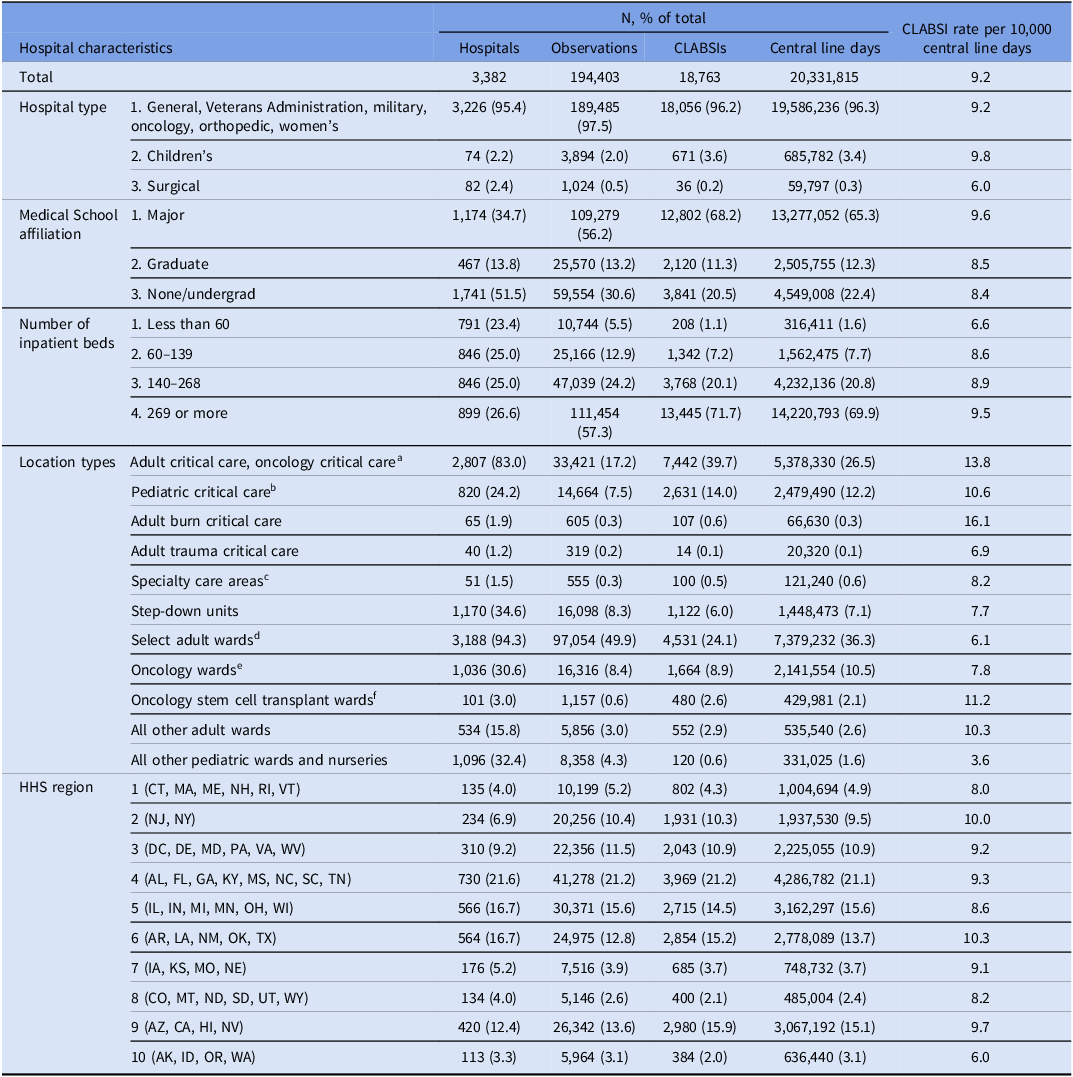
Summary of hospital characteristics

Note. CLABSIs, central line-associated bloodstream infections; HHS, Health and Human Services.
a Includes the following critical care units: medical, medical/surgical, surgical, medical cardiac, surgical cardiothoracic, neurologic, neurosurgical, prenatal, respiratory, medical oncology, medical/surgical oncology, pediatric oncology, and surgical oncology.
b Includes the following critical care units: pediatric burn, pediatric cardiothoracic, pediatric medical/surgical, pediatric medical, pediatric neurosurgical, pediatric surgical, and pediatric trauma.
c Includes inpatient dialysis and adult and pediatric solid organ transplant.
d Includes medical, medical/surgical, neurology, neurosurgical, surgical, and telemetry wards.
e Includes general hematology/oncology, pediatric general hematology/oncology, leukemia, leukemia/lymphoma, lymphoma, and solid tumor wards.
f Includes adult and pediatric hematopoietic stem cell transplant wards.
To account for the potential that the community burden of COVID-19 may also contribute to hospital stress, the fourth measure was the incidence rate of COVID-19 in the community. Data were aggregated to a multi-county spatial unit to reflect a broader patient catchment area. This aggregation was performed because patients may not be present at a hospital in their home county. The Dartmouth Hospital Referral Region (HRR) was used as the spatial aggregation unit for case data because it reflects the large-scale trends in incidence rates of COVID-19 applicable to the medium and large-sized hospitals that report central line days. The HRR combines multiple zip code tabulation areas and crosses county and state boundaries. A modified HRR was created, such that counties appearing in multiple HRRs were reassigned to 1 HRR based on US Census population estimates within each zip code tabulation area. The modified HRR was allowed to cross state boundaries to accurately reflect the hospital catchment area. The incidence rate of COVID-19 in the community was then constructed as the monthly mean of daily COVID-19 cases per 100,000 population within the modified HRR.
Statistical modeling approach
The statistical model was constructed by first selecting hospital-level variables to use for risk adjustment consistent with the NHSN Standardized Infection Ratio 2015 baseline risk adjustment model.13 The risk adjustment for the current study replicated the methodology of the 2015 baseline using a generalized linear model (GLM) with the annual total number of CLABSI events modeled as a negative binomial distribution with the canonical log link and the log of central line days included as an offset from July 1, 2020, to June 30, 2021. Hospital type, medical school affiliation, and location type were included separately in the model, and categorizations of these variables that were not statistically significantly different (ie, P > .05) from their referent group were collapsed, with the exception that critical care locations were not grouped with noncritical care locations.
The final model for the monthly number of CLABSIs within each location was produced using a generalized estimating equations (GEE) model with a negative binomial distribution, the canonical log link, and the corresponding number of central line days for the location included in the model as a log-offset.Reference Liang and Zeger14 The GEE is an extension of the GLM that accounts for the monthly time dependence in the data by inflation of the model error based on an assumed correlation structure. A first-order autoregressive structure based on the month was chosen as the most appropriate structure.Reference Hardin and Hilbe15 Hospital risk adjustment variables fitted using the annual GLM were included in the model. The 4 hospital burden measures were tested separately in the model and then included together for the final model.
The final fitted model was then used to predict the number of events of CLABSI under 5 scenarios that were created to be alternates to the actual observed scenario. These 5 scenarios were compared to predictions from the actual fitted model for the purposes of showing the reductions in CLABSIs that might be accomplished if interventions were created that would result in the alternate scenario. In each case, the final fitted model was used to generate predictions with parameters forced to set levels corresponding to the scenario assumptions (Table 2).
Summary of COVID-19 burden measures

Scenario 1 (moderate COVID-19) was intended to represent more moderate community and hospital COVID-19 levels in contrast to the actual COVID-19 burden during the period covered for this study. Scenario 2 (no staff shortages) represented an absence of critical staff shortages. Scenario 3 (no sustained hospital burden) represented no sustained temporal burden of patients hospitalized with COVID-19. Scenario 4 (no staff shortages or sustained burden) combines scenarios 2 and 3: the absence of staff shortages with no sustained high burden of patients with COVID-19. Scenario 5 (low COVID-19) represented a setting of low rates of COVID-19 in both the hospital and the community rates, no staff shortages, and no sustained high hospital burden by setting all 4 COVID-19 burden measures in the fitted model to the lowest levels.
Results
Table 3 summarizes the hospitals by characteristics included in the final model. A total of 3,382 hospitals were included representing 194,403 observations, where each observation represented aggregated data for a location within the hospital for a single month. There were a total of 18,763 CLABSIs from July 1, 2020, to June 30, 2021, with 20,331,815 central line days reported, giving an overall rate of 9.2 CLABSIs per 10,000 central line days. Lower rates of CLABSIs were found in surgical hospitals (6.0 CLABSIs per 10,000 central line days) and in hospitals with less than 60 inpatient beds (6.6 CLABSIs per 10,000 central line days). The CLABSI rate was higher in larger hospitals with 269 or more inpatient beds (9.5 CLABSIs per 10,000 central line days), major teaching hospitals (9.6 CLABSIs per 10,000 central line days), and in children’s hospitals (9.8 CLABSIs per 10,000 central line days). The highest rates of CLABSIs occurred in critical care locations (16.1, 13.8, and 10.6 CLABSIs per 10,000 central line days in burn, medical/surgical/oncology, and other/pediatric/trauma locations, respectively). There was some geographic variation in CLABSI rates by Health and Human Services Region, with the highest rates occurring in Regions 6, 2, and 9 (10.3, 10.0, and 9.7 CLABSIs per 10,000 central line days, respectively).
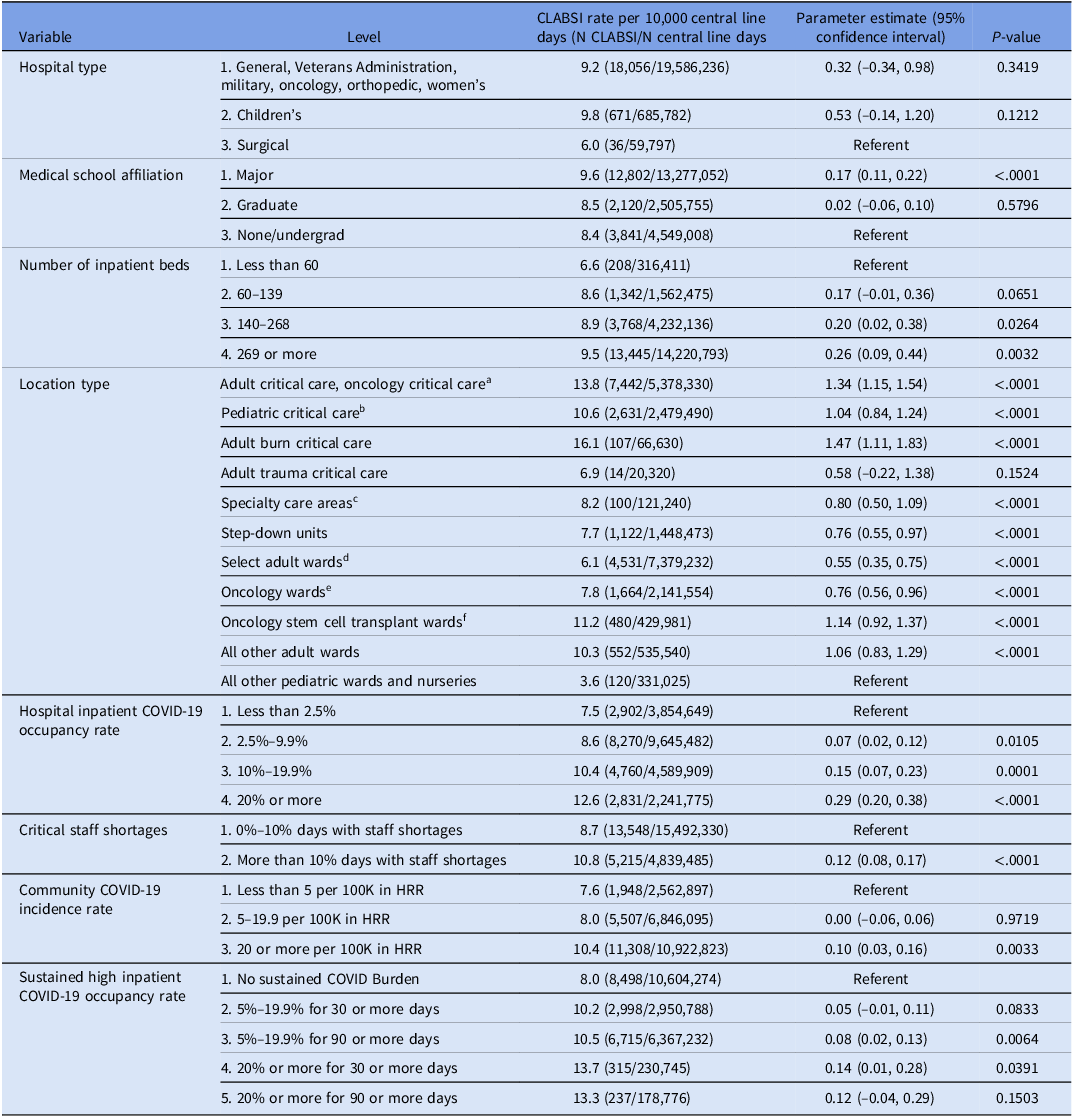
Fitted model parameters with CLABSI rate for each level of the variables included in the model

Note. CLABSIs, central line-associated bloodstream infections; HRR, Hospital Referral Region.
a Includes the following critical care units: medical, medical/surgical, surgical, medical cardiac, surgical cardiothoracic, neurologic, neurosurgical, prenatal, respiratory, medical oncology, medical/surgical oncology, pediatric oncology, and surgical oncology.
b Includes the following critical care units: pediatric burn, pediatric cardiothoracic, pediatric medical/surgical, pediatric medical, pediatric neurosurgical, pediatric surgical, and pediatric trauma.
c Includes inpatient dialysis and adult and pediatric solid organ transplant.
d Includes medical, medical/surgical, neurology, neurosurgical, surgical, and telemetry wards.
e Includes general hematology/oncology, pediatric general hematology/oncology, leukemia, leukemia/lymphoma, lymphoma, and solid tumor wards.
f Includes adult and pediatric hematopoietic stem cell transplant wards.
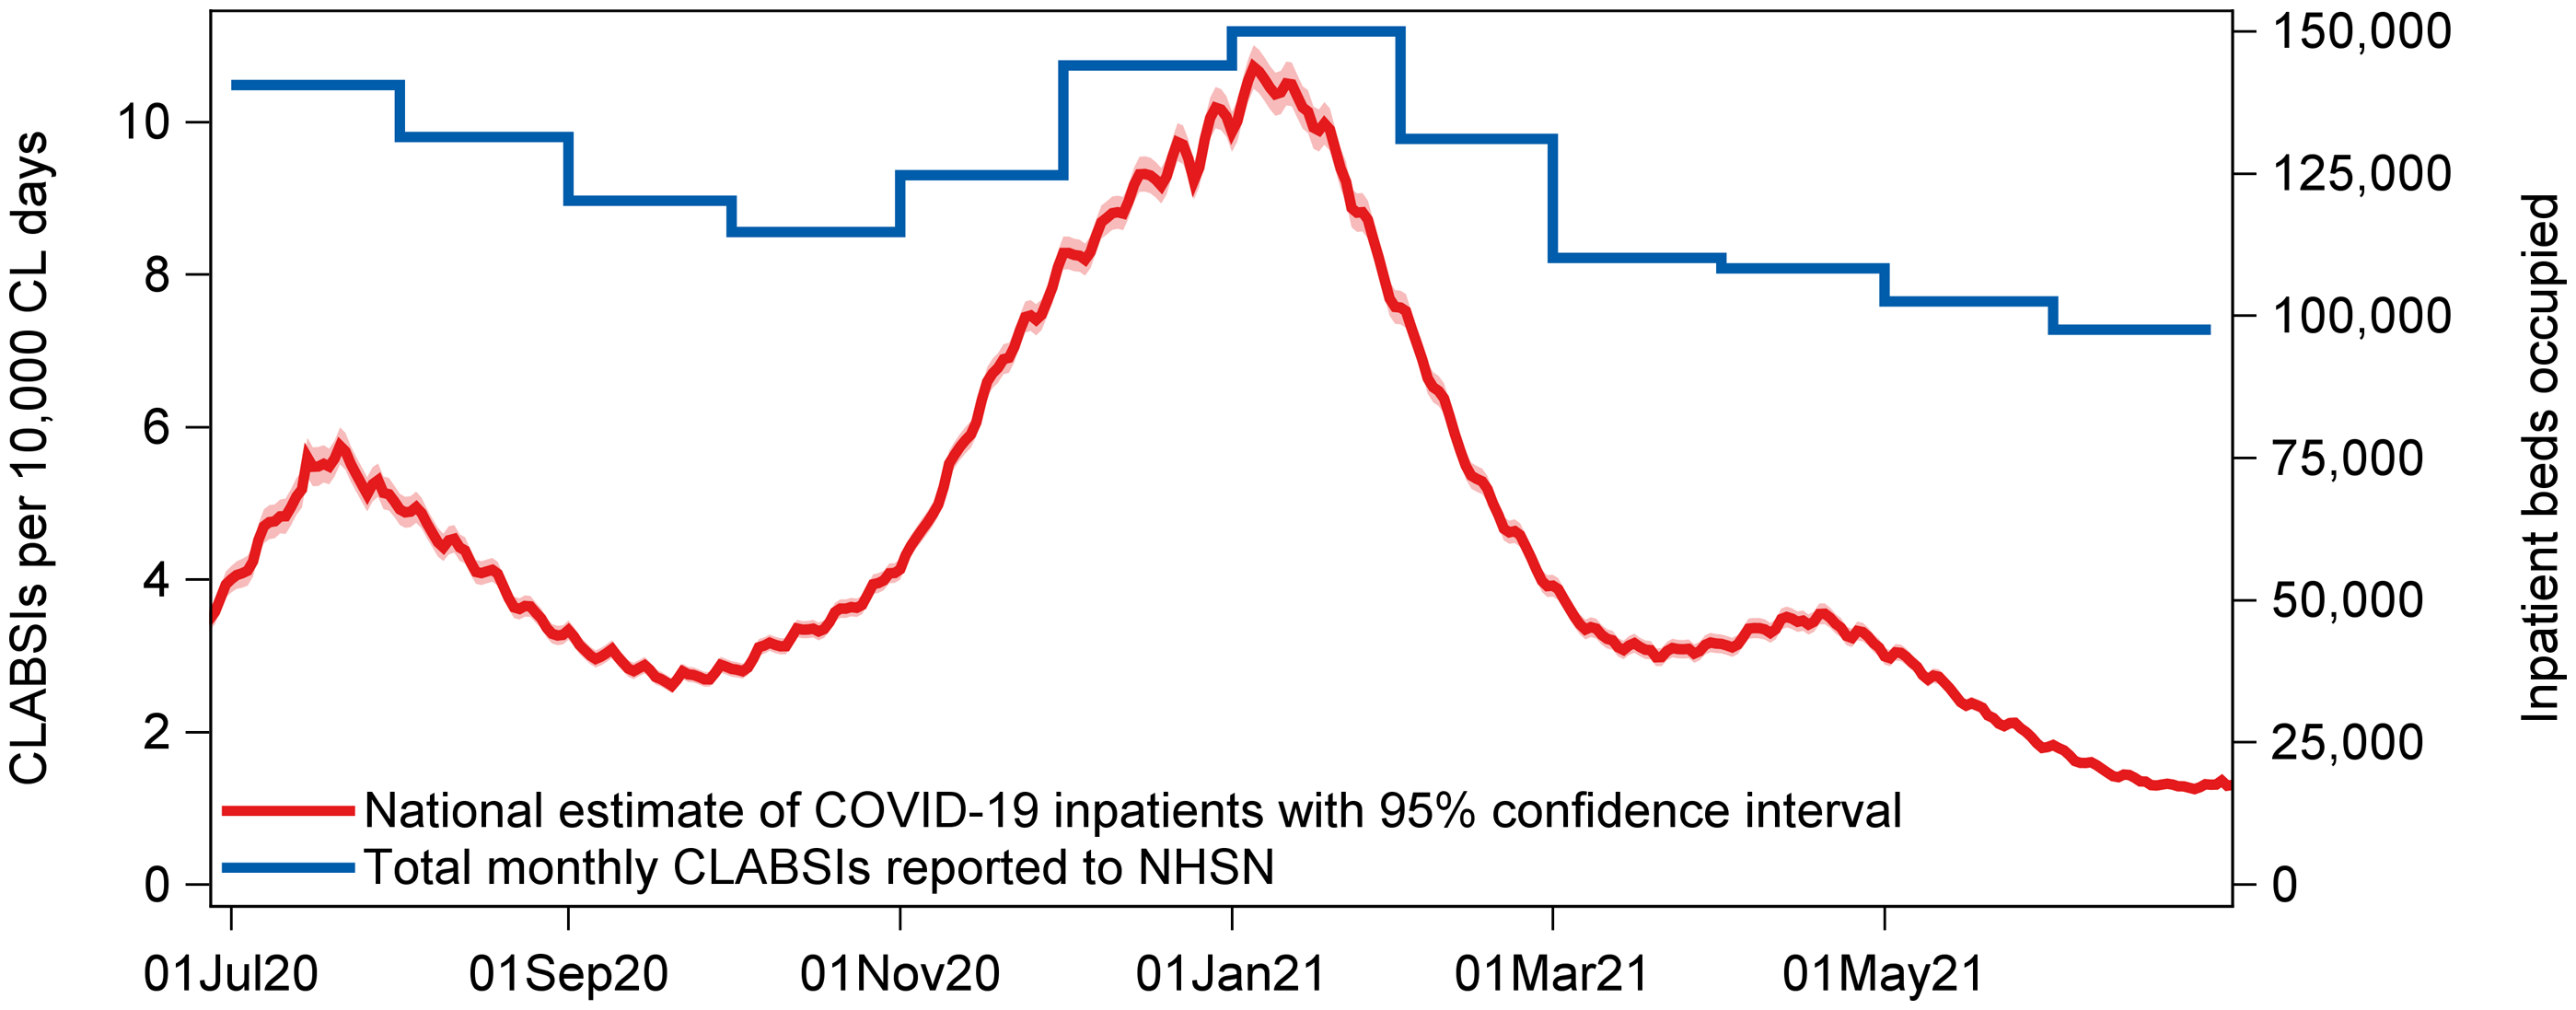
The final fitted model with hospital risk adjustment characteristics (eg, hospital type, number of beds, reporting location type) and metrics of COVID-19 burden is shown in Table 4. Hospital type was not statistically significant in the model but was retained. All 4 of the COVID-19 metrics were statistically significant in the model after accounting for hospital-level factors. Critical staff shortages of more than 10% of days in a month were associated with a statistically significant increase in CLABSIs. The number of CLABSIs increased when the hospital inpatient COVID-19 occupancy rate was higher, with the highest group (COVID-19 inpatient occupancy at 20% or more) having 5 more CLABSIs per 10,000 central line days compared to the lowest (reference) group. This relationship is also shown in Figure 1, which shows the monthly rate of CLABSIs from July 1, 2020, to June 30, 2021, with a daily national estimate of inpatient beds occupied by COVID-19 patients.Reference Sapiano, Dudeck and Soe16 A higher incidence of COVID-19 in the community was also associated with a statistically significant increase in CLABSI rate for the group of hospitals that reported the highest inpatient occupancy with COVID-19 (20 or more cases per 100,000 in the HRR) versus the referent. The group of hospitals with the middle level of COVID-19 in the community (5 to 19.9 cases per 100,000 in the HRR) did not significantly differ from the referent. Hospitals that had sustained high inpatient COVID-19 occupancy rates had statistically significantly higher CLABSI rates than the referent. Hospitals with COVID-19 occupancy of 20% or more for 90 or more days were not only statistically significant but also had the lowest exposure and fewest observations.
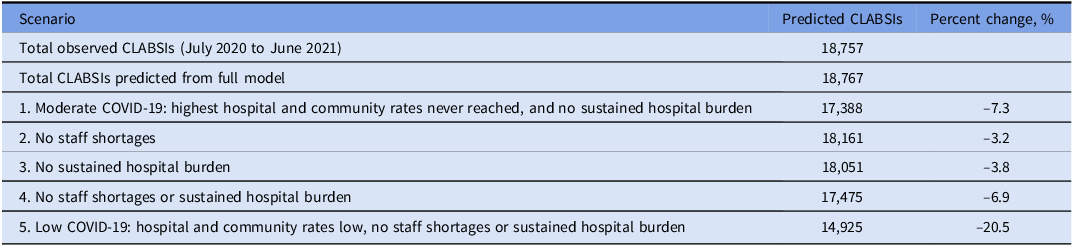
CLABSIs predicted from the mode under 5 scenarios

Note. CLABSIs, central line-associated bloodstream infections.
Time series of CLABSIs rate (per 10,000 central line days; left axis) and national estimate of inpatient beds occupied by a patient with confirmed or suspected COVID-19 (with 95% confidence band; right axis) from July 1, 2020, to June 30, 2021. CL, central line; CLABSIs, central line-associated bloodstream infections; NHSN, National Healthcare Safety Network.

The final fitted model shown in Table 2 was used to estimate the number of CLABSIs that could have occurred from July 1, 2020, to June 30, 2021, under 5 alternate scenarios. The total number of CLABSIs observed during this period was 18,757 with a corresponding base prediction from the model of 18,767. Under scenario 1 of moderate COVID-19 burden, where the highest hospital and community rates were never reached and there was no sustained hospital burden, the number of CLABSIs predicted from the model was 17,388, which is a 7.3% reduction from the model’s base prediction. Scenario 5 extends on scenario 1 to assume that all COVID-19 burden was low throughout the period and leads to 14,925 predicted CLABSIs, a 20.5% decrease from the model’s base prediction. Scenarios 2 (no staff shortages) and 3 (no sustained hospital burden) each lead to similar predicted decreases in CLABSIs of 3.2% and 3.8%, respectively. Scenario 4, a composite of scenarios 2 and 3 (no staff shortages or sustained burden), leads to 17,475 predicted CLABSIs, a 6.9% reduction in predicted CLABSIs.
Discussion
Mandatory reporting of data pertaining to hospital operations during the COVID-19 pandemic afforded an opportunity to evaluate resilience in US hospitals and showed that stressors such as reduced staffing and higher occupancy with patients with COVID-19 negatively affected patient safety, specifically as measured by CLABSIs. Staffing shortages and sustained stress from caring for high loads of patients with COVID-19 over prolonged periods each contributed to more than a 3% increase in the adverse patient safety event of CLABSIs. Facilities reporting staffing shortages for more than 10% of days contributed close to 600 more CLABSIs than expected. These results confirm and quantify the negative relationship that stressors on hospital operations and resources have with patient safety events.
Other studies have shown that CLABSI rates increased during surges of COVID-19 hospitalizations in the US during 2020, and this trend continued into the first half of 2021, as COVID-19 hospitalizations persisted.Reference Fakih, Bufalino and Sturm6 To evaluate discrete factors that may have been important in driving the overall ecological trend, our analysis found that after accounting for hospital characteristics, 4 metrics of burden due to COVID-19 were independently statistically significantly associated with worsening CLABSIs. A higher rate of CLABSIs occurred when there were critical staff shortages, when hospital inpatient COVID-19 occupancy rates were higher, when there was sustained high inpatient COVID-19 occupancy, and when the community COVID-19 incidence rate was higher. Improvements in any of these constraints reduced the rate of CLABSIs by up to 20%.
The relationship between indicators of stressed hospital resources and patient safety events is illustrated by exploring 5 alternate scenarios. Two of the scenarios describe factors outside of the control of the healthcare facilities and relate to the incidence of COVID-19 in the community (the moderate COVID-19 scenario and the low COVID-19 scenario). These 2 scenarios are intended to represent the impact that public health interventions such as vaccination can have on reducing hospital stress. Public health measures to control the spread of disease play a role in improving patient safety by reducing pressure on the healthcare system and should be considered an important component of robust activities to address resilience. The other 3 scenarios are intended to represent more direct interventions that can have an effect at the facility level (scenarios of no staff shortages; no sustained burden; no shortages or sustained burden). The purpose of evaluating these 3 alternate scenarios was to elucidate the impact on patient safety of policies and interventions that address staffing and capacity of US hospitals—not only addressing shortages in healthcare staffing but also devising ways to expand capacity at hospitals experiencing sustained high burdens of complex patients or by spreading their patient loads. Such efforts may further benefit from having a true national lens of occupancy in hospitals usable for developing policy levers that can be effective at improving healthcare resilience and capacity. The problem of constrained healthcare resilience in this country has been expanding and continues to grow exponentially.Reference Venkatesh, Janke, Rothenberg, Chan and Becher17–Reference Janke, Melnick and Venkatesh19 Our analysis and analyses by othersReference Cimiotti, Becker and Li20,Reference Janke, Mei, Rothenberg, Becher, Lin and Venkatesh21 document the risks to patient safety and healthcare quality and begin to draft the case for developing a national surveillance program designed to highlight and describe the problem and the aspects of it that may be able to be ameliorated.
This study was subject to several limitations. First, it is unclear whether the increase in CLABSIs was linked to the possibility of an intrinsically higher risk of CLABSI in patients with COVID-19. Although at least 1 study has found a higher likelihood of CLABSI among hospitalized COVID-19 patients, this relationship has not been studied on a large-scale, national level.Reference Sands, Blanchard, Fraker, Korwek and Cuffe22 However, when accounting for hospital COVID-19 burden, CLABSI rates remained significantly associated with non-patient factors (such as staffing). Second, the predictions presented from the statistical model under the 5 scenarios are based on the relationships derived using data from July 1, 2020, to June 30, 2021, specifically in the setting of the COVID-19 pandemic. While illustrative of the scale of potential reductions in CLABSIs based on specific operational interventions, statistical models have limitations in predicting alternate outcomes, and these results may not be generalizable to other types of stressors in hospitals (eg, natural disasters). Third, the definitions for measures of vacancy, hospital occupancy rate, and sustained burden of COVID-19 hospitalizations and the use of aggregate monthly CLABSI totals were limited by the available data collected through mandatory surveillance reporting.
Conclusion
By highlighting the utility of using an existing patient safety surveillance system to monitor stressors on hospital resources and to define operational variables that contribute to that stress, this study suggests a future-facing approach to track resilience in hospitals and potentially identify hospitals that may be at risk for further decompensation in patient care. As understanding of resilience of the healthcare system continues to evolve, there is a need to better define, monitor, and place under surveillance meaningful indicators of strain and their impacts on patient safety and healthcare quality.Reference Tan, Prager, McClelland and Dark1 Additional safety metrics such as those monitored by NHSN and others could be optimized to identify in near real-time facilities that may be facing operational stresses impacting patient safety and hospital resilience with the goal of developing relevant interventions at hospital, local, regional, and national levels that can reduce avoidable harm. Routine collection of operational factors as part of national patient safety surveillance alongside monitoring of patient safety trends may allow hospital-level determinations of optimal staffing levels; serve as a platform to identify systems more likely to be susceptible to stress during local, regional, or national emergencies; and monitor US hospital resilience during public health crises.
Acknowledgments
Financial support
None reported.
Competing interests
All authors report no conflicts of interest relevant to this article.
The Hospital Referral Region data set forth at https://data.dartmouthatlas.org/downloads/geography/ZipHsaHrr19.csv.zip was obtained from the Dartmouth Atlas Data website, which was funded by the Robert Wood Johnson Foundation, the Dartmouth Clinical and Translational Science Institute, under award number UL1TR001086 from the National Center for Advancing Translational Sciences of the National Institutes of Health, and in part, by the National Institute of Aging, under award number U01 AG046830.
Disclaimer
The findings and conclusions in this article are those of the authors and do not necessarily represent the official position of the US Centers for Disease Control and Prevention. The use of trade names is for identification purposes only and does not constitute endorsement by the US Centers for Disease Control and Prevention or the Department of Health and Human Services.