Introduction
Recently, there has been significant interest in the so-called high-entropy alloys (HEAs), which are defined as those kinds of alloys containing at least five principal elements in equal or near-equal at.% [Reference Yeh, Chen, Lin, Gan, Chin, Shun, Tsau and Chang1, Reference Lu, Wang, Chen, Baker, Yeh, Liu and Nieh2, Reference Tsai and Yeh3]. Yeh et al. summarized mainly four core effects for HEAs because these four effects, being the properties of HEAs, are better than those of traditional alloys in some cases [Reference Yeh4]. It is well known that HEAs have attracted much attention because of the excellent properties, including good mechanical properties, thermal properties, and exceptional electrical properties [Reference Ma and Zhang5, Reference Gali and George6, Reference Chou, Chang, Chen and Yeh7, Reference Zhang, Zuo, Cheng and Liaw8]. Hence, it is expected that HEAs own great values of application as functional alloys.
So far, the definition of HEAs has been expanding relatively with further research. It includes not only super solid solution alloys that contain at least five principal elements, but also some quaternary alloys with solid solution structure [Reference Liu, Wang, Liu, Fang, Wu, Chen and Liu9, Reference Qiu, Hu, Taylor, Styles, Marceau, Ceguerra, Gibson, Liu, Fraser and Birbilis10]. However, compared with the alloys that contain at least five principal elements, mixing entropy of some quaternary alloys does not ensure the emergence of the single solid solution. Therefore, Qiu et al. presented a more universal description of “compositionally complex alloys” (CCAs), which is of relevance to describe and understand composition of such alloys that have been reported as HEAs [Reference Qiu, Hu, Taylor, Styles, Marceau, Ceguerra, Gibson, Liu, Fraser and Birbilis10, Reference Daoud, Manzoni, Wanderka and Glatzel11, Reference Jensen, Welk, Williams, Sosa, Huber, Senkov, Viswanathan and Fraser12]. In the meantime, it is worthwhile to note that the investigation of a four-component alloy has great benefit to explore the formation law of high entropy. For example, a novel AlCrFe2Ni2 alloy had been designed based on reported AlCoCrFeNi2.1 eutectic HEAs [Reference Dong, Gao, Lu, Wang and Li13, Reference Lu, Dong, Guo, Jiang, Kang, Wang, Wen, Wang, Jie, Cao, Ruan and Li14], and the alloy has been proved to consist of disordered body-centered cubic (BCC) (A2) phases and ordered BCC (B2) phases besides noodle-like face-centered cubic (FCC) phases. Senkov et al. [Reference Senkov, Senkova, Miracle and Woodward15, Reference Senkov, Senkova, Woodward and Miracle16] have explored the microstructures, phases and mechanical properties of four multiprincipal element alloys at the room temperature, such as NbTiVZr, NbTiV2Zr, and CrNbTiZr. The results showed that the major disordered phases of these alloys are BCC solid solutions. As the earliest and the most mature HEA system, AlCrFeNi–M (M includes Co, Mo, Ti, etc.) HEAs have some similar characteristics. For example, AlCoCrFeNi has a typical dendrite structure, which owns a matrix of disordered [Cr, Fe] and ordered NiAl [Reference Manzoni, Daoud, Völkl, Glatzel and Wanderka17]. AlCrFeNiMox alloys have a double BCC/B2 structure. But when the content of Mo is above 0.8%, the B2 phase is transformed into the σ phase gradually [Reference Dong, Lu, Kong, Zhang and Li18]. Besides, the AlCrFeNi2Ti0.25 HEA has a similar dendrite including the Al–Ni–Ti phase and Cr–Fe phase [Reference Jiang, Jiang, Lu, Wang, Cao and Li19]. According to the analysis above, these HEAs mainly consist of disordered [Cr, Fe] and ordered NiAl. Therefore, after eliminating the influence of the elements of M, extensive research has been carried out [Reference Chen, Qi, Sui, He, Wei, Meng and Sun20]. The results indicate that the AlxCrFeNi alloys, which are the typical eutectic alloys, are composed of the disordered [Cr, Fe] solid solution and ordered NiAl intermetallic, which is similar to the results from Lu et al. [Reference Lu, Dong, Guo, Jiang, Kang, Wang, Wen, Wang, Jie, Cao, Ruan and Li14]. Based on the above analysis, a CrFeNi-based alloy without Al but with Ti has a larger atomic radius, what will happen?
It is well known that the NiTi intermetallic compound can be used as the precipitated strengthening phase in Ni-based high-temperature alloys. Effects of precipitation strengthening on the microstructure and properties of HEAs and the strengthening mechanism have been further studied. For example, CuCr2Fe2NiMn [Reference Ren, Liu, Cai, Wang and Shi21] and Al0.5CrFe1.5MnNi0.5 [Reference Tang, Chuang, Chen and Yeh22] both have a simple BCC or FCC structure, and a large number of phases are precipitated out by a certain heat treatment process. These precipitated phases are mainly brittle phases of a complex structure with a large size, and the reinforcing effect was not ideal. In a word, although the precipitated phase is not controlled properly, precipitated strengthening can still be a favorable reinforcement method in HEAs. In this paper, the microstructure, hardness, and compressive properties of CrFeNiTix CCAs were investigated. Studying the phase formation law of HEAs is of great benefit to investigate CrFeNiTix CCAs, which can provide a reference on precipitation strengthening of HEAs.
Results and discussion
Crystal structure
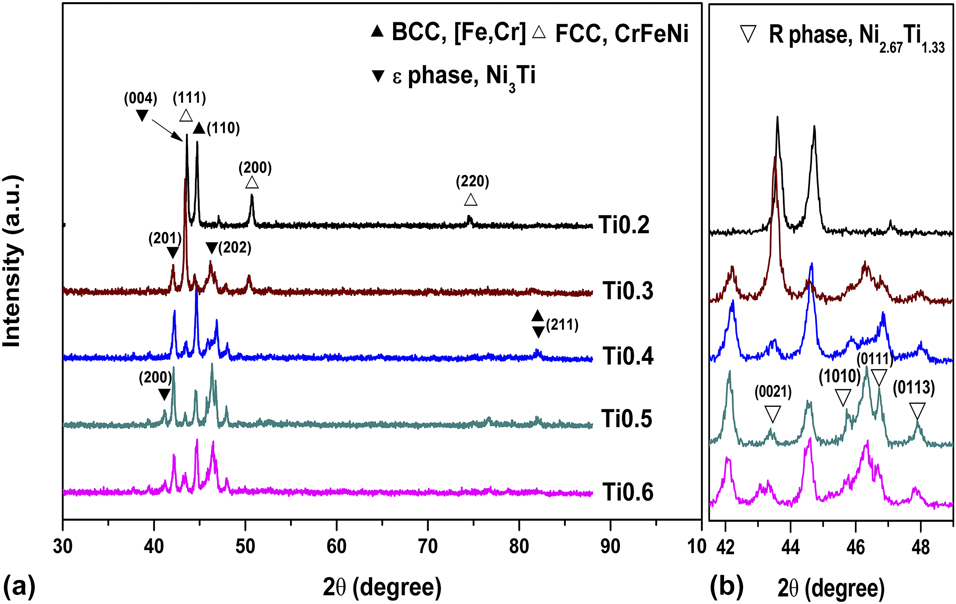
Figure 1 presents the XRD patterns of the as-cast CrFeNiTix alloys (x = 0.2, 0.3, 0.4, 0.5, 0.6). (Fe, Cr)-rich solid solution (Pearson symbol tP30, a = 8.845 Å, c = 4.567 Å, c/a = 0.52) with a disordered BCC structure (designated as BCC), CrFeNi solid solution with a disordered FCC structure (designated as FCC), and Ni3Ti (Pearson symbol hP16, a = 5.096 Å, c = 8.304 Å, c/a = 1.63) intermetallic with an ordered hexagonal close-packed (HCP) structure (designated as ε) are detected. In addition, Fig. 1(b) shows the XRD patterns of as-cast CrFeNiTix alloys at high magnification. According to the standard PDF database of JADE6.0 software (JADE, Sydney, Australia), another phase could be identified as Ni2.67Ti1.33 (designated as R) intermetallic (Pearson symbol hR7, a = 2.579 Å, c = 44.162 Å, c/a = 17.12), a metastable phase, which is similar to results shown in Ref. Reference Shun, Chang and Shiu23.
X-ray diffraction patterns of as-cast CrFeNiTix alloys: (a) 30°–90°, (b) high magnification.
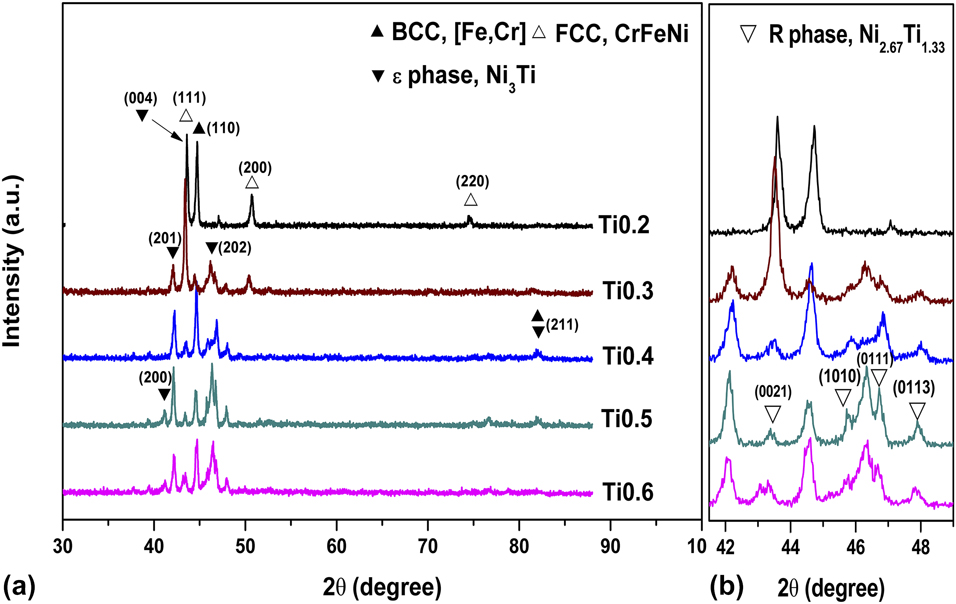
Meanwhile, it can be seen that diffraction peaks of CrFeNiTix alloys shift toward the left with Ti addition. The significant factor is that the addition of Ti atoms leads to the corresponding lattice distortion, which may make the diffraction angle change. Besides, according to the position of the diffraction angle and Bragg’s law, lattice parameters (Å) of CrFeNiTix alloys are calculated by the (111) XRD peaks of FCC phase. Lattice parameters of CrFeNiTix alloys are increased from 3.603 to 3.620 Å with increasing Ti content. This is because Ti atoms have a larger atomic radius than Cr, Fe, and Ni atoms and take up the lattice position of other atoms to bring about the lattice distortion. Besides, the structure of BCC phase is relatively loose, and it can adjust the strain on the lattice of HEAs and reduce the free energy of the HEA system. Additionally, it should be noticed that the intensity of the peak at 44.5° for Ti0.3 alloys decreases and then increases with the further addition of Ti, which can be reflected in the change in microstructure.
Microstructure
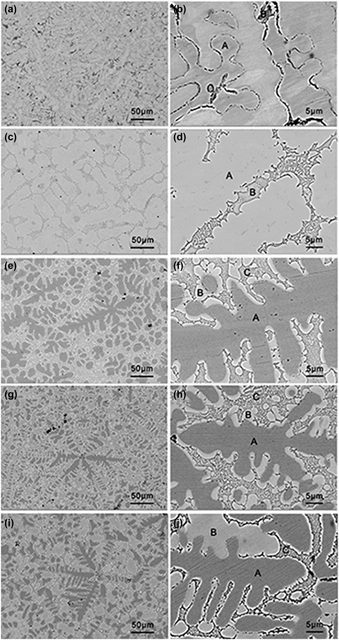
SEM back-scattered images of as-cast CrFeNiTix alloys are presented in Fig. 2. As can be seen in Fig. 2(a), Ti0.2 alloy exhibits a typical dendritic structure at low magnification. When the content of Ti is increased to 0.3, the alloy is changed into an ellipsoidal granular structure, as seen in Fig. 2(c), supplemented by a small number of dendrites, which is in agreement with X-ray diffraction analysis. The change in the morphology is mainly related to the composition segregation. In addition, with the increasing Ti content, it can be seen that the area of the inter-dendrite increases along with the further increasing Ti content, showing that a large amount of (Ni, Ti)-rich intermetallics in the inter-dendritic region are precipitated in Fig. 2(e). In the meantime, dendrite becomes smaller, leading to the mutual coexistence.
SEM back-scattered images of as-cast CrFeNiTix alloys: x = 0.2, low magnification (a) and high magnification (b); x = 0.3, low magnification (c) and high magnification (d); x = 0.4, low magnification (e) and high magnification (f); x = 0.5, low magnification (g) and high magnification (h); x = 0.6, low magnification (i) and high magnification (j).

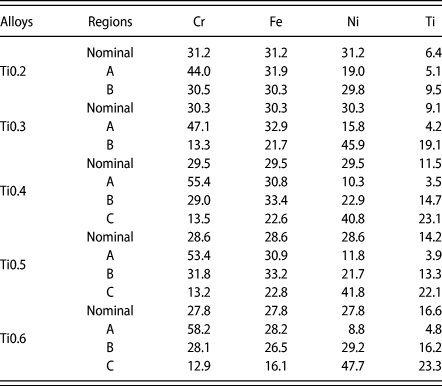
It should be noticed that the microstructure of Ti0.2 and Ti0.3 alloys are only presented including dendrite (denoted as A) and inter-dendrite in Figs. 2(b) and 2(d). However, for Ti0.4, Ti0.5, and Ti0.6 alloys, besides dendrite, some gray cellular structures (among white and dark phase mixed) appear, and two kinds of phases (denoted as B and C) consist in the inter-dendrite, as shown in Fig. 2(f), 2(h), and 2(j) at high magnification. Table I lists the chemical compositions of CrFeNiTix alloys in different regions. It can be found that all the dendrites of as-cast CrFeNiTix alloys have a higher Cr and Fe content, but a lower Ni and Ti content, which means that Ni and Ti atoms are rich in the inter-dendrite. Besides, for Ti0.2 and Ti0.3 alloys, the molar ratio of Ni and Ti content is approximately 3:1, revealing that ε phase can be subsistent combined with XRD analysis. Moreover, for Ti0.4, Ti0.5, and Ti0.6 alloys, Ni:Ti ≈ 2:1, indicating that there may be phase transformation and other (Ni, Ti)-rich phases are formed, which can be verified as R phase combined with the XRD results above. Region B is enriched with Ni and Ti atoms, while region A is enriched with Fe and Cr atoms, which reveals that dendrite contains mixed BCC and FCC phases for Ti0.2 and Ti0.3 alloys. In the inter-dendrite, Ni and Ti contents are higher than Cr and Fe contents, and region B contains approximately equivalent amounts of Fe and Cr atoms, representing that (Ni, Ti)-rich intermetallics mainly gather, with small amounts of (Fe, Cr)-rich phase in the inter-dendrite.
Chemical compositions of the CrFeNiTix (0.2–0.6) alloys in different regions by SEM/EDS (at.%).

Based on the analysis above, the molar ratio of Fe and Cr for Ti0.4, Ti0.5, and Ti0.6 alloys in region B is about 1:1, revealing that (Fe, Cr)-rich solid solution segregates out from FCC phase and mixes with a small amount of (Ni, Ti)-rich intermetallic in the inter-dendrite, seen in Fig. 2 at high magnification. In a word, region B can be regarded as the transition region from FCC phase to BCC and HCP phases. Certainly, it can be attributed to the fact that composition segregation affects the microstructure of CrFeNiTix alloys and phase transition occurs to a certain extent with an increasing content of Ti atom.
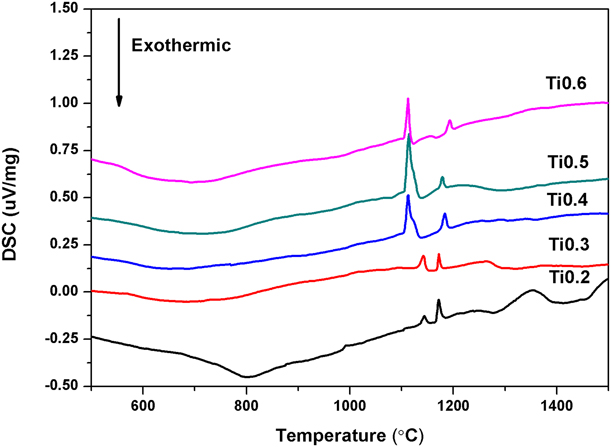
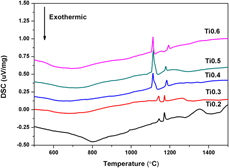
The DSC curves for the CrFeNiTix alloys are presented in Fig. 3. It is displayed that there are a series of endothermic peaks at approximately 1112.37–1143.95 °C, which can confirm the existence of ε phase according to Ni–Ti binary phase diagram [Reference Bellen, Kumar and Wollants24, Reference Jiang, Lu, Dong, Wang, Cao and Li25]. The specific DSC peaks to ε phase are enhanced with the addition of Ti content. When the content of x increased from 0.3 to 0.4, it can be seen that the specific DSC peaks to ε phase shift to the left, which confirms that XRD and SEM analysis are right. Meanwhile, obvious endothermic peaks from 1171.60 to 1193.11 °C with Ti addition are observed for CrFeNiTix alloys, which indicates that the melting point of R phase can be approximately 1190.7 °C due to the similar crystal structure [Reference Shun, Chang and Shiu23]. Additionally, it can be found that the endothermic peaks of ε phase are enhanced and R phase is decreased, while x content exceeds 0.4. It indicates that major (Ni, Ti)-rich intermetallic is ε phase along with minor R phase with the addition of Ti atom.
DSC patterns of CrFeNiTix alloys.

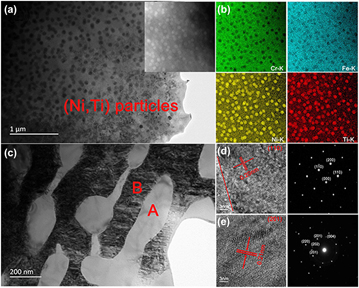
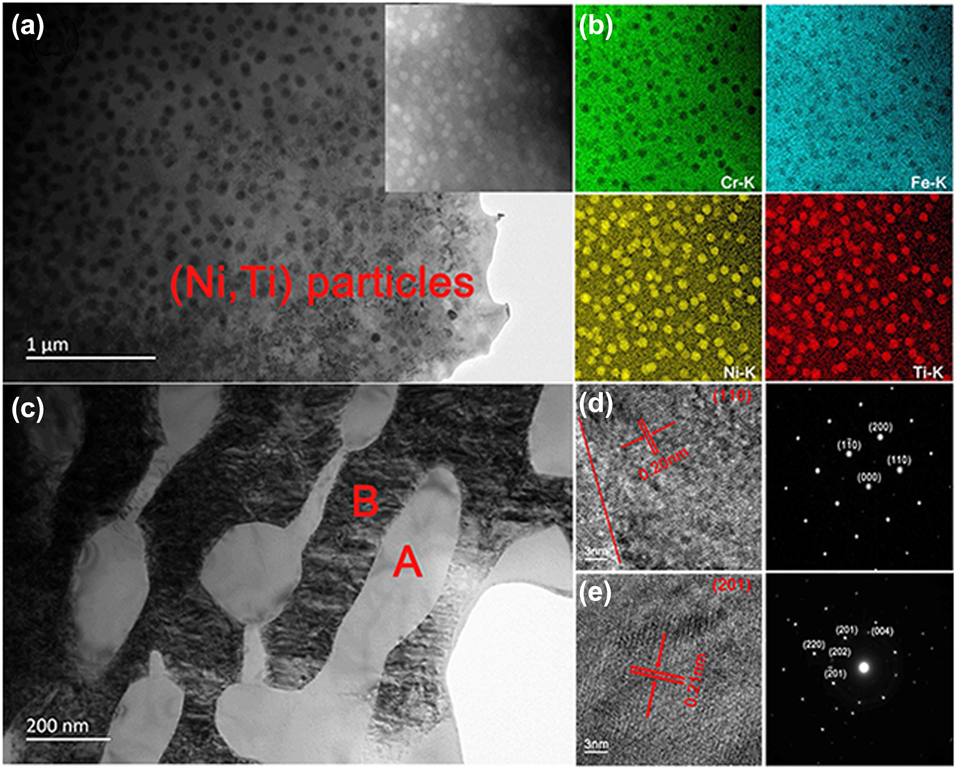
Figure 4 displays the transmission electron microscopy (TEM) bright field (BF) images of the as-cast CrFeNiTi0.4 alloy including dendrite (a) and inter-dendrite (c). It can be noted that the dendrites maintain the disordered FCC structure, which is similar to the results in Ref. Reference Tadashi, Hiroshi, Kosuke, Mamoru, Takahiko, Kenta, Yuichiro, Akihiko and Seiichi26. The nanoparticles are in the dendritic region, and it is presented that the nanoparticles consist of a (Ni, Ti)-rich phase in energy-dispersive X-ray spectroscopy (EDX) mapping of matrix, which are about 80 nm in diameter shown in Fig. 4(b). In addition, the interface between inter-dendritic regions and the matrix is shown in the high-resolution (HR) TEM image marked with a red line in Fig. 4(d). It can be confirmed that the region between dendrites and inter-dendrites is completely coherent. The view of the inter-dendritic region is presented in Fig. 4(c), and the corresponding selected area electron diffraction (SAED) pattern results taken from regions A and B are shown in Figs. 4(e) and 4(d), respectively, which confirms the existence of [Fe, Cr] solid solution [Reference Sui, Gao, Chen, Qi, Yang, He, Wei, Meng and Sun27]. The diffraction spots indicate that the structure of region B from the inter-dendritic region is BCC phase in Fig. 4(d), while the similar D019 structure (HCP) is presented to prove the existence of ε phase further according to the spots in Fig. 4(e) [Reference Hung, Shun and Chiang28].
TEM images and the corresponding SAED patterns of the as-cast CrFeNiTi0.4 alloy, (a) bright-field images of FCC dendrite; (b) EDX elemental mapping of dendrite; (c) bright-field images of BCC and HCP inter-dendrite; (d) the DF image was taken from the superlattice spot of (110) in region B; (e) the DF image was taken from the superlattice spot of (201) in region A.
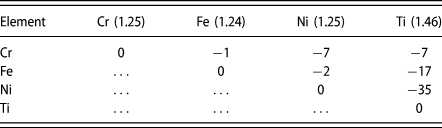
It is well known that the mixing enthalpy ΔH mix of atom pairs and differences in the atomic radii have important impacts on combination of atoms. Table II lists the mixing enthalpy ΔH mix (kJ/mol) of atom pairs and the atomic radii (Å) in CrFeNiTix alloys [Reference Shun, Chang and Shiu23, Reference Senkov and Miracle29]. During the solidification process, FCC solid solution was precipitated firstly in the form of dendrites once the temperature dropped, which has been proved by phase analysis using the acronym of calculation of phase diagram (CALPHAD) modeling [Reference Liu, Gao, Liaw and Zhang31]. It is shown clearly that the mixing enthalpy of Ni–Ti pair is the most negative (−35 kJ/mol), which predicts that Ni and Ti atoms are instantly attracted to each other and the interatomic interaction of Ni–Ti pair would happen in the molten state. Accordingly, the (Ni, Ti)-rich region would appear. When atomic concentration of Ni and Ti reaches a certain extent, (Ni, Ti)-rich regions produce ordering transition and (Ni, Ti)-rich intermetallic is formed. In the meantime, decreasing atomic concentration of Ni and Ti by degrees results in the gradual increase in the relative atomic concentration of Cr and Fe, to form [Fe, Cr]-rich solid solution, which is consistent with the results in Ref. Reference Shun, Chang and Shiu23. With the increase in Ti content, R phase transforms into ε phase gradually and (Ni, Ti)-rich phases are mixed in the inter-dendrite.
The mixing enthalpy ΔH mix (kJ/mol) of atom pairs and the atomic radii (Å) in CrFeNiTix alloys [Reference Senkov and Miracle29, Reference Takeuchi and Inoue30].

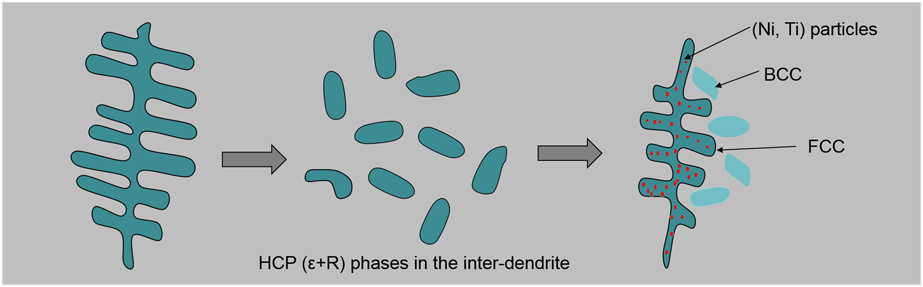
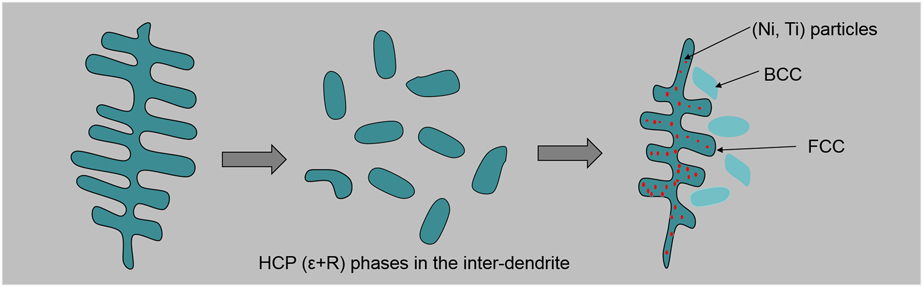
Schematic diagram in Fig. 5 shows the microstructure of CrFeNiTix alloy with the increasing content of Ti atom. It is vividly described that the microstructure of CrFeNiTix alloys is changed from single dendrite to an ellipsoidal granular structure and then dendrite with intragranular (Ni, Ti)-rich precipitates, BCC and HCP (ε + R) phases in the inter-dendrite.
Schematic diagram of microstructure of the alloy of CrFeNiTix alloys with the addition of Ti atom.
It should be noted that the Ti element is added to the FCC alloy matrix, and some of them enters the matrix, which plays an important role in solution strengthening on account of the large atomic radii. Then, most of them are in the enhanced phase of precipitation. Besides, Ti atoms in the inter-dendrite are enriched more than these in the dendrite, which means that Ti could segregate between dendrite branches gradually. Differences in atomic size and electronegativity are easy to cause a lot of space to make alloy matrix produce strong lattice deformation in solidification process, which reveals that the alloy has more strain energy and the alloy is inclined to the element segregation, leading to many defects in alloy matrix. Also, when Ti content is less than 0.4, the first precipitated BCC phase is only a small amount and it cannot be detected easily since the BCC and FCC solid solutions are mixed completely. However, when the x value increases from 0.4 to 0.6, Ni atoms are expended and (Fe, Cr)-rich phase shows up. Because (Fe, Cr)-rich solid solution owns the disordering BCC structure, which has higher intensity and density than FCC structure in alloy matrix.
Mechanical properties
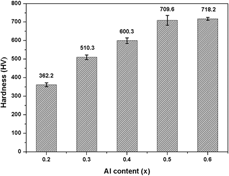
Figure 6 shows Vickers hardness values of the CrFeNiTix alloys. The hardness increases from 362.2 to 718.2 HV when Ti content increases from 0.2 to 0.6 in the as-cast condition. Especially, for Ti0.6 alloys, the maximum hardness is 718.2 HV, which is about 4 times as much as the 304SS stainless steel compared with Ref. Reference Wang32. It suggests that Ti addition makes a significant contribution to increasing hardness. The major factors of increasing hardness are solution strengthening and precipitation hardening.
Vickers hardness of CrFeNiTix alloys.

In the range of 0.2 ≤ x ≤ 0.6, a Ti atom can diffuse into the matrix easily, all atoms can be regarded as solute atoms, and Ti and Ni atoms can be combined to form a hard phase, which contributes to strengthening initially. On the one hand, generation of hard intermetallic in the dendrite branch can provide an effective precipitation hardening. On the other hand, the matrix structure has changed a lot, disordered BCC solid solution is increasing and disordered FCC solid solution is reducing with the increasing Ti content. It is clearly known that hardness of BCC phase is higher than that of the FCC phase and structure transformation promotes higher lattice distortion in the alloy matrix.
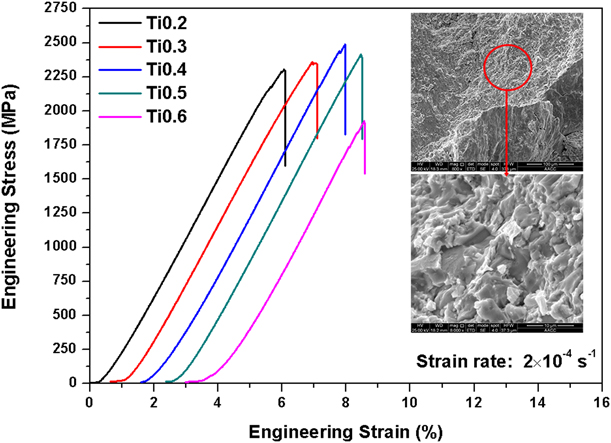
Compressive engineering stress versus engineering strain curves for the CrFeNiTix alloys at room temperature are plotted in Fig. 6, and Table III presents the mechanical test results of CrFeNiTix alloys. From the stress strain curves of the CrFeNiTix alloys with an increasing Ti content, plastic strain of CrFeNiTix alloys is basically unchanged, but the strength climbs up and then declines with an increasing Ti content. The deformation of metal material mainly depends on the dislocation motion and the crystal slip plane. All the factors that can increase the slip resistance will increase the deformation resistance and strengthen the material. After the alloy element is dissolved into the lattice of the base metal, it not only distorts the lattice, but also increases the dislocation density. And this nail turn effect on the grain boundary will hinder dislocation motioning and sliding; when Ti content increases to 0.4, the amount of (Ni, Ti)-rich intermetallic is precipitated, thus improving the strength of the alloy.
Room temperature mechanical test results of CrFeNiTix alloys.

However, once Ti content is too much, it will lead to excessive precipitation of (Ni, Ti)-rich intermetallic; the negative effect is greater than the intermetallic reinforcement, and alloy plasticity and strength will be reduced at this time. As shown by the curve in Fig. 6, there is no obvious yielding stage in CrFeNiTix alloys, and the deformation after fracture can only reach approximately 6.5%, which suggests that high Ti content can improve the compressive strength, but decrease the alloy ductility to some degree, while Ti content is over 0.4. It is due to the complex second or third phase on the boundaries that will result in decrease in binding force, particularly brittle (Ni, Ti)-rich intermetallic. It is noted that the Ti0.4 alloy still shows a high compressive strength of 2475.41 MPa and an acceptable plastic strain of 6.5%. In addition, SEM micrographs of fracture surface of CrFeNiTi0.6 alloy are shown in Fig. 7. It can be seen that the rock or the ice-sugar shaped fracture is formed, which presents the typical intergranular fracture. Under the action of external stress, these reticular brittle phases will directly bear the load, resulting in forming cracks and extending along the grain boundary.
The compressive engineering stress–strain curves of CrFeNiTix alloys at room temperature.
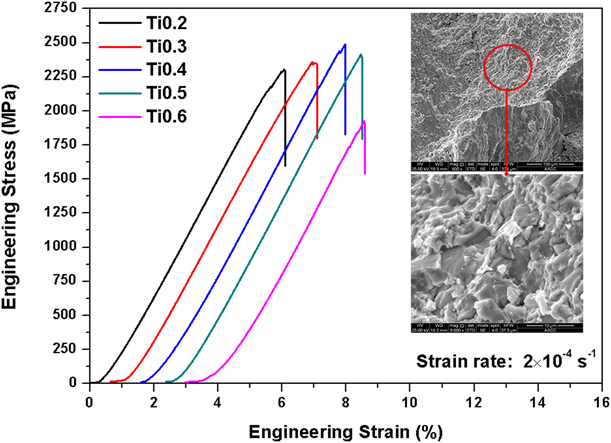
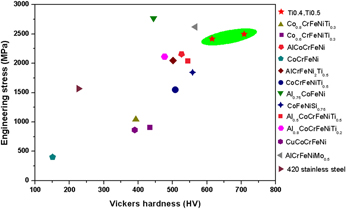
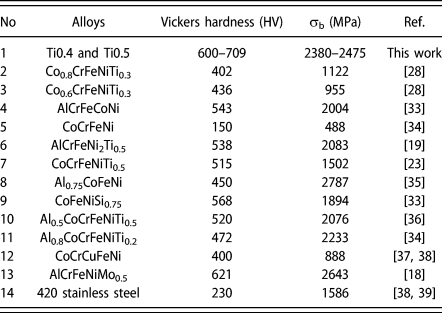
Figure 8 demonstrates engineering stress versus Vickers hardness map of some typical HEAs and commercial-grade high-strength stainless steels at room temperature, and data are listed in Table IV. Compared with other alloy systems, hardness and fracture strength of Ti0.4, especially Ti0.5 alloy, is superior to most of the HEAs and commercial-grade high-strength stainless steels. Ti0.4 and Ti0.5 alloys exhibit great potential use in the structural material with high hardness and high strength. Meanwhile, Ti0.4 and Ti0.5 alloys have fewer elements, and the cost of alloys is lower compared with other alloys, as listed in Table III. There is no denying that Ti0.4 and Ti0.5 alloys have not reached a satisfactory plastic strain and excessive Ti addition will be counterproductive and reduce alloy plasticity. However, solution strengthening and precipitate hardening play important roles in improving the microstructure and mechanical properties of CrFeNiTix alloys.
Engineering stress versus Vickers hardness map of some typical HEAs and commercial-grade high-strength stainless steels at room temperature.
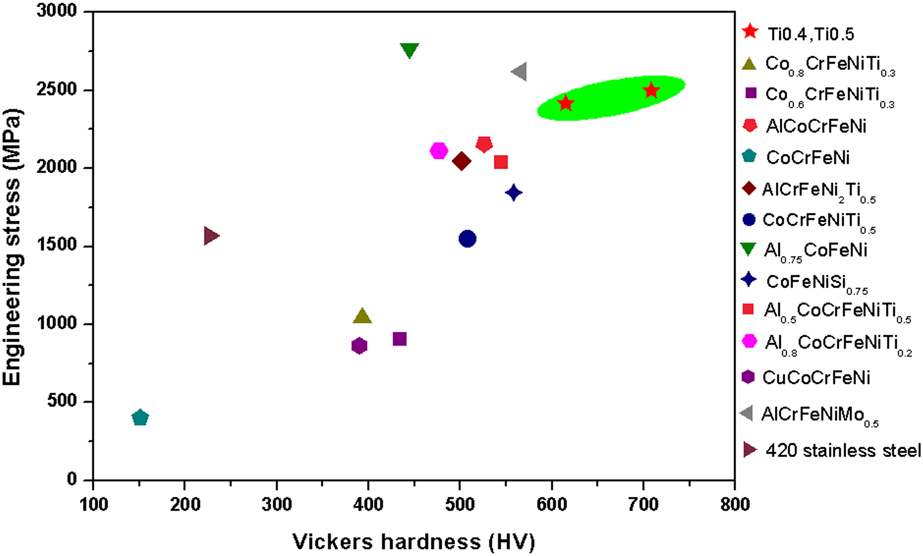
Compressive properties and Vickers hardness of as-cast Ti0.4 and Ti0.5 alloys compared with some typical HEAs and commercial-grade high-strength stainless steels at room temperature.

It is concluded that proper Ti addition in CrFeNiTix alloys can improve the compressive strength and hardness to some degree, but excessive Ti addition will be counterproductive and make the alloy brittle. In addition, from Fig. 8, it is implied that, to get better mechanical properties, systematic optimization of elements ratio of Ti and Al is needed to achieve an optimum combination of properties. Future work in the second phase along with grain refinement will be useful to design new alloys to enhance properties.
Conclusions
In summary, the microstructure and mechanical properties of CrFeNiTix (x = 0.2 to 0.6) CCAs were studied in the present work, and the following conclusions were drawn:
(1) CrFeNiTix alloys mainly consisted of FCC + BCC solid solutions and HCP (ε + R) intermetallic mainly. With an increasing content of Ti, FCC solid solution was reduced and BCC phase was strengthened. Meanwhile, content of ε phase was increased in Ti0.3, Ti0.4, Ti0.5, and Ti0.6 alloys, while ε phase transformed into R phase gradually with increasing Ti content.
(2) CrFeNiTix alloys exhibited the typical dendrite structure. Dendrite was mainly composed of FCC solid solution, and HCP intermetallic mainly existed in the inter-dendrite. When Ti content exceeded 0.3, it would produce an obvious transition zone between BCC phase and HCP phase. Additionally, CrFeNiTi0.4 alloy consisted of FCC phase containing (Ni, Ti)-rich intragranular nanoprecipitates in dendritic region, which shows that precipitation strengthening contributes to the high strength.
(3) The hardness of CrFeNiTix alloys was increased from 389 to 718.2 HV with Ti addition, which was attributed to the solid solution strengthening and precipitation hardening. The compressive strength of CrFeNiTix (0.2–0.6) alloy was from 1923.15 to 2475.41 MPa, and addition of a small amount of Ti could improve its compressive strength. Once excess, the metal became brittle, and its compression strength and deformation rate would obviously decrease. At the same time, compared with other HEAs, this alloy had some obvious advantages in strength and hardness.
Experimental
The purity of all raw elemental metals (Cr, Fe, Ni, Ti) were above 99.95 weight percent, and the ingots of CrFeNiTix (x: molar ratio, x = 0.2, 0.3, 0.4, 0.5, and 0.6 denoted by Ti0.2, Ti0.3, Ti0.4, Ti0.5, and Ti0.6, respectively) alloys were synthesized by vacuum arc melting in the Ti-gettered high-purity argon atmosphere. These ingots were remelted at least four times to ensure the homogeneity of alloys in a water-chilled copper mold. The structural analysis of the samples was examined via X-ray diffraction (XRD, D8 Advance, Bruker, Karlsruhe, Germany) with Cu Kα radiation with the 2θ scan from 10 to 90°, at a scanning speed of 5°/min, voltage of 30 kV, and current of 40 mA. In addition, all specimens were ground, polished, and etched using a solution of 2 mL HF + 4 mL HNO3 + 25 mL H2O to analyze the microstructure via scanning electron microscope (SEM; FEI Quanta TM 250; Thermo Fisher Scientific, Hillsboro, Oregon) equipped with an energy-dispersive X-ray spectrometer (EDS). Thin foil specimen of CrFeNiTi0.4 alloy was observed using the transmission electron microscopy (TEM; FEI Tecnai G2 F20; Thermo Fisher Scientific, Hillsboro, Oregon) with energy-dispersive X-ray spectroscopy (EDX).
The differential scanning calorimeter (DSC; STA449 F5; NETZSCH, Selb, Germany) was used at the heating rate of 20 °C/K, under the atmosphere of Ar. The room temperature hardness measurements were performed using a Vickers hardness tester (HVS-1000) under a load of 1000 gf for 15 s. Seven measurements were taken of each sample to obtain averaged experimental data. Samples of Ø 5 × 10 mm for compressive tests were carried out at room temperature using a Material Testing Machine (UTM5305; YOUHONG Measurement and Control. Technology Co., Ltd., Shanghai, China) with a strain rate of 2 × 10⁻⁴ s−1.
Acknowledgments
The research was supported by the National Natural Science Foundation of China (Nos. 51671214 and 51871238), Science-technology Program of Xuzhou (KC18075) and Teaching Reform Program of CUMT (YJSJG-2018-003).