In the late 1990s, decreasing resources led many hospitals to shift from hospital-wide to targeted surveillance, which was codified in the 1998 National Nosocomial Infections Surveillance (NNIS) surveillance definitions.Reference Klevens, Edwards and Richards 1 , Reference Calfee and Farr 2 Targeted surveillance focuses on specific healthcare-associated infections (HAIs) (eg, device-associated infections, surgical-site infections [SSIs], and laboratory-based infections due to Clostridium difficile and methicillin-resistant Staphylococcus aureus) and high-risk areas (eg, intensive care units, [ICUs]) within the hospital. Infection prevention and control efforts have greatly reduced the incidence of HAIs, especially device–associated infections such as central-line–associated bloodstream infection (CLABSI), ventilator-associated pneumonia (VAP), and catheter-associated urinary tract infection (CAUTI).Reference Yokoe, Mermel and Anderson 3 – Reference Anderson, Miller and Chen 5 However, longitudinal trends among all HAIs, including non–device-associated HAIs, other types of HAI, and HAIs outside of ICUs, remain unknown since many hospitals do not implement comprehensive hospital-wide surveillance.
At the University of North Carolina (UNC) Hospitals, we have conducted comprehensive hospital-wide surveillance for all HAIs in accordance with the Centers for Disease Control and Prevention (CDC) criteria since 1978. In this study, we investigated the trends and incidences of all HAIs, including bloodstream infection (BSI), urinary tract infection (UTI), respiratory tract infection (RTI), SSI, and other types of HAI. Furthermore, we assessed outcomes (ie, HAIs prevented, lives saved, and cost savings) as a result of our infection control activities over the last decade.
Methods
This study was conducted at UNC Hospitals, an 806-bed tertiary care academic facility using the Hospital Epidemiology HAI data for 12 years from 2001 to 2012. Comprehensive hospital-wide surveillance for all HAIs that included all CDC-defined sites was performed through a chart review of each patient in accordance with CDC criteria as recommended that year 6 by 5 infection preventionists and 3 full-time faculty members. Sources for HAI identification included laboratory reports of positive culture results, results of serological testing or molecular-based diagnostic tests, morbidity and mortality conferences, autopsies, and reports of infections from clinics and physicians. For analyses by unit category within UNC Hospitals, all HAIs and units were classified as ICUs or non-ICUs. Step-down units were classified as non-ICUs because those units had infection rates more similar to those of general wards than those of the ICUs.Reference Weber, Sickbert-Bennett, Brown and Rutala 7 According to CDC criteria, all HAIs were categorized as 1 of the following 5 major infections with 14 specific infection sites: BSIs, UTIs, RTIs (pneumonia; lower respiratory tract infections [LRTIs]), SSIs, and other types of HAI (gastrointestinal infections; eye, ear, nose, throat, or mouth infections; skin and soft-tissue infections; cardiovascular system infections; bone and joint infections; central nervous system infections; reproductive tract infections; systemic infections). 6 All surveillance data regarding HAIs during the study period were entered into an electronic database.
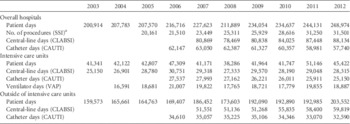
Relative proportions were calculated as each infection site versus all HAIs per year that were available from 2001 to 2012. Incidences of device-associated infection (CLABSI, VAP, and CAUTI) were calculated as infections per 1,000 device days and SSI incidence was calculated as infections per 100 procedures. Incidences of HAIs other than these device-associated infections and SSI were calculated as the number of HAIs per 1,000 patient days. Denominator data were collected according to CDC criteria 8 and were classified into the same infection site and unit category as the numerator data. Denominators for the incidences were available in the following areas and periods (the first year listed was considered the baseline year): patient days at overall hospitals, ICUs, and non-ICUs in 2003–2012; central-line days at ICUs in 2003–2012 and at overall hospitals and non-ICUs in 2007–2012; ventilator days at ICUs in 2004–2012; catheter days at overall hospitals, ICUs, and non-ICUs in 2006–2012; and procedures at overall hospitals in 2005–2012 (Table 1).
A List of Denominator Data Used to Calculate Incidences of Healthcare-Associated Infections (HAIs) in this Study

a Throughout, the parentheses indicate denominators used to calculate incidences of specific HAI.
NOTE. SSI, surgical site infection; CLABSI, central line-associated bloodstream infection; CAUTI, catheter-associated urinary tract infection; VAP, ventilator-associated pneumonia.
We estimated the annual number of HAIs prevented through our infection control activities in each year by calculating the risk reduction from the difference in incidences between the given year and the last year, and then we calculated the average annual number of HAIs prevented and the total number of HAIs prevented over the last decade. We also estimated the number of lives saved by multiplying the estimated number of infections prevented by the case fatality rates of specific HAIs and overall,Reference Klevens, Edwards and Richards 1 , Reference Umscheid, Mitchell, Doshi, Agarwal, Williams and Brennan 9 and we calculated the cost savings using low and high cost estimates as previously described (Online Table S1).Reference Anderson, Miller and Chen 5 , Reference Scott 10
SAS® version 9.3 (SAS Institute Inc., Cary, NC, USA) was used for statistical analysis. Generalized linear models were used to examine the incidence rate difference by infection type over time. Statistical significance was calculated by comparing these regression lines to a line with a zero slope. P<.05 was considered statistically significant. This study was approved by the Institutional Review Board of UNC Chapel Hill (IRB No. 06-0437).
Results
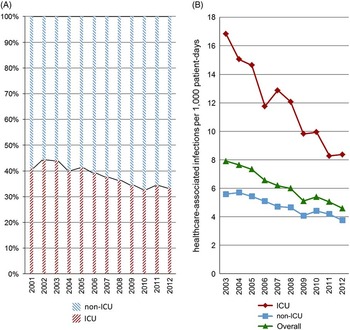
Of a total of 16,579 HAIs that occurred during the 12-year study period, 6,397 HAIs occurred in ICUs (33%–44% of all HAIs each year) and 10,182 HAIs occurred in non-ICU settings (56%–67% of all HAIs each year) (Figure 1). The incidence of overall HAIs throughout UNC Hospitals decreased significantly from 7.90 in 2003 to 4.60 in 2012 infections per 1,000 patient days (ie, 42% reduction, incidence rate difference=−3.39, P<.001).
Relative proportion (A) and incidences (B) of all healthcare-associated infections (HAIs) in intensive care units (ICUs) and outside of ICUs at University of North Carolina (UNC) Hospitals, 2001–2012. In ICU settings, HAI incidence fell from 16.84 to 8.37 infections per 1,000 patient days (50% reduction, incidence rate difference=−8.39, P<.001). In non-ICU settings, the HAI incidence fell from 5.58 to 3.75 infections per 1,000 patient days (33% reduction, incidence rate difference=−1.92, P<.001).

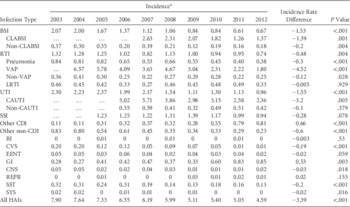
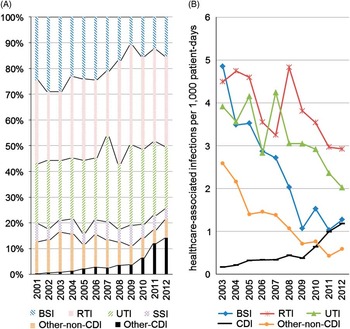
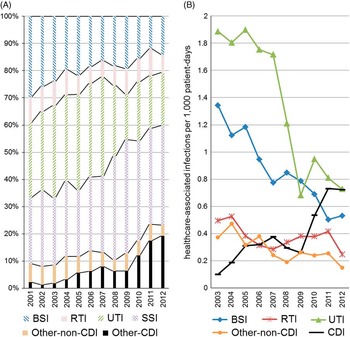
Relative proportion of HAIs by major infection site and incidences of HAIs by specific infection site in overall UNC Hospitals are provided in Figure 2 and Table 2. Overall at UNC Hospitals, the relative proportions of BSI and UTI decreased by 13% and 5%, and the incidence of RTI remained unchanged, but the incidences of SSI and C. difficile infection (CDI) increased by 9% and 16%, respectively. The relative proportion of other types of HAI approximately doubled throughout UNC Hospitals from 2001 to 2012. Overall at UNC Hospitals, the incidence rate difference for BSI was −1.53 infections per 1,000 patient days (P<.001); for pneumonia the incidence rate difference was −0.50 infections per 1,000 patient days (P<.001); and for UTI the incidence rate difference was −1.55 infections per 1,000 patient days (P<.001). However, the incidence rates of LRTI, SSI, and other types of HAI remained unchanged. In other types of HAI, the incidence rate differences for cardiovascular system infections, gastrointestinal infections, and skin and soft-tissue infections were −0.19 (P<.001), +0.53 (P=.003), and −0.20 (P<.001) per 1,000 patient days, respectively. The incidences of bone and joint infection, eye, ear, nose, throat, or mouth infections, central nervous system infection, reproductive tract infection, and systemic infection in overall UNC Hospitals were <0.1 infections per 1,000 patient days. The incidence rate differences for CLABSI, VAP, and CAUTI were −1.39 (P=.001) infections per 1,000 central-line days, −4.52 (P<.001) infections per 1,000 ventilator days, and −3.20 (P=.005) infections per 1,000 catheter days, respectively. Thus, there was a striking reduction in such device-associated infections. Importantly, the incidence of CDI increased significantly from 0.11 in 2003 to 0.81 in 2012 per 1,000 patient days throughout UNC Hospitals (ie, a 636% increase, incidence rate difference=+0.66, P<.001), and this rate surged notably from 2010 despite no change in surveillance criteria and detection methods for CDI.
Relative proportion (A) and incidences (B) of healthcare-associated infections (HAIs) by major infection site overall in University of North Carolina (UNC) Hospitals, 2001–2012. BSI, bloodstream infection; RTI, respiratory tract infection; UTI, urinary tract infection; SSI, surgical site infection; CDI, Clostridium difficile infection. Incidence of SSI was calculated as infections per 100 procedures.

Overall Incidences of Healthcare-Associated Infections (HAIs) by Specific Infection Site in UNC Hospitals, 2003–2012

NOTE. BSI, bloodstream infection; CLABSI, central-line–associated bloodstream infection; RTI, respiratory tract infection; Pneumonia, pneumonia; VAP, ventilator-associated pneumonia; LRTI, lower respiratory tract infection; UTI, urinary tract infection; CAUTI, catheter-associated urinary tract infection; SSI, surgical site infection; CDI, Clostridium difficile infection, BJ, bone and joint infection; CVS, cardiovascular system infection; EENT, eye, ear, nose, throat, or mouth infection; GI, gastrointestinal infection; CNS, central nervous system infection; REPR, reproductive tract infection; SST, skin and soft-tissue infection; SYS, systemic infection.
a Incidences of device-associated infections (CLABSI, VAP, and CAUTI) and SSI were calculated as infections per 1,000 device days and infections per 100 procedures, respectively. Incidences of HAI except those device-associated infections and SSI were calculated as the number of infections per 1,000 patient days. The data (…) were not available.
Figure 3 shows the relative proportion of HAIs by major infection site and incidences of HAIs by specific infection site in ICUs. In the ICU settings, the relative proportion of BSI decreased by 9%, and RTI, UTI, and SSI rates remained unchanged, but the CDI rate increased by 14%. The relative proportion of HAIs by major infection site and incidences of HAIs by specific infection site outside of the ICUs are shown in Figure 4. In non-ICU settings, the relative proportions of BSI and UTI decreased by 16% and 8%, and RTI rates remained unchanged, but SSI and CDI rates increased by 12% and 17%, respectively.
Relative proportion (A) and incidences (B) of healthcare-associated infections (HAIs) by major infection site in intensive care units (ICUs), 2001–2012. The incidence rate differences for BSI, pneumonia, and UTI were −3.57 (P<.001), −1.96 (P<.001), and −1.75 (P=.006) infections per 1,000 patient days, respectively, but the incidence rate for lower respiratory tract infection remained unchanged. In other types of HAI, the incidence rate differences for cardiovascular system infection; eye, ear, nose, throat, or mouth infection; gastrointestinal infection; central nervous system infection; and skin and soft-tissue infection were −0.66 (P<.001), −0.05 (P=.45), +0.51 (P=.05), −0.13 (P=.07), and −0.69 (P<.001), respectively. The incidence the categories of bone and joint infection, reproductive tract infection, or systemic infection in the ICU settings each was <0.1 infections per 1,000 patient days. BSI, bloodstream infection; RTI, respiratory tract infection; UTI, urinary tract infection; SSI, surgical site infection; CDI, Clostridium difficile infection.

Relative proportion (A) and incidences (B) of healthcare-associated infections (HAIs) by major infection site outside of intensive care units (ICUs), 2001–2012. The incidence differences for BSI, pneumonia, and UTI, were −0.79 (P<.001), −0.13 (P=.006), and −1.41 (P<.001) infections per 1,000 patient days, respectively, but lower respiratory tract infection remained unchanged. In other types of HAI, the incidence rate differences for gastrointestinal infection and skin and soft-tissue infection were +0.50 (P=.002) and −0.13 (P=.03), respectively. Respective incidences of bone and joint infection; cardiovascular system infection; eye, ear, nose, throat, or mouth infection; central nervous system infection; reproductive tract infection; and systemic infection in non-ICU settings were <0.1 infections per 1,000 patient days. BSI, bloodstream infection; RTI, respiratory tract infection; UTI, urinary tract infection; SSI, surgical site infection; CDI, Clostridium difficile infection.

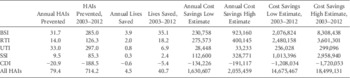
The estimated number of HAIs prevented, lives saved, cost savings at UNC Hospitals over the last decade are summarized in Table 3. We estimate that the surveillance and infection control measures implemented at UNC Hospitals prevented 714 overall HAIs, 285 BSIs, 126 RTIs, 297 UTIs, and 85 SSIs. We estimate that over the last decade, 41 overall HAI deaths were prevented, as well as 35 deaths from BSI, 18 from RTI, 7 from UTI, and 2 from SSI. In total, UNC Hospitals saved $1.6–$2.1 million per year, with cumulative savings of $14.7–$18.5 million over the last decade. In contrast, UNC Hospitals recorded more than 189 other HAIs associated with CDI during the study period, with an estimated cost of $1.2–$1.7 million.
The Estimated Number of Healthcare-Associated Infections (HAIs) Prevented, Lives Saved, and Cost Savings at University of North Carolina (UNC) Hospitals, 2003–2012Footnote a

NOTE. BSI, bloodstream infection; RTI, respiratory tract infection; UTI, urinary tract infection; SSI, surgical site infection; CDI, Clostridium difficile infection.
a The estimates were calculated using data from Online Table S1.
Discussion
A recent, large prevalence study by Magill et alReference Magill, Edwards and Bamberg 11 reported that the most common types of HAI were SSI, pneumonia, and gastrointestinal infection (principally CDI). Other data from the same year, 2011, were similar, with high prevalences of SSI, RTI, and CDI. However, our study, which assessed incidence rates of HAIs over time, extends the finding of Magill et al by demonstrating success in reducing overall HAI rates throughout the UNC Hospital system over the last decade, especially in ICU settings, and we have provided further evidence of the necessity for infection prevention efforts in non-ICU inpatient units.
Many hospitals have shifted to targeted surveillance (eg, in the ICUs or for specific HAIs such as CLABSI, VAP, CAUTI, and SSI), but recent data on hospital-wide HAIs, including non-ICU patients, are scarce. Hospital-wide HAIs may be underestimated by targeted surveillance because such surveillance detects HAIs only in high-risk areas (eg, ICUs), on specific units, associated with certain services, or at specific infection sites (eg, device-associated HAIs). Our previous study showed that targeted surveillance missed approximately 50% of HAIs that are not included in published NHSN reports, compared with comprehensive hospital-wide surveillance (ie, all hospital units, all HAIs).Reference Weber, Sickbert-Bennett, Brown and Rutala 12 Other studies that focused only on CLABSI have described the burden of these infections outside the ICUs.Reference Lempp, Cummings and Birnbaum 13 – Reference Kallen, Patel and O’Grady 15
As a result of comprehensive hospital-wide surveillance and infection control measures over the last decade, the outcomes at UNC Hospitals during the study period were estimated as 700 overall HAIs prevented, 40 lives saved, and cost savings of more than $10 million. Our hospital-wide surveillance was conducted by 2.4 professional full-time equivalents (FTEs) and 5 infection preventionist FTEs in the UNC Hospital system (860 beds: 171 ICU beds and 689 non-ICU beds). Staff changed occasionally. According to a survey to members of the Society for Healthcare Epidemiology of America,Reference Wright, Ostrowsky, Fishman, Deloney, Mermel and Perl 16 the median numbers of physician FTEs and infection control practitioner FTEs in facilities larger than 600 beds were 1.00 (range, 0–10) and 3.9 (range, 0.13–6.1), respectively. Staff allocation to implement surveillance in our hospital was likely to be affordable and within the range of the survey results. Although there was concern regarding the incremental workload cost of HAI surveillance, our labor costs corresponded to less than half the annual cost saved based on physician earnings ($151,000–$200,000) and infection preventionist earnings ($69,339–$99,024) by region.Reference Wright, Ostrowsky, Fishman, Deloney, Mermel and Perl 16 , 17
The frequencies of other types of HAI due to CDI and non-CDI doubled in 2012. We previously described “other” types of HAI and pathogens causing such infections.Reference Kanamori, Weber, Sickbert-Bennett, Brown, Kaku and Rutala 18 This study provides further details regarding incidences of 8 specific “other” types of HAI in both ICU and non-ICU settings at UNC Hospitals over the last decade. For CDI, an additional 20 other HAI types were associated with costs of more than $100,000 per year. Gastrointestinal infections are now increasing, and C. difficile was our most common healthcare-associated pathogen at UNC Hospitals in this study (2001–2012) and our previous study.Reference Kang, Sickbert-Bennett, Brown, Weber and Rutala 19 A recent national prevalence survey described the importance of surveillance of other HAIs, including gastrointestinal infections due to C. difficile (12.1%) in the United States in 2011.Reference Magill, Edwards and Bamberg 11 At our hospital, the incidences of cardiovascular system infections and skin and soft-tissue infections were significantly reduced, but because of the very low number of infections, the following incidences were not evaluated: bone and joint infections; eye, ear, nose, throat, or mouth infections; central nervous system infections; reproductive tract infections; and systemic infections. Our data regarding HAI incidence over the last decade underscore the fact that “other” HAIs constitute a substantial burden that requires further strategies for infection prevention and control, especially for CDIs. In addition to rigorous contact precautions and improved environmental cleaning/disinfection, new technologies, such as “no-touch” methods for room disinfection (eg, hydrogen peroxide, ultraviolet light), are promising.Reference Weber, Anderson, Sexton and Rutala 20 Transmission dynamics of CDI need to be further elucidated to aid in control.Reference Loo, Bourgault and Poirier 21 , Reference Eyre, Cule and Wilson 22
In this study, incidences of BSI, UTI, and pneumonia in hospital-wide settings decreased significantly, with dramatic reductions in the incidences of CLABSI (48%), VAP (73%), and CAUTI (53%), but the incidence of LRTI remained essentially the same over the last decade. To a greater or lesser extent, the trend was similar to that in ICU or non-ICU settings. Notably, CDC surveillance definitions have changed somewhat over time; these changes may have impacted on our incidence rates, although the direction and degree of impact is unclear (ie, whether the changes would lead to an increase or decrease in reported rates). We believe that these changes had only a minor effect on the dramatic decreases in HAI incidence.
Although current infection prevention strategies and control measures do not prevent all HAIs, Umscheid et alReference Umscheid, Mitchell, Doshi, Agarwal, Williams and Brennan 9 estimated that 65%–70% of CLABSI and CAUTI cases and 55% of VAP and SSI cases are preventable. Multiple intervention strategies have been implemented at UNC Hospitals to reduce CLABSIs, and a sustained reduction of CLABSI incidence in ICU was demonstrated during 1999–2008.Reference Weber, Brown, Sickbert-Bennett and Rutala 23 Such intervention strategies have been expanded to a hospital-wide program, which may result in a reduction of CLABSI incidence throughout the hospital, including outside the ICUs, as our data have shown. In addition to successful intervention strategies for CLABSI, we have conducted bundles of best practices and practice recommendations for CAUTI, VAP, and SSI. 24 , 25 Although prevention of SSI remains challenging in our hospital, rigorous and continuous bundled approaches of prevention strategies allow significant reduction of device-associated infections, which ultimately led to a reduction in overall HAIs over the last decade. Detailed descriptions of intervention strategies to control HAIs, including improved compliance with hand hygiene, new devices (eg, chlorhexidine patch for central IV sites), and new methods of terminal room disinfection (eg, UV light), are beyond the scope of this study.
Several studies have described the decreasing trend of the device-associated infections,Reference Yokoe, Mermel and Anderson 3 – Reference Anderson, Miller and Chen 5 , Reference DiBiase, Weber, Sickbert-Bennett, Anderson and Rutala 26 and currently, device-associated infections account for only 26% of HAIs in the United States.Reference Magill, Edwards and Bamberg 11 Importantly, the incidence of non-device infections, which are not currently assessed by NHSN, is not changing.Reference DiBiase, Weber, Sickbert-Bennett, Anderson and Rutala 26 Furthermore, our study showed that the incidence of SSI in hospital-wide settings remained unchanged (24% reduction only), and most SSIs occurred in non-ICU units after surgical procedures. Our data on SSI may not have included all SSIs after discharge and in outpatient clinics because follow-up of SSI is difficult, and no standard validated surveillance method exists. A survey in Washington State reported that 95% of acute care hospitals conducted post-discharge SSI surveillance by various methods without consistency among hospitals.Reference Zarate and Birnbaum 27 In the United States, the most common types of HAI were SSI (21.8%) and pneumonia.Reference Magill, Edwards and Bamberg 11 Owens et alReference Owens, Barrett, Raetzman, Maggard-Gibbons and Steiner 28 reported that 90% of visits for SSIs after ambulatory surgery procedures involved treatment in the inpatient setting. Therefore, our data regarding HAI incidence over the last decade also highlight the importance of healthcare epidemiology and infection control for SSIs and non-device-associated infections including BSIs, RTIs, and UTIs.
In summary, we demonstrated the substantial reductions in HAIs, lives saved, and cost savings related to comprehensive hospital-wide HAI surveillance and infection control measures over the last decade. Point-prevalence surveys of HAIs at multiple centers have several limitations regarding representativeness and validation for data collection and the use of formula of prevalence to incidence conversions.Reference Magill, Edwards and Bamberg 11 , Reference Berthelot, Garnier and Fascia 29 Thus, this study, even at single tertiary care facility, has the strength of longitudinal data regarding all HAIs through comprehensive hospital-wide surveillance, including HAIs that could not be detected by targeted surveillance. Our study also provides new insight regarding HAIs outside ICUs as well as “other” HAIs, suggesting the necessity of further infection prevention and control efforts.
Acknowledgments
The authors thank Judie Bringhurst, Sherie Goldbach, Maria Gergen at Hospital Epidemiology, University of North Carolina Health Care, and Amy Powell, Kirk Huslage at Statewide Program for Infection Control and Epidemiology (SPICE), University of North Carolina, for their efforts and contributions.
Financial support. This study was supported by internal funding from UNC Health Care.
H.K. received financial support necessary for studying abroad from the Naito Foundation and the Kanae Foundation for the Promotion of Medical Science.
Potential conflicts of interest. All authors report no conflicts of interest relevant to this article.
Supplementary material
To view supplementary material for this article, please visit http://dx.doi.org/10.1017/ice.2015.142