1. Introduction
A reliable and accurate time scale is fundamental in most geological disciplines. Two independent but complementary lines of research are currently being developed to improve existing time scales. Firstly, the International Commission on Stratigraphy (ICS) and the International Union of Geological Sciences (IUGS) aim to define Global Stratotype Sections and Points (GSSPs) of the bases of all internationally agreed standard chronostratigraphic stages. Secondly, through the identification of sedimentary and physical cycles within the Milankovitch band, work is being done on the astronomical tuning of all chronostratigraphic units and events. Combining high-resolution stratigraphy and astronomical tuning provides unprecedented dating information. A complete astronomical polarity time scale has already been produced for the Neogene (Gradstein, Ogg & Smith, Reference Gradstein, Ogg and Smith2004; Hilgen, Brinkhuis & Zachariasse, Reference Hilgen, Brinkhuis and Zachariasse2006) and attempts have been made to extend it into certain parts of the Palaeogene (Pälike, Shackleton & Röhl, Reference Pälike, Shackleton and Röhl2001; Dinarès-Turell et al. Reference Dinarès-Turell, Baceta, Pujalte, Orue-Etxebarria and Bernaola2002, Reference Dinarès-Turell, Baceta, Pujalte, Orue-Etxebarria, Bernaola and Lorito2003, Reference Dinarès-Turell, Baceta, Bernaola, Orue-Etxebarria and Pujalte2007; Wade & Pälike, Reference Wade and Pälike2004; Kodama et al. Reference Kodama, Anastasio, Newton, Pares and Hinnov2010) and the Cretaceous (Grippo et al. Reference Grippo, Fischer, Hinnov, Herbert, Silva, D'Argenio, Fischer, Silva, Weissert and Ferreri2004; Wissler et al. Reference Wissler, Weissert, Buonocunto, Ferreri, D'argenio, D'Argenio, Fischer, Silva, Weissert and Ferreri2004). Unfortunately, there are some intervening intervals, such as parts of the Eocene, whose GSSP definition and astronomical polarity time scale are incomplete. The aim of this study, therefore, is to partially complete the gaps.
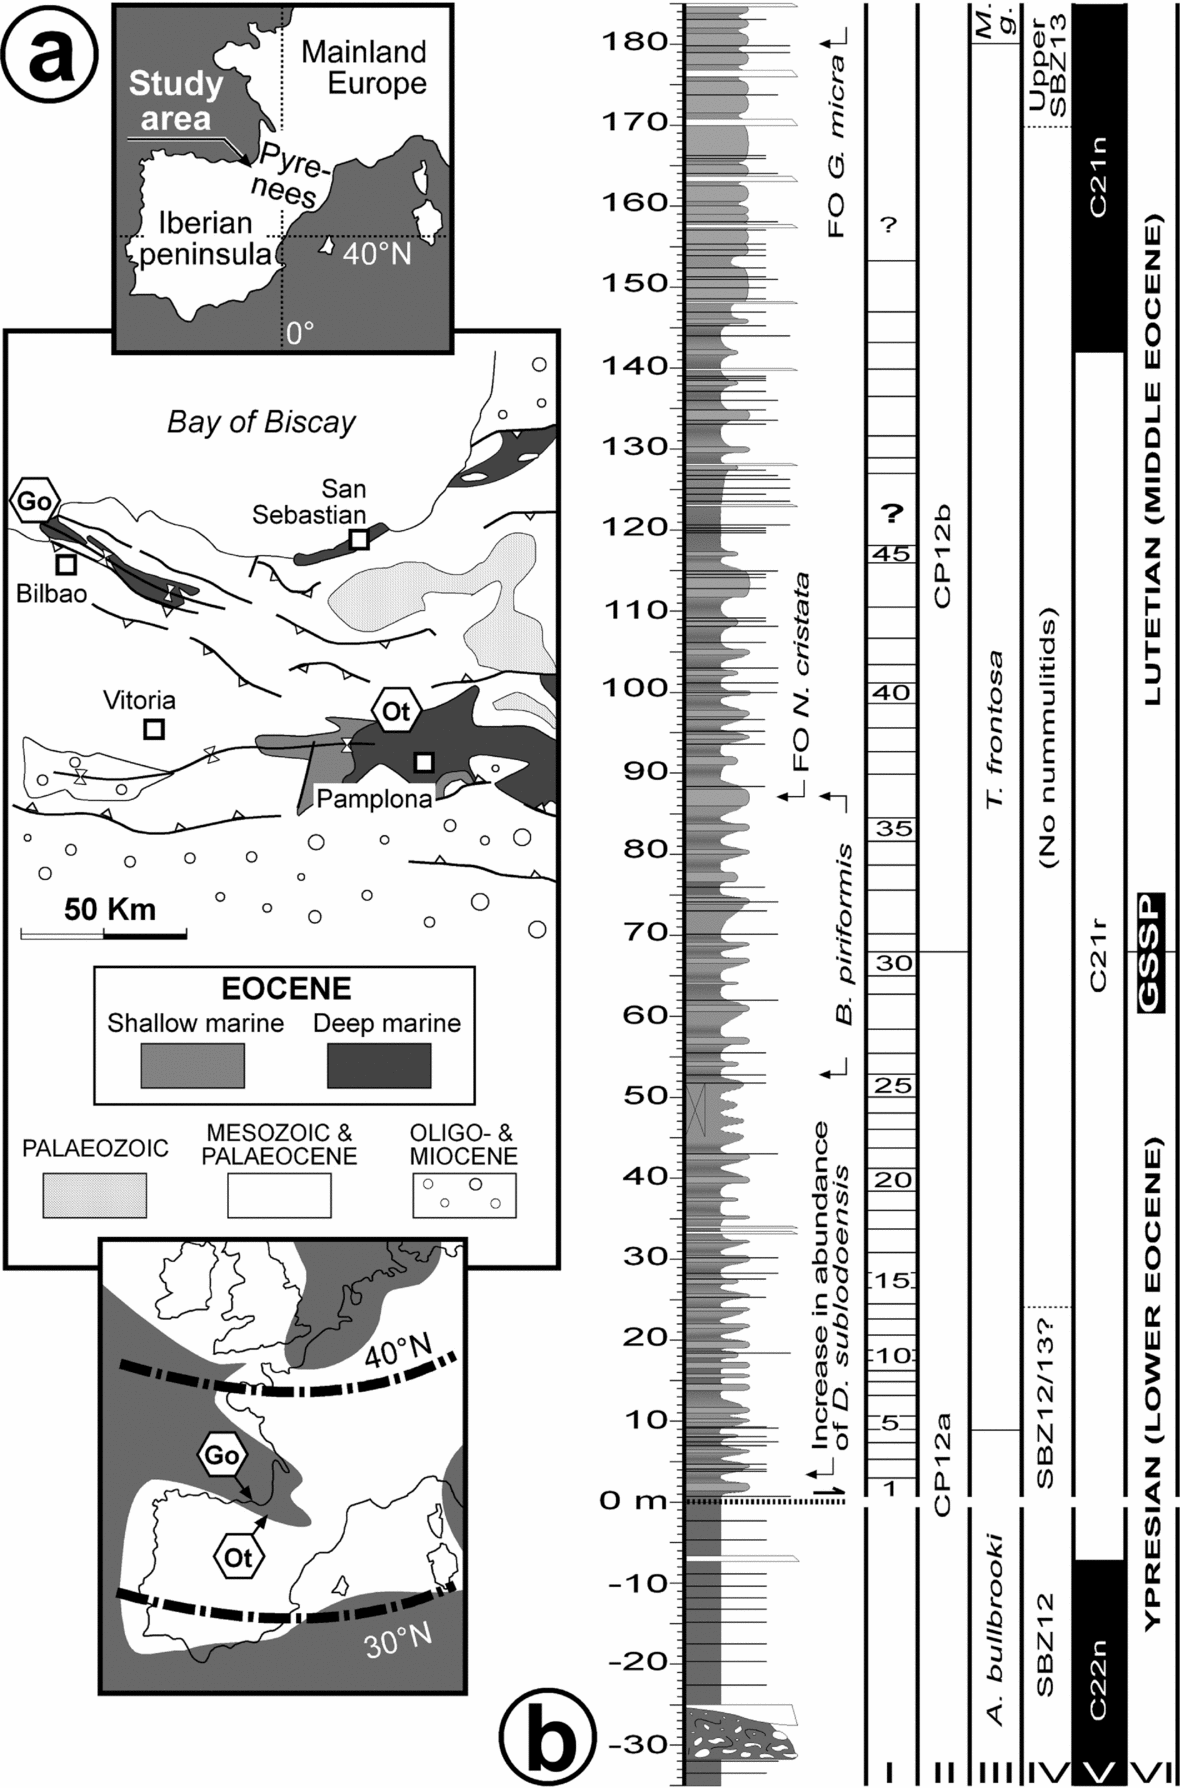
The ICS has already agreed on the defining criteria for both the base and top of the Eocene Epoch and their respective GSSPs have been ratified by the IUGS (base of the Eocene = Ypresian GSSP, 55.8 Ma, Aubry et al. Reference Aubry, Ouda, Dupuis, Berggren and Van Couvering2007; top of the Eocene = Rupelian GSSP, 33.9 Ma, Premoli Silva & Jenkins, Reference Premoli Silva and Jenkins1993; also see Gradstein, Ogg & Smith, Reference Gradstein, Ogg and Smith2004). However, none of the GSSPs of the Middle and Late Eocene stages (Lutetian, Bartonian and Priabonian) have been formally defined yet, their status being highly variable (see http://www.uni-tuebingen.de/geo/isps/). In a meeting held in September 2009 (Orue-Etxebarria et al. Reference Orue-Etxebarria, Payros, Caballero, Molina, Apellaniz and Bernaola2009), the Ypresian/Lutetian Boundary Stratotype Working Group of the Palaeogene Subcommission of the ICS unanimously agreed that the Lutetian GSSP (Early/Middle Eocene boundary) should be defined at Gorrondatxe (Basque Country, southern coast of the Bay of Biscay; Fig. 1), at the marl bed at 167.85 m that contains the first occurrence of the calcareous nannofossil Blackites inflatus, which is the marker taxon of the CP12a/b zonal boundary of Okada & Bukry (Reference Okada and Bukry1980). To date, this proposal is still awaiting formal ratification by the ICS and the IUGS (Molina et al. Reference Molina, Alegret, Apellaniz, Bernaola, Caballero, Hardenbol, Heilmann-Clausen, Larrasoaña, Luterbacher, Monechi, Ortiz, Orue-Etxebarria, Payros, Pujalte, Rodríguez-Tovar, Tori and Tosquella2009).
(a) Location of the Gorrondatxe (Go) section, Lutetian GSSP, and of the Otsakar (Ot) section studied herein. The lower map shows the palaeogeographic location of both areas in the Eocene Pyrenean Gulf. (b) Lithological log of the Gorrondatxe section. Numbers in Column I correspond to precession-driven mudstone–marl couplets, each of 21 ka (based on Payros et al. Reference Payros, Orue-Etxebarria, Bernaola, Apellaniz, Dinarès-Turell, Tosquella and Caballero2009a,Reference Payros, Orue-Etxebarria, Bernaola, Dinarès-Turell, Tosquella, Apellaniz, Caballero, Orue-Etxebarria, Payros, Caballero, Molina, Apellaniz and Bernaolab). Columns II (calcareous nannofossils), III (planktonic foraminifera; M. g. refers to M. gorrondatxensis), IV (nummulitids) and V (magnetostratigraphy) are based on Bernaola et al. (Reference Bernaola, Orue-Etxebarria, Payros, Dinarès-Turell, Tosquella, Apellaniz and Caballero2006), with further refinements by Payros et al. (Reference Payros, Orue-Etxebarria, Bernaola, Apellaniz, Dinarès-Turell, Tosquella and Caballero2009a,Reference Payros, Orue-Etxebarria, Bernaola, Dinarès-Turell, Tosquella, Apellaniz, Caballero, Orue-Etxebarria, Payros, Caballero, Molina, Apellaniz and Bernaolab). In addition to zonal boundary events, other significant biostratigraphic events are also shown. The Lutetian GSSP (Early/Middle Eocene boundary, Column VI) is located at the marl bed that contains the first occurrence of the calcareous nannofossil Blackites inflatus (CP12a/b boundary).

In addition to the main correlation criterion of the Lutetian GSSP (CP12a/b boundary), many other biomagnetostratigraphic events, including all that have traditionally been used to approach the Ypresian/Lutetian boundary, were pinpointed in Gorrondatxe (Orue-Etxebarria & Apellaniz, Reference Orue-Etxebarria and Apellaniz1985; Orue-Etxebarria et al. Reference Orue-Etxebarria, Payros, Bernaola, Dinarès-Turell, Tosquella, Apellaniz and Caballero2006; Bernaola et al. Reference Bernaola, Orue-Etxebarria, Payros, Dinarès-Turell, Tosquella, Apellaniz and Caballero2006; Payros et al. Reference Payros, Bernaola, Orue-Etxebarria, Dinarès-Turell, Tosquella and Apellaniz2007, Reference Payros, Orue-Etxebarria, Bernaola, Apellaniz, Dinarès-Turell, Tosquella and Caballero2009a,Reference Payros, Orue-Etxebarria, Bernaola, Dinarès-Turell, Tosquella, Apellaniz, Caballero, Orue-Etxebarria, Payros, Caballero, Molina, Apellaniz and Bernaolab; Molina et al. Reference Molina, Alegret, Apellaniz, Bernaola, Caballero, Hardenbol, Heilmann-Clausen, Larrasoaña, Luterbacher, Monechi, Ortiz, Orue-Etxebarria, Payros, Pujalte, Rodríguez-Tovar, Tori and Tosquella2009), facilitating thus the identification of the GSSP-based Ypresian/Lutetian boundary elsewhere. Furthermore, an astronomically controlled cyclostratigraphic framework was provided for the Ypresian/Lutetian boundary interval (Payros et al. Reference Payros, Orue-Etxebarria, Bernaola, Apellaniz, Dinarès-Turell, Tosquella and Caballero2009a,Reference Payros, Orue-Etxebarria, Bernaola, Dinarès-Turell, Tosquella, Apellaniz, Caballero, Orue-Etxebarria, Payros, Caballero, Molina, Apellaniz and Bernaolab), which allowed the high precision dating of most chronostratigraphic events with respect to the GSSP (Fig. 1b). The problem, however, is that the chronostratigraphic position of the GSSP level, which is located within magnetic polarity Chron C21r, a time interval of 1.364 Ma according to Gradstein, Ogg & Smith (Reference Gradstein, Ogg and Smith2004), could not be cyclostratigraphically calibrated with well-dated magnetostratigraphic events. Firstly, the underlying C22n/C21r chron boundary is separated from the GSSP-bearing succession by a fault, which causes the loss of an unknown thickness of the succession. Secondly, the age difference with the overlying C21r/C21n chron boundary could not be accurately calculated owing to the partial absence of astronomical cycles in a 24 m thick interval. This means that, although the age difference between successive chronostratigraphic events can be established in Gorrondatxe by means of cyclostratigraphy, their absolute ages cannot be determined. The only approach available to date was to assume that the 48 Ma age estimated for the CP12a/b zonal boundary (Gradstein, Ogg & Smith, Reference Gradstein, Ogg and Smith2004) was correct. However, it has long been acknowledged that this is one the most poorly dated Eocene events (Berggren et al. Reference Berggren, Kent, Swisher, Aubry, Berggren, Kent, Aubry and Hardenbol1995). In addition, the CP12a/b zonal boundary could not be calibrated with astronomical polarity time scales elsewhere, as this bioevent was not identified in the only available cyclostratigraphic study encompassing the whole Early Eocene (Westerhold & Röhl, Reference Westerhold and Röhl2009).
In the light of this scenario, the purpose of the present study is to try to solve the Early/Middle Eocene boundary age uncertainties elsewhere. With the aim of evaluating the potential of other Ypresian/Lutetian successions, pilot surveys were conducted in the Pyrenean area, which is well known for its expanded Eocene successions (Payros et al. Reference Payros, Tosquella, Bernaola, Dinarès-Turell, Orue-Etxebarria and Pujalte2009c). Based on that information we focused on the Otsakar section, which seemed to have the highest potential. Given the stratigraphic information available at the Lutetian GSSP of Gorrondatxe, a comparable study was undertaken in Otsakar, which included lithostratigraphy, sedimentology, sequence stratigraphy, biostratigraphy (planktonic foraminifera, calcareous nannofossils and nummulitids), magnetostratigraphy and cyclostratigraphy.
2. Otsakar: setting and stratigraphy
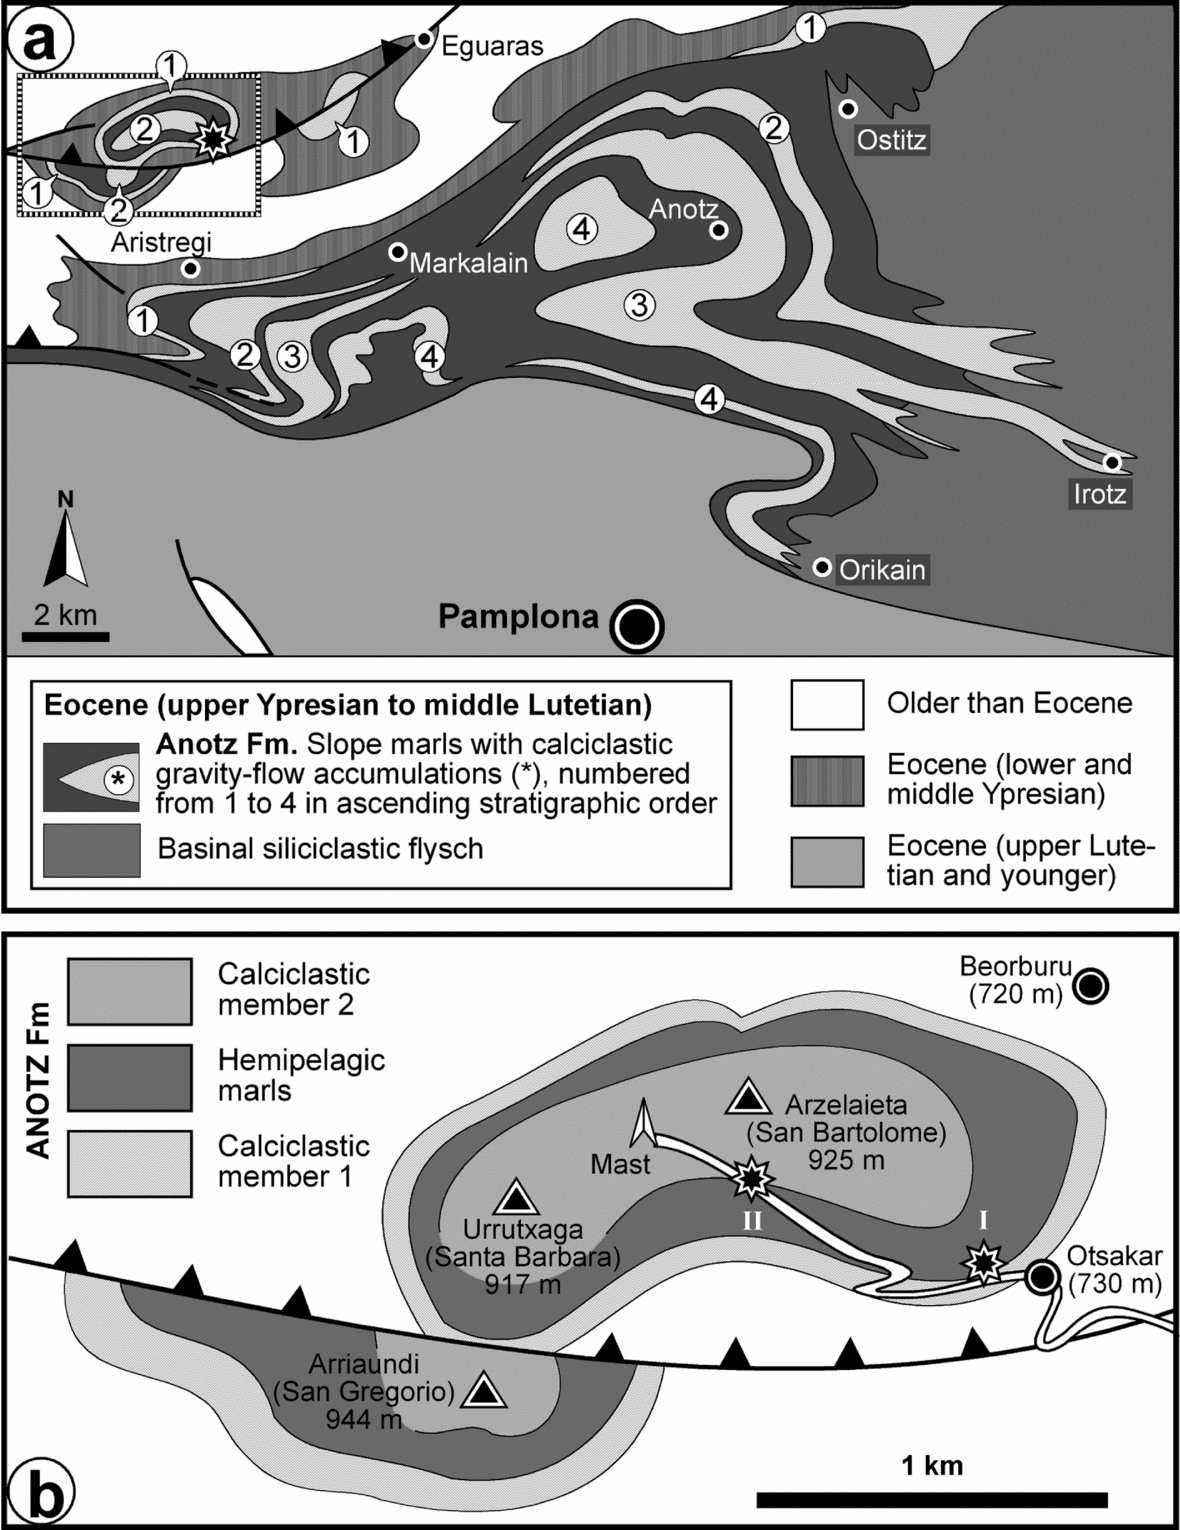
The Otsakar section is located 15 km northwest of Pamplona in the western Pyrenees (42° 55′ N, 1° 44′ W), approximately 120 km ESE of the Lutetian GSSP defined at Gorrondatxe (Figs 1a, 2). The Ypresian/Lutetian succession is exposed along a paved track that leads from Otsakar village to a telecommunication mast near a hill called Arzelaieta (also known as San Bartolome), the main outcrop being a soil-stripped, gullied hillside near the village (Fig. 2b, 3).
(a) Simplified geological map of the Pamplona region, type area of the Anotz Formation deposits that make up the Otsakar section. Location of the Otsakar section is shown with a black star. (b) Detailed geological map of the Anotz Formation in the Otsakar area (zone framed in (a)). The succession studied herein comprises the first calciclastic member of the Anotz Formation and the overlying hemipelagic interval, which are exposed along a paved track that leads from Otsakar to the mast near Arzelaieta. The main outcrop is located close to the village (site I), but the upper part of the succession is better exposed in site II.

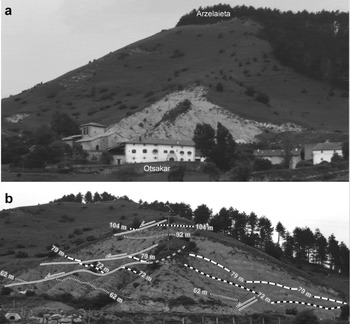
(a) General W–E view of Otsakar at the foot of Arzelaieta. The soil-stripped greyish hillside behind the village is the main outcrop studied here (site I in Fig. 2b), which exposes the hemipelagic deposits that separate the first and second calciclastic members of the Anotz Formation. (b) Close-up of the main outcrop. A detailed study revealed that it is affected by several normal faults. Despite the tectonic disturbance, a bed-by-bed succession was reconstructed by correlating distinctive beds (numbered in the photograph according to their position in the stratigraphic log shown in Fig. 4).

The succession corresponds to the basal part of the 1200 m thick Anotz Formation (A. Payros, unpub. Ph.D. thesis, Univ. Basque Country, 1997), which is mostly composed of marls and calciclastic deposits. Although calciclastic beds appear throughout the Anotz Formation, they are mostly concentrated in four discrete members, each up to hundreds of metres thick. The succession exposed along the Otsakar–Arzelaieta track displays the first (oldest) and second calciclastic members of the Anotz Formation, as well as the marly interval in between, but for the purpose of this study only the first calciclastic member and the overlying marly interval are considered (Fig. 4).
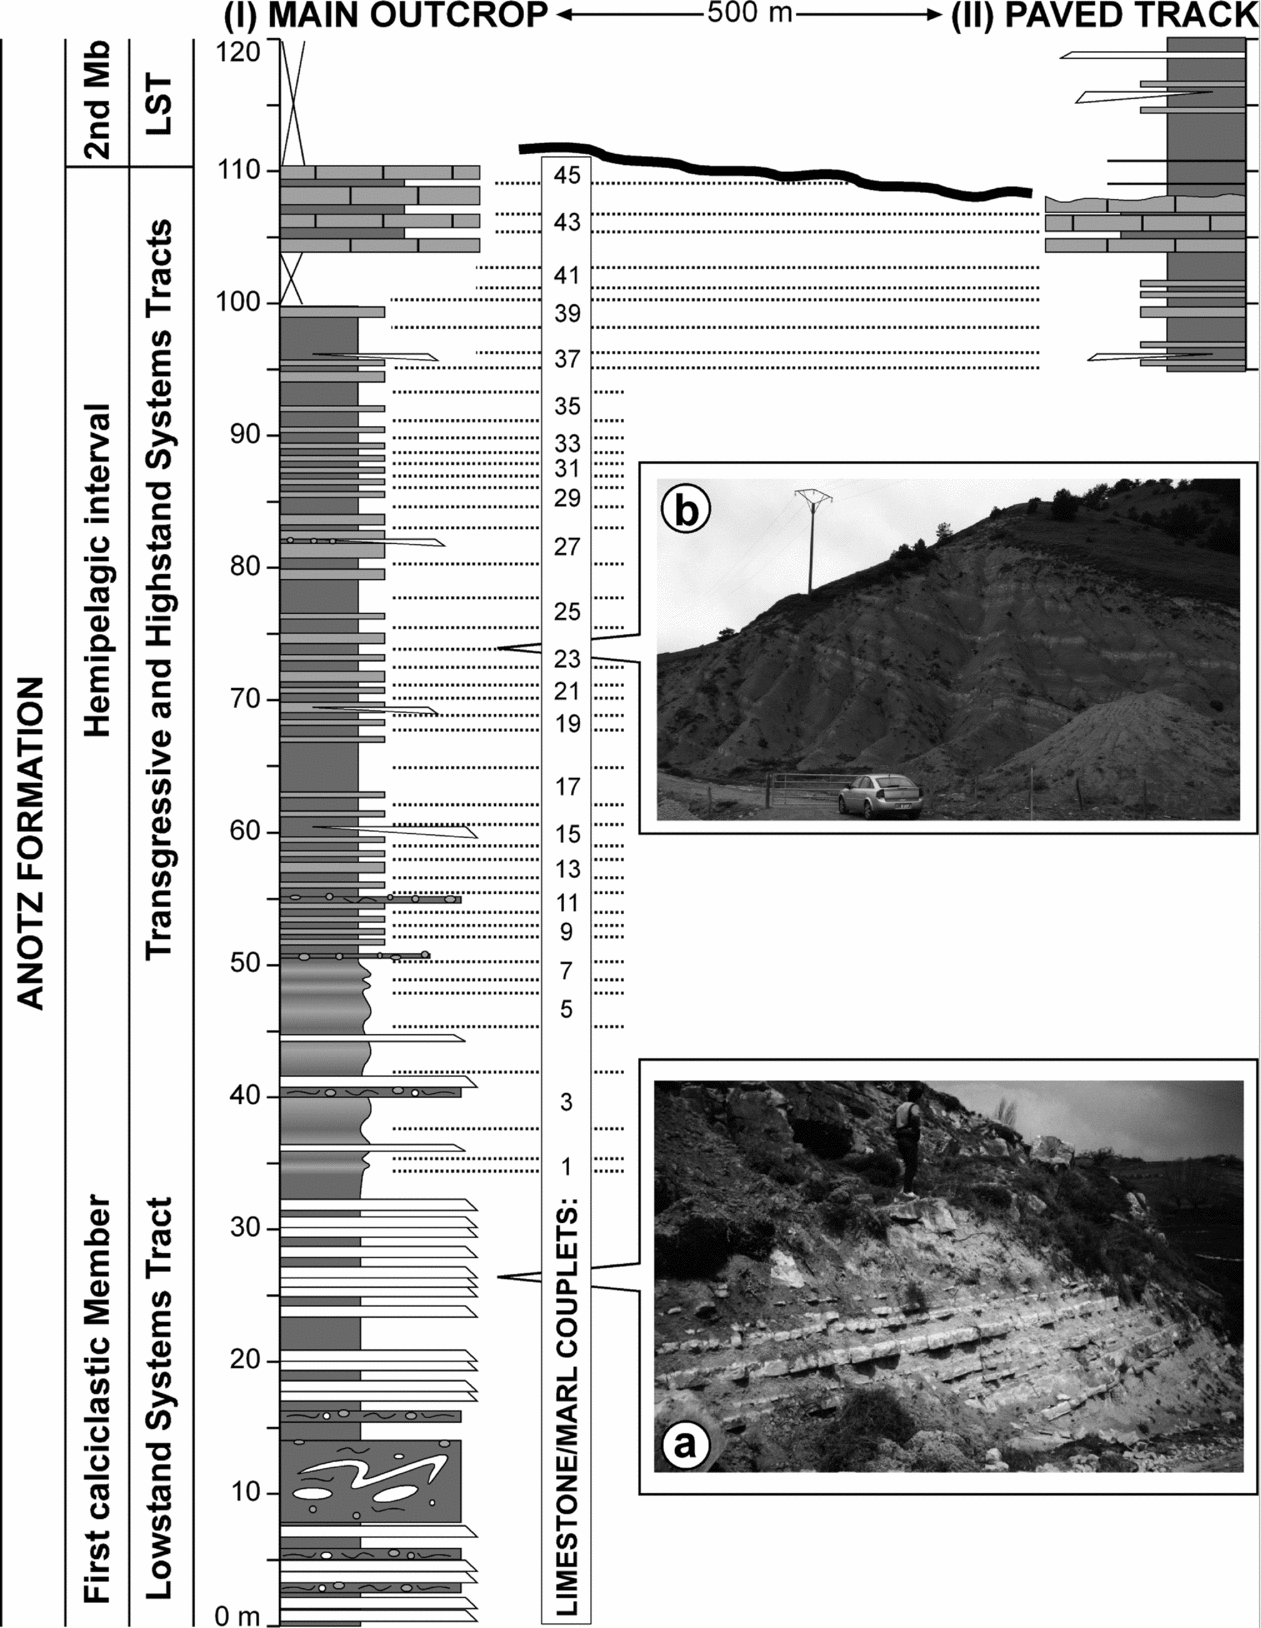
Detailed lithological logs of the 120 m thick succession studied in Otsakar, showing lithostratigraphy and sequence stratigraphy. Sections from the main outcrop and the paved track correspond to sites I and II in Figure 2b, respectively. White beds are calciclastic turbidites. Dark grey intervals are composed of hemipelagic marl. Light grey beds are composed of hemipelagic mudstone. Intervals with contorted beds and clasts represent slump and debris flow deposits. (a) Close-up of the calciclastic turbidites that make up the lower part of the Otsakar section. (b) Eastern part of the main outcrop, showing the cyclic character of the alternating hemipelagic marls and mudstones. Forty-five mudstone–marl couplets were identified (vertical white bar to the right of the main outcrop log).

The calciclastic members of the Anotz Formation were first interpreted as coastal and neritic deposits on the basis of their shallow-water fossil content, mostly larger foraminifers and red algae fragments (Carbayo, Leon & Villalobos, Reference Carbayo, León and Villalobos1978). However, these deposits were later reinterpreted as deep-water sediment gravity flow deposits, the shallow-water fossils merely being indicators of the type of source area (A. Payros, unpub. Ph.D. thesis, Univ. Basque Country, 1997; Payros, Pujalte & Orue-Etxebarria, Reference Payros, Pujalte and Orue-Etxebarria2003, Reference Payros, Bernaola, Orue-Etxebarria, Dinarès-Turell, Tosquella and Apellaniz2007; Payros, Orue-Etxebarria & Pujalte, Reference Payros, Orue-Etxebarria and Pujalte2006; Payros et al. Reference Payros, Tosquella, Bernaola, Dinarès-Turell, Orue-Etxebarria and Pujalte2009c; Fig. 4a). Palaeocurrent indicators show that the calciclastic sediment gravity flows run towards the northeast and that the shelfal source area was therefore located to the southwest. The marly deposits usually occur as alternating beds of highly bioturbated marls and marly mudstones, commonly 1–2 m in thickness (Fig. 4b). These beds have gradational bounding surfaces and are laterally continuous at outcrop scale. The marly deposits contain a rich and diversified planktonic foraminiferal assemblage, including both thin-walled spherical forms and thick-walled keeled forms, which attest to pelagic origin (Payros, Pujalte & Orue-Etxebarria, Reference Payros, Pujalte and Orue-Etxebarria2003, Reference Payros, Bernaola, Orue-Etxebarria, Dinarès-Turell, Tosquella and Apellaniz2007; Payros, Orue-Etxebarria & Pujalte, Reference Payros, Orue-Etxebarria and Pujalte2006; Payros et al. Reference Payros, Tosquella, Bernaola, Dinarès-Turell, Orue-Etxebarria and Pujalte2009c). The planktonic/benthic foraminiferal ratio is around 60 %. Hence, a water depth of approximately 500 m can be deduced on the basis of the relationship between the planktonic/benthic foraminiferal ratio and bathymetry in present-day oceans (Van der Zwaan, Jorissen & Stigter, Reference Van Der Zwaan, Jorissen and De Stigter1990; Nigam & Henriques, Reference Nigam and Henriques1992) and in Eocene oceans (Gibson, Reference Gibson1989). All these features demonstrate that the Anotz Formation deposits accumulated on the slope of a distally-steepened carbonate ramp.
Sequence stratigraphic studies carried out in the Anotz Formation and coeval shallow-water deposits showed that the calciclastic members represent low sea-level periods, whereas the intervening hemipelagic marly intervals constitute transgressive and highstand systems tracts (Fig. 4) (A. Payros, unpub. Ph.D. thesis, Univ. Basque Country, 1997; Pujalte et al. Reference Pujalte, Robles, Orue-Etxebarria, Baceta, Payros and Larruzea2000; Payros, Orue-Etxebarria & Pujalte, Reference Payros, Orue-Etxebarria and Pujalte2006; Payros, Pujalte & Orue-Etxebarria, Reference Payros, Bernaola, Orue-Etxebarria, Dinarès-Turell, Tosquella and Apellaniz2007; Payros et al. Reference Payros, Tosquella, Bernaola, Dinarès-Turell, Orue-Etxebarria and Pujalte2009c).
Palaeogeographically, during Eocene times the study area was located between mainland Europe and the Iberian craton, in a narrow deep-marine gulf that opened northwestwards into the Atlantic Ocean at approximately 35° N palaeolatitude (Fig. 1a) (Plaziat, Reference Plaziat1981; Pujalte, Baceta & Payros, Reference Pujalte, Baceta, Payros, Gibbons and Moreno2002). Although the Otsakar area was physically connected with the Gorrondatxe (Lutetian GSSP) area, both areas received sediments from different sources and were therefore parts of different sedimentary basins (Payros, Orue-Etxebarria & Pujalte, Reference Payros, Orue-Etxebarria and Pujalte2006; Payros et al. Reference Payros, Tosquella, Bernaola, Dinarès-Turell, Orue-Etxebarria and Pujalte2009c).
3. Material and methods
A detailed lithological log was produced by measuring the 120 m thick succession that spans from the base of the first calciclastic member of the Anotz Formation to the lowermost part of the second calciclastic member (Fig. 4). Most of the succession was studied in the main outcrop near Otsakar (section I in Fig. 2b). The first calciclastic member crops out at the beginning of the paved track, and the overlying interval of alternating hemipelagic marls and mudstones was studied on the soil-stripped hillside. The detailed study of the latter outcrop revealed that it is affected by several normal faults (Fig. 3b). In fact, it was owing to these faults that the Otsakar section was not considered a suitable candidate for the Lutetian GSSP (Apellaniz et al. Reference Apellaniz, Bernaola, Dinarès-Turell, Orue-Etxebarria, Payros, Tosquella, Strong, Crouch and Hollis2009; Molina et al. Reference Molina, Alegret, Apellaniz, Bernaola, Caballero, Hardenbol, Heilmann-Clausen, Larrasoaña, Luterbacher, Monechi, Ortiz, Orue-Etxebarria, Payros, Pujalte, Rodríguez-Tovar, Tori and Tosquella2009). Notwithstanding the tectonic disturbance, a bed-by-bed succession was reconstructed by correlating characteristic beds throughout the outcrop. Thus, 45 marl–mudstone couplets were identified and accurately measured (Fig. 4). The top of the succession exposed in the main outcrop is represented by an interval of distinctive hemipelagic mudstones, the overlying deposits being covered by vegetation. To solve this hindrance the hemipelagic mudstone beds were traced 500 m westwards to the paved track near the mast (section II in Figs 2b, 4), where the mudstones are also well exposed and the boundary with the overlying deposits of the second calciclastic member can be observed. This procedure showed that an erosive truncation surface separates the hemipelagic mudstones and the second calciclastic member, as the former are slightly thicker in the main outcrop than along the paved track (Fig. 4; also see Payros, Orue-Etxebarria & Pujalte, Reference Payros, Orue-Etxebarria and Pujalte2006; Payros, Pujalte & Orue-Etxebarria, Reference Payros, Pujalte and Orue-Etxebarria2007; Payros et al. Reference Payros, Tosquella, Bernaola, Dinarès-Turell, Orue-Etxebarria and Pujalte2009c).
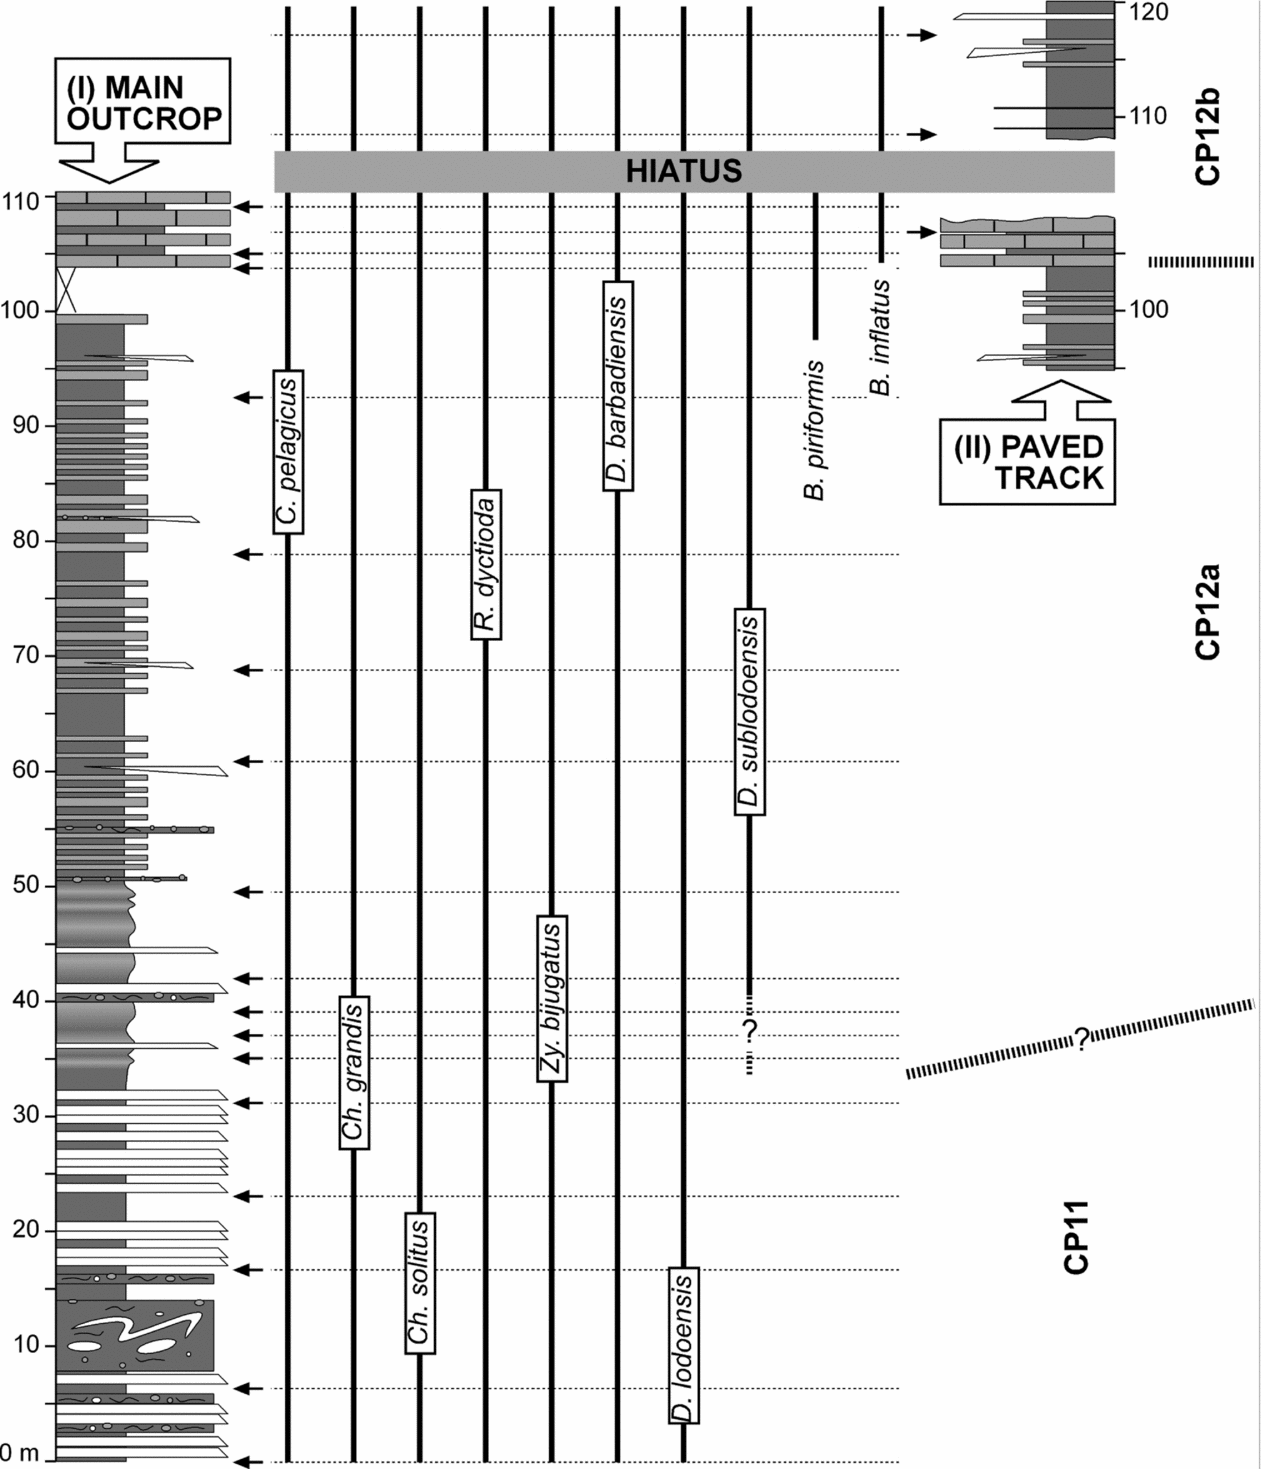
Twenty samples were collected from hemipelagic marly beds for the study of calcareous nannofossils (Fig. 5). Samples were taken every c. 10 m, with closer intervals near the main biostratigraphic events. Smear slides were prepared from raw material using the pipette method for calcareous nannofossils (Bown, Reference Bown1998), avoiding mechanical or physical processes that could modify the original composition of the assemblage. All the smear slides were analysed under a Leica DMLP petrographic microscope at 1500× magnification. In addition, 2000× magnification was used in some cases in order to study the smallest calcareous nannofossil specimens and to observe details of bigger forms. In order to characterize the whole calcareous nannofossil assemblage and detect rare species with key biostratigraphic value, more than 1000 specimens were classified along five random traverses on each smear slide.
Stratigraphic distribution of relevant calcareous nannofossils and biozonation of the Otsakar section. Positions of the studied samples (arrows) are plotted against the stratigraphic log. The boundary between biozones is placed halfway between samples assigned to consecutive zones.

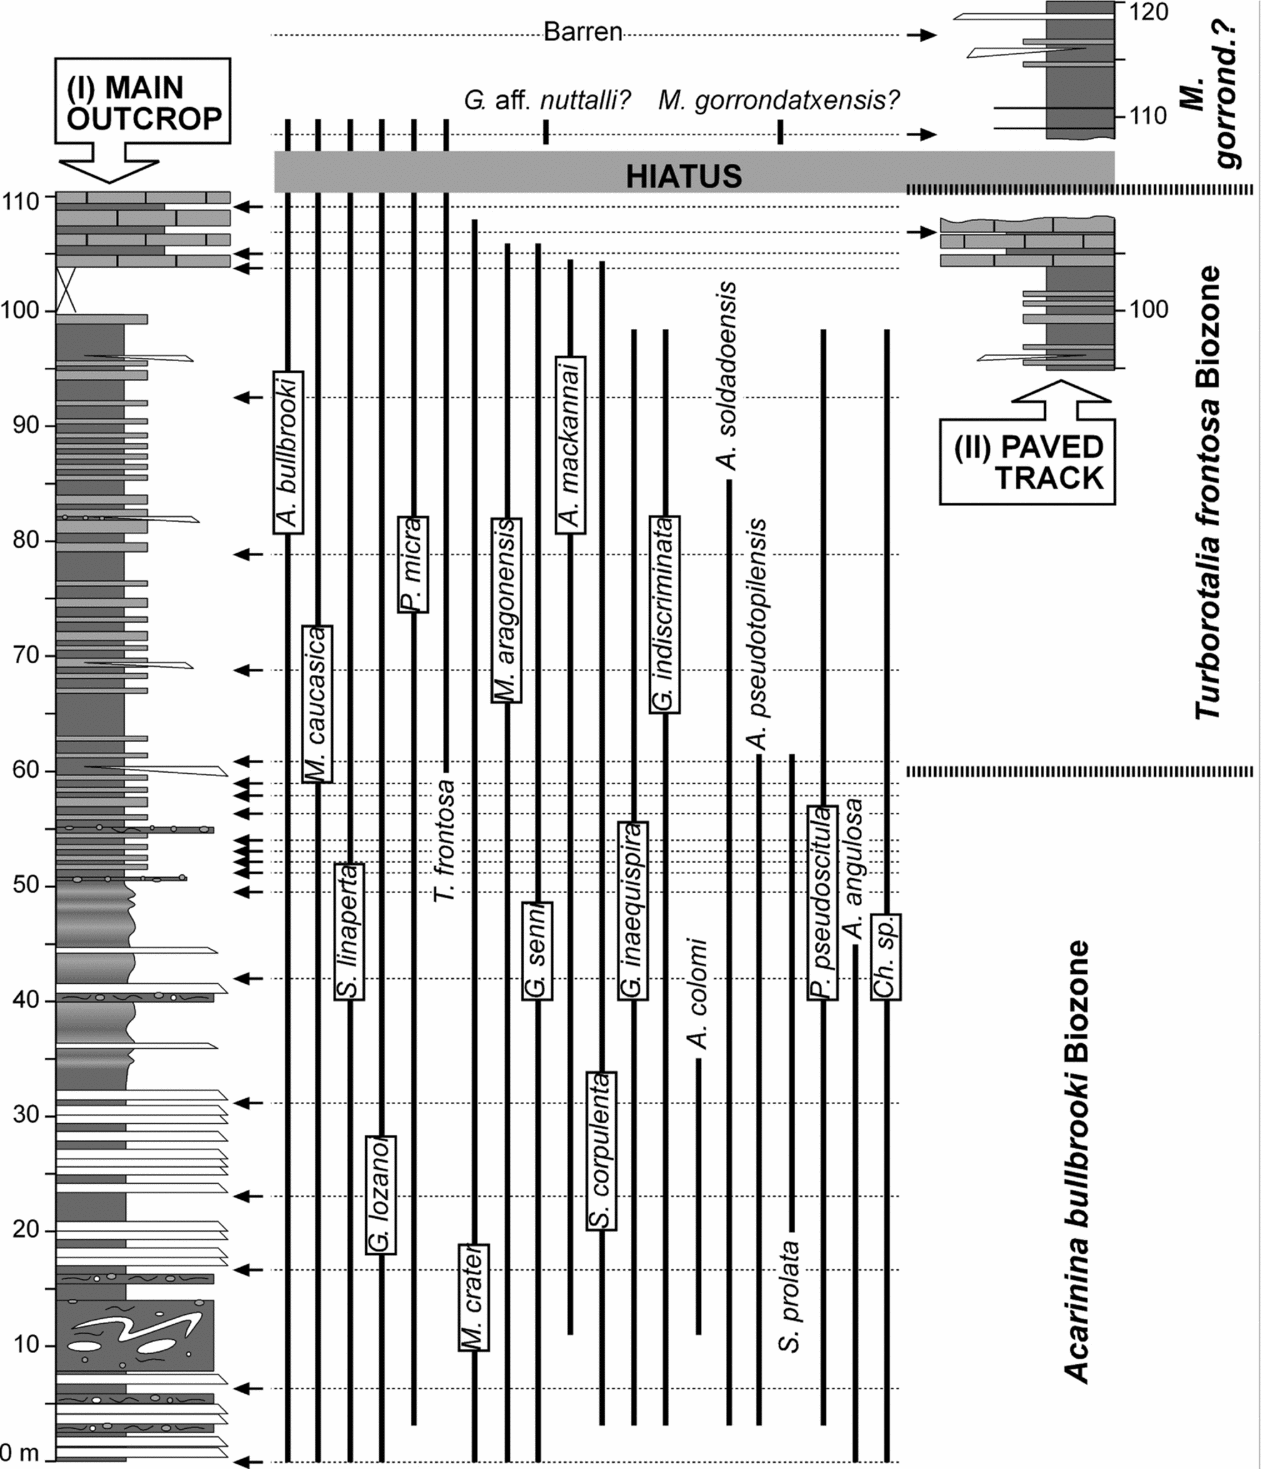
Twenty-four samples, each of about 1 kg, were collected from hemipelagic marly beds in order to analyse their planktonic foraminifera (Fig. 6). The samples were washed and screened to obtain residues of a 100–630 μm size range, which were studied under a binocular microscope. All residues contained planktonic foraminifers in sufficient quantity and degree of preservation to permit a semiquantitative study designed to identify characteristic species and pinpoint their first and last occurrences. After a separation with an Otto microsplitter, relative abundances of the different species were estimated based on counts of approximately 300 specimens.
Stratigraphic distribution of relevant planktonic foraminifers and biozonation of the Otsakar section. Positions of the studied samples (arrows) are plotted against the stratigraphic log. The boundary between biozones is placed halfway between samples assigned to consecutive zones.

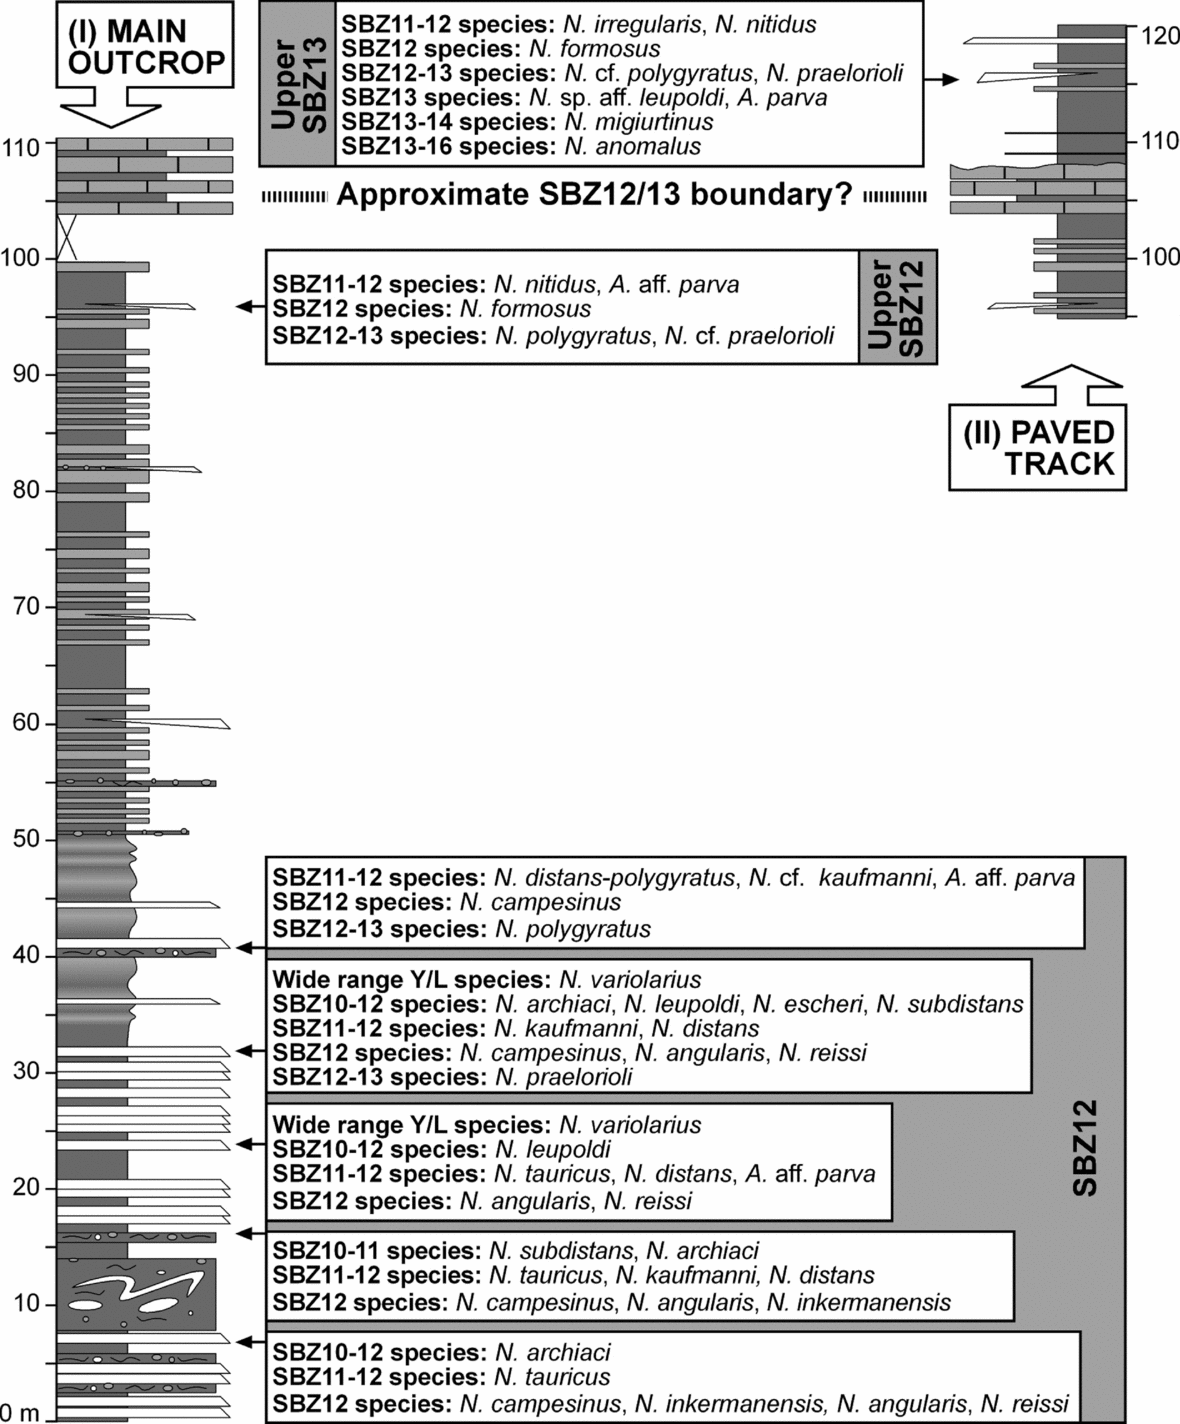
All of the calciclastic turbidites and debrites of the Otsakar section were examined for nummulitids, but only seven levels yielded positive results (Fig. 7). Bulk sediment samples (fossils plus matrix) were collected in six debritic beds, whereas one sample collected at 96.7 m was an indurated calciturbidite slab. All of the soft samples were washed in the laboratory and as many individual nummulitid specimens as possible were separated. Their external features (test diameter and shape, morphology and arrangement of septal filaments and granules, etc.) were examined with a binocular microscope. Then, nummulitids were split along the equatorial section to study their internal features, such as number of whorls, rate of opening of the spire (whorl radius), number of chambers per whorl, septal and chamber shape, and the proloculus diameter of megalospheric forms. The accurate study of the calciturbidite slab from 96.7 m was hindered by its indurated state, as loose nummulitid specimens could not be retrieved. In this case only equatorial sections from the sample surface could be studied.
Nummulitid species occurrences and biozonation of the Otsakar section. Positions of the studied samples (arrows) are plotted against the stratigraphic log. The boundary between biozones is placed halfway between samples assigned to consecutive zones.

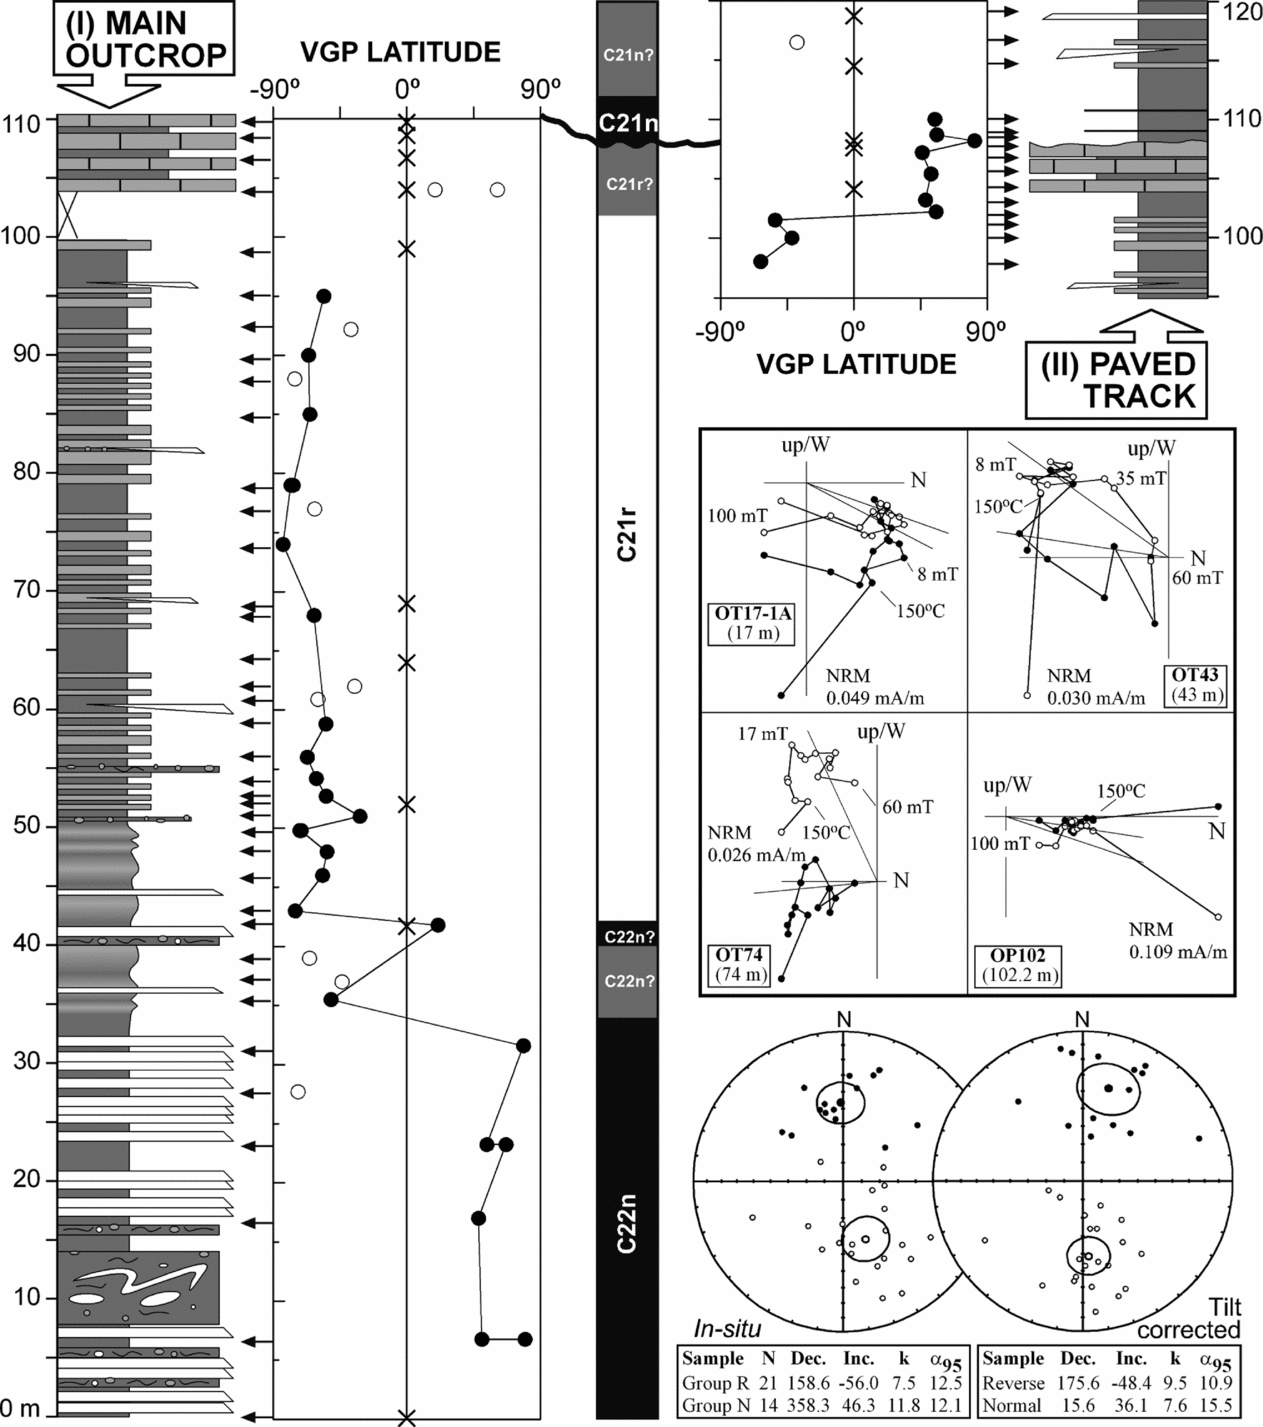
The palaeomagnetic sampling was basically restricted to the hemipelagic marls and mudstones, which are potentially more suitable than calciclastic deposits. This study is based on a total of 53 unique sampling sites, comprising two to three hand-samples per site (Fig. 8). The hand-samples were oriented in situ with a compass and subsequently standard cubic specimens were cut in the laboratory for analysis. Natural remanent magnetization (NRM) and remanence through demagnetization were measured on a 2G Enterprises DC SQUID high-resolution pass-through cryogenic magnetometer (manufacturer noise level of 10−12 Am2) operated in a shielded room at the Istituto Nazionale di Geofisica e Vulcanologia in Rome, Italy. A Pyrox oven in the shielded room was used for thermal demagnetizations, and alternating field (AF) demagnetization was performed with three orthogonal coils installed inline with the cryogenic magnetometer. Progressive stepwise AF demagnetization was routinely used and applied after a single heating step to 150 °C. AF demagnetization included 14 steps (4, 8, 13, 17, 21, 25, 30, 35, 40, 45, 50, 60, 80, 100 mT). Characteristic remanent magnetizations (ChRM) were computed by least-squares fitting (Kirschvink, Reference Kirschvink1980) on the orthogonal demagnetization plots (Zijderveld, Reference Zijderveld, Collinson, Creer and Runcorn1967). The ChRM declination and inclination were used to derive the latitude of the virtual geomagnetic pole (VGP) of each sample. This parameter was taken as an indicator of the original magnetic polarity, normal polarity being indicated by positive VGP latitudes and reverse polarity by negative VGP latitudes.
Palaeomagnetic results and magnetostratigraphic interpretation of the Otsakar section (crosses: no data; open circles: class B sites; closed circles: class A sites). Positions of the studied samples (arrows) are plotted against the stratigraphic log. The boundary between magnetic polarity zones is placed halfway between samples assigned to consecutive zones. Examples of orthogonal demagnetization diagrams representative of normal and reverse samples are given (open and closed symbols denote projections onto the vertical and horizontal planes, respectively). Stereographic projections of the ChRM components before (in situ) and after bedding correction (tilt corrected) are shown (open and closed symbols indicate projections onto the upper and lower hemisphere, respectively), together with the mean direction and statistics of normal and reverse polarity directions.

4. Results
4.a. Calcareous nannofossils
According to the preservation criteria proposed by Roth & Thierstein (Reference Roth, Thierstein, Hayes, Pimm, Beckman, Benson, Berger, Roth, Supko and Von Rad1972), most of the samples yielded moderately to well-preserved calcareous nannofossil assemblages. Preservation of calcareous nannofossils is frequently excellent and delicate structures are usually present. However, they occasionally show traces of dissolution and to a lesser extent re-crystallization. Reworked Cretaceous, Palaeocene and Early Eocene nannofossils occur in most samples. On the basis of the autochthonous calcareous nannofossil species identified, the biozonation scheme of Okada & Bukry (Reference Okada and Bukry1980) could be used (Fig. 5).
The lowermost five samples, up to 32 m, are characterized by Coccolithus pelagicus, Reticulofenestra dyctioda, Discoaster lodoensis, D. barbadiensis, Chiasmolithus solitus, Ch. grandis and Zygrhablitus bijugatus, among others. This assemblage is typical of the Ypresian (Early Eocene) Zone CP11.
The first occurrence of D. sublodoensis, which marks the base of Zone CP12a was found at 41 m. However, transitional forms between D. lodoensis and D. sublodoensis were found between 32 and 41 m. Similar specimens were found in Gorrondatxe between the first rare occurrence of D. sublodoensis and its common occurrence higher in the succession (Bernaola et al. Reference Bernaola, Orue-Etxebarria, Payros, Dinarès-Turell, Tosquella, Apellaniz and Caballero2006), suggesting that in Otsakar the CP11/12a boundary could actually be located somewhere between 32 and 41 m. A similar trend in the abundance of D. sublodoensis was also observed in other sections (Agnini et al. Reference Agnini, Muttoni, Kent and Rio2006; Larrasoaña et al. Reference Larrasoaña, Gonzalvo, Molina, Monechi, Ortiz, Tori and Tosquella2008).
The first occurrence of Blackites inflatus, which is the marker taxon of the Lutetian (Middle Eocene) Zone CP12b, was found at 105 m, slightly higher than that of B. piriformis. From this level upwards B. inflatus was found in all samples. This suggests that Zone CP13a is not represented in the Otsakar section, as the last occurrence of B. inflatus can be used to approach the base of Zone CP13a (Aubry, Reference Aubry1983; Varol, Reference Varol1989; Bernaola et al. Reference Bernaola, Orue-Etxebarria, Payros, Dinarès-Turell, Tosquella, Apellaniz and Caballero2006; Larrasoaña et al. Reference Larrasoaña, Gonzalvo, Molina, Monechi, Ortiz, Tori and Tosquella2008).
The exact age of the uppermost deposits of the Otsakar section (second calciclastic member) remains uncertain owing to the poor quality of the calcareous nannofossil samples. Neither Nannotetrina cristata nor B. piriformis were found in the second calciclastic member. As N. cristata is known to have first occurred in the lower part of Zone CP12b (Fig. 1b; Agnini et al. Reference Agnini, Muttoni, Kent and Rio2006; Bernaola et al. Reference Bernaola, Orue-Etxebarria, Payros, Dinarès-Turell, Tosquella, Apellaniz and Caballero2006; Payros et al. Reference Payros, Tosquella, Bernaola, Dinarès-Turell, Orue-Etxebarria and Pujalte2009c), its absence in Otsakar would suggest that the succession does not reach that age. However, the highest occurrence of B. piriformis does not reach the middle part of CP12b (Bernaola et al. Reference Bernaola, Orue-Etxebarria, Payros, Dinarès-Turell, Tosquella, Apellaniz and Caballero2006), its absence in the second calciclastic member of Otsakar therefore suggesting that these deposits could actually be younger. On the basis of the planktonic foraminiferal, nummulitid and magnetostratigraphic results presented in the following Sections, the latter option seems more likely. Apart from this uncertainty, the succession of calcareous nannofossil bioevents of the Otsakar section agrees with that described in many other sections worldwide (Okada & Bukry, Reference Okada and Bukry1980; Aubry, Reference Aubry1983; Varol, Reference Varol1989; Bown, Reference Bown1998, Reference Bown2005; Agnini et al. Reference Agnini, Muttoni, Kent and Rio2006; Bernaola et al. Reference Bernaola, Orue-Etxebarria, Payros, Dinarès-Turell, Tosquella, Apellaniz and Caballero2006; Larrasoaña et al. Reference Larrasoaña, Gonzalvo, Molina, Monechi, Ortiz, Tori and Tosquella2008), demonstrating the reliability of the abovementioned results.
4.b. Planktonic foraminifera
Most samples contain a diversified assemblage of well-preserved planktonic foraminifers, representing about 60 % of the total (planktonic plus benthic) foraminiferal content. The poorest samples are those from the second calciclastic member of the Anotz Formation, which do not provide reliable results. The complete assemblage of planktonic foraminifers was recorded at species level, but difficulties for accurate taxonomic determination arose from the fact that most samples have a large proportion of reworked Cretaceous, Palaeocene and lower Ypresian specimens. As some of the observed planktonic foraminifer specimens show morphological characteristics that could correspond to several stratigraphically distant species, it was difficult to classify such specimens as either autochthonous or reworked. In such cases, rather than exclusively considering test morphology, other features (test colour, preservation, etc.) were used to distinguish autochthonous and reworked specimens.
The standard biostratigraphic schemes of Berggren et al. (Reference Berggren, Kent, Swisher, Aubry, Berggren, Kent, Aubry and Hardenbol1995) and Berggren & Pearson (Reference Berggren and Pearson2005) do not provide enough resolution for the zonation of the Otsakar section, as the whole succession is included within their P9 and E7 zones. Instead, the planktonic foraminiferal biozonation developed by Orue-Etxebarria et al. (Reference Orue-Etxebarria, Payros, Bernaola, Dinarès-Turell, Tosquella, Apellaniz and Caballero2006) and Bernaola et al. (Reference Bernaola, Orue-Etxebarria, Payros, Dinarès-Turell, Tosquella, Apellaniz and Caballero2006) for the Ypresian/Lutetian boundary interval in Gorrondatxe provides much higher resolution (Fig. 1b).
The lower part of the succession (0–60.5 m) is included within the Acarinina bullbrooki Biozone, as it is characterized by the occurrence of A. angulosa, A. bullbrooki, A. pseudotopilensis, Chiloguembelina sp., Globanomalina indiscriminata, Globigerina inaequispira, Globigerinatheka senni, Guembelitrioides lozanoi, Morozovella aragonensis, M. caucasica, M. crater, Pseudohastigerina micra, Subbotina corpulenta, S. linaperta and S. prolata, among others.
The hemipelagic interval exposed in the main outcrop can reliably be assigned to the Turborotalia frontosa Biozone, the first occurrence of typical specimens of this species being located at 60.5 m. In addition, this interval is characterized by the absence of A. pseudotopilensis and S. prolata, neither of which reaches the T. frontosa Biozone in Gorrondatxe (Orue-Etxebarria, Reference Orue-Etxebarria1985; Orue-Etxebarria et al. Reference Orue-Etxebarria, Payros, Bernaola, Dinarès-Turell, Tosquella, Apellaniz and Caballero2006; Bernaola et al. Reference Bernaola, Orue-Etxebarria, Payros, Dinarès-Turell, Tosquella, Apellaniz and Caballero2006).
The M. gorrondatxensis Biozone is possibly represented in the second calciclastic member exposed in the uppermost part of the Otsakar section. Unfortunately, however, the age of this interval could not be accurately established owing to the low number and bad preservation of planktonic foraminifers. Specimens similar to M. gorrondatxensis occur throughout the Otsakar succession, but they most likely correspond to reworked early Ypresian M. gracilis specimens, the only possible exception being those found in the second calciclastic member. The attribution of the second calciclastic member to the M. gorrondatxensis Biozone is supported by the absence of M. crater, G. indiscriminata and A. angulosa, which are either absent or scarce in the M. gorrondatxensis Biozone of Gorrondatxe (Orue-Etxebarria, Reference Orue-Etxebarria1985; Orue-Etxebarria et al. Reference Orue-Etxebarria, Payros, Bernaola, Dinarès-Turell, Tosquella, Apellaniz and Caballero2006; Bernaola et al. Reference Bernaola, Orue-Etxebarria, Payros, Dinarès-Turell, Tosquella, Apellaniz and Caballero2006). In Gorrondatxe, the type area of M. gorrondatxensis (Orue-Etxebarria, Reference Orue-Etxebarria1985), the first occurrence of this species correlates with the upper part of calcareous nannofossil Zone CP12b (Fig. 1b; Orue-Etxebarria et al. Reference Orue-Etxebarria, Payros, Bernaola, Dinarès-Turell, Tosquella, Apellaniz and Caballero2006; Bernaola et al. Reference Bernaola, Orue-Etxebarria, Payros, Dinarès-Turell, Tosquella, Apellaniz and Caballero2006; Payros et al. Reference Payros, Bernaola, Orue-Etxebarria, Dinarès-Turell, Tosquella and Apellaniz2007).
4.c. Nummulitids
All samples provided nummulitid specimens that could be classified at a specific level and proved suitable for biostratigraphic determination (Fig. 7). However, their systematic study was hindered because most of the samples contained only megalospheric specimens and lacked microspheric forms. This situation is probably the result of the sorting (grain-size classification) of the particles involved in sediment gravity flows, which led to the accumulation of large microspheric and small megalospheric nummulitid tests separately. Therefore, since complete nummulitid populations are not represented, a precise systematic determination was sometimes difficult to obtain. That is why the term ‘confer’ (cf.) is used in some cases. In addition, the ‘affinis’ (aff.) term applies to specimens that are transitional between successive species within a phylogenetic series. Some of the Otsakar species (N. angularis, N. reissi) were previously unknown in the Pyrenees. Furthermore, some nummulitid groups (N. distans–polygyratus and N. subdistans–archiaci) are characterized by high intraspecific morphological variability and their phylogenetic relationships are still under discussion (Schaub, Reference Schaub1981). These factors, along with the unspecific biostratigraphic range of some species, sometimes made it difficult to distinguish whether a sample contained a homogenous assemblage, with specimens belonging to one single biozone, or a mixed assemblage with specimens belonging to more than one biozone. Although all the abovementioned limitations hampered the precise reconstruction of the palaeobiocenosis at some levels, it was still possible to date the oldest possible age of the calciclastic deposits containing nummulitids. To this end, the biostratigraphic range of nummulitid species was assigned following Blondeau (Reference Blondeau1972), Hottinger (Reference Hottinger1977), Schaub (Reference Schaub1981), Isuman (Reference Isuman1983), Schaub, Benjamini & Moshkovitz (Reference Schaub, Benjamini and Moshkovitz1995), Tosquella & Serra-Kiel (Reference Tosquella and Serra-Kiel1996) and the standard Shallow Benthic Zones (SBZ scale) of Serra-Kiel et al. (Reference Serra-Kiel, Hottinger, Caus, Drobne, Ferrandez, Jauhri, Less, Pavlovec, Pignatti, Samso, Schaub, Sirel, Strougo, Tambareau, Tosquella and Zakrevskaya1998).
All samples contain nummulitid assemblages that are characteristic of the late Ypresian Zone SBZ12, which provides the oldest possible age of the base of the section (Fig. 7). In addition, most of the samples contain species whose stratigraphic ranges began in zones SBZ10 or SBZ11; these specimens could be either coeval with the late Ypresian specimens or reworked from older strata by mass-wasting processes and sediment gravity flows. The stratigraphic range of other species extends to the Lutetian SBZ13. However, their co-occurrence with species exclusively attributable to the Ypresian SBZ12 makes this age more likely. The only clear exception is the uppermost sample from 115.7 m, which contains nummulitid species that are exclusively assigned to Zone SBZ13, more precisely to its latter part, and must therefore be included in the Lutetian. Unfortunately, the boundary between the SBZ12 and SBZ13 zones could not be accurately pinpointed owing to the uncertain age of the sample collected at 96.7 m. Although the highest stratigraphic range of the specimens observed in this sample seems to be the latter part of SBZ12, this is not completely accurate and should not be taken as definitive; indeed, owing to the indurate nature of this calciturbidite sample, only limited nummulitid observations could be made and, consequently, a possible SBZ13 age cannot be fully ruled out. Yet, given that the 115.7 m level yielded the only sample definitively included in the Lutetian SBZ13, the boundary between zones SBZ12 and SBZ13 must be tentatively placed between the 96.7 m and 115.7 m levels.
A similar uncertainty was found at the SBZ12/13 transition in Gorrondatxe (Fig. 1b; Bernaola et al. Reference Bernaola, Orue-Etxebarria, Payros, Dinarès-Turell, Tosquella, Apellaniz and Caballero2006). Here, the youngest nummulitid sample from the calcareous nannofossil Zone CP12a belongs to either the latter part of SBZ12 or the earlier part of SBZ13, a situation that resembles that of the 96.7 m sample from Otsakar. The next nummulitid sample from Gorrondatxe, collected 152 m higher in the upper part of calcareous nannofossil Zone CP12b and close to the T. frontosa/M. gorrondatxensis planktonic foraminiferal biozone boundary, pertains to the latter part of SBZ13, being similar to the 115.7 m sample from Otsakar.
4.d. Magnetostratigraphy
The NRM intensity in the studied rocks is relatively weak, ranging between 0.02 and 0.15 mA/m. Upon stepwise demagnetization, two components can normally be distinguished in addition to a small viscous component removed at the first demagnetization step, the latter likely being related to a drilling overprint. A low-field component conforming to the present geomagnetic field is removed up to fields of 17–21 mT. Then, a characteristic remanent magnetization (ChRM) is removed up to the maximum field applied (100 mT) that trends towards the origin of the diagram and presents dual polarity (Fig. 8). Owing to the low intensity of some samples, the ChRM is sometimes noisy and occasionally becomes erratic at fields above 60 mT. A ranking was established based on the quality of the demagnetization trajectories. Class A includes samples for which the ChRM component can be calculated unambiguously. Class B denotes samples with ambiguous ChRM components and for class C samples the ChRM component cannot be calculated.
The VGP latitudes derived from the class A ChRM directions yield a succession of three magnetozones, characterized by normal polarity in the lower and upper parts of the succession and reverse polarity in between (Fig. 8). The lower normal magnetozone, which correlates with the calcareous nannofossil Zone CP11 and the planktonic foraminiferal A. bullbrooki Biozone, corresponds to Chron C22n (Berggren et al. Reference Berggren, Kent, Swisher, Aubry, Berggren, Kent, Aubry and Hardenbol1995; Gradstein, Ogg & Smith, Reference Gradstein, Ogg and Smith2004; Agnini et al. Reference Agnini, Muttoni, Kent and Rio2006; Bernaola et al. Reference Bernaola, Orue-Etxebarria, Payros, Dinarès-Turell, Tosquella, Apellaniz and Caballero2006; Larrasoaña et al. Reference Larrasoaña, Gonzalvo, Molina, Monechi, Ortiz, Tori and Tosquella2008). The overlying reverse magnetozone matches with Chron C21r on the basis of its correlation with the calcareous nannofossil Zone CP12a and the planktonic foraminiferal T. frontosa Biozone. Unfortunately, it was not possible to pinpoint unequivocally the C22n/C21r chron boundary. The highest sample with reliable normal magnetic polarity occurs at 31.6 m and the lowest with reliable reverse magnetic polarity at 43 m. Between these levels there is one sample (35.5 m) with reverse magnetic polarity and another sample (41.8 m) with normal polarity, rendering the interval between 31.6 and 43 m rather ambiguous. A plausible interpretation is that the apparently normal magnetic polarity of the sample from 41.8 m corresponds to the true original signal, whereas the apparently reverse magnetic polarity at 35.5 m represents a delayed magnetization component acquired during Chron C21r. This interpretation is supported by the occurrence of the calcareous nannofossil CP11/12 zonal boundary in the uncertain interval, as this zonal boundary is known to occur within Chron C22n elsewhere (Berggren et al. Reference Berggren, Kent, Swisher, Aubry, Berggren, Kent, Aubry and Hardenbol1995; Gradstein, Ogg & Smith, Reference Gradstein, Ogg and Smith2004; Agnini et al. Reference Agnini, Muttoni, Kent and Rio2006; Bernaola et al. Reference Bernaola, Orue-Etxebarria, Payros, Dinarès-Turell, Tosquella, Apellaniz and Caballero2006; Larrasoaña et al. Reference Larrasoaña, Gonzalvo, Molina, Monechi, Ortiz, Tori and Tosquella2008). Similar palaeomagnetic uncertainties have also been documented close to other magnetic reversals, being interpreted as a result of delayed acquisition mechanisms during early diagenesis (Dinarès-Turell & Dekkers, Reference Dinarès-Turell, Dekkers, Tarling and Turner1999). In such scenarios, magnetic minerals can be formed at different times at different sedimentary levels due to early diagenetic diffusion of iron from anoxic layers into suboxic-oxic zones, where secondary magnetic minerals would then form, resulting in delayed remanence acquisition. The delayed signature typically extends by only a limited stratigraphic thickness below the true chron boundary. In consequence, it was considered preferable to extend Chron C22n up to 42 m, despite the remaining ambiguity.
The interpretation of the upper normal magnetozone raised similar problems. Its uppermost part (above the erosive truncation surface that separates the second calciclastic member from the underlying pelagic mudstones) can be correlated with Chron C21n on the basis of its nummulitid assemblage, which represents the latter part of SBZ13 (Serra-Kiel et al. Reference Serra-Kiel, Hottinger, Caus, Drobne, Ferrandez, Jauhri, Less, Pavlovec, Pignatti, Samso, Schaub, Sirel, Strougo, Tambareau, Tosquella and Zakrevskaya1998; Gradstein, Ogg & Smith, Reference Gradstein, Ogg and Smith2004; Bernaola et al. Reference Bernaola, Orue-Etxebarria, Payros, Dinarès-Turell, Tosquella, Apellaniz and Caballero2006), and its possible attribution to the M. gorrondatxensis planktonic foraminiferal biozone and to the latter part of the calcareous nannofossil Zone CP12b (Fig. 8). However, the lower part of this normal magnetozone cannot be directly correlated with Chron C21n. This interval includes the calcareous nannofossil CP12a/b boundary, which occurs in the middle part of Chron C21r in all biomagnetostratigraphic correlation schemes published to date (Berggren et al. Reference Berggren, Kent, Swisher, Aubry, Berggren, Kent, Aubry and Hardenbol1995; Gradstein, Ogg & Smith, Reference Gradstein, Ogg and Smith2004; Bernaola et al. Reference Bernaola, Orue-Etxebarria, Payros, Dinarès-Turell, Tosquella, Apellaniz and Caballero2006; Payros et al. Reference Payros, Bernaola, Orue-Etxebarria, Dinarès-Turell, Tosquella and Apellaniz2007; Larrasoaña et al. Reference Larrasoaña, Gonzalvo, Molina, Monechi, Ortiz, Tori and Tosquella2008). Similarly, the first occurrence of B. piriformis, which in Otsakar was found within the upper normal magnetozone, has systematically been found within Chron C21r elsewhere (Bown, Reference Bown2005; Bernaola et al. Reference Bernaola, Orue-Etxebarria, Payros, Dinarès-Turell, Tosquella, Apellaniz and Caballero2006). Taking into account that all of these bioevents and their correlation with other biostratigraphic scales follow precisely the same chronological pattern described elsewhere (Bernaola et al. Reference Bernaola, Orue-Etxebarria, Payros, Dinarès-Turell, Tosquella, Apellaniz and Caballero2006; Larrasoaña et al. Reference Larrasoaña, Gonzalvo, Molina, Monechi, Ortiz, Tori and Tosquella2008), the possibility that the Otsakar calcareous plankton first occurrences do not coincide with global first appearance events, but correspond to locally delayed events, can be ruled out. All things considered, it might well be that the lower part of the upper normal magnetozone does not record the original magnetic polarity, but a delayed re-magnetization. This overprinting could have been acquired during early diagenesis, as a result of the exposition of the pelagic mudstones on the seafloor while the overlying erosive truncation surface was being excavated during Chron C21n.
5. New insights into the Ypresian/Lutetian chronostratigraphy
5.a. Cyclostratigraphy and absolute ages
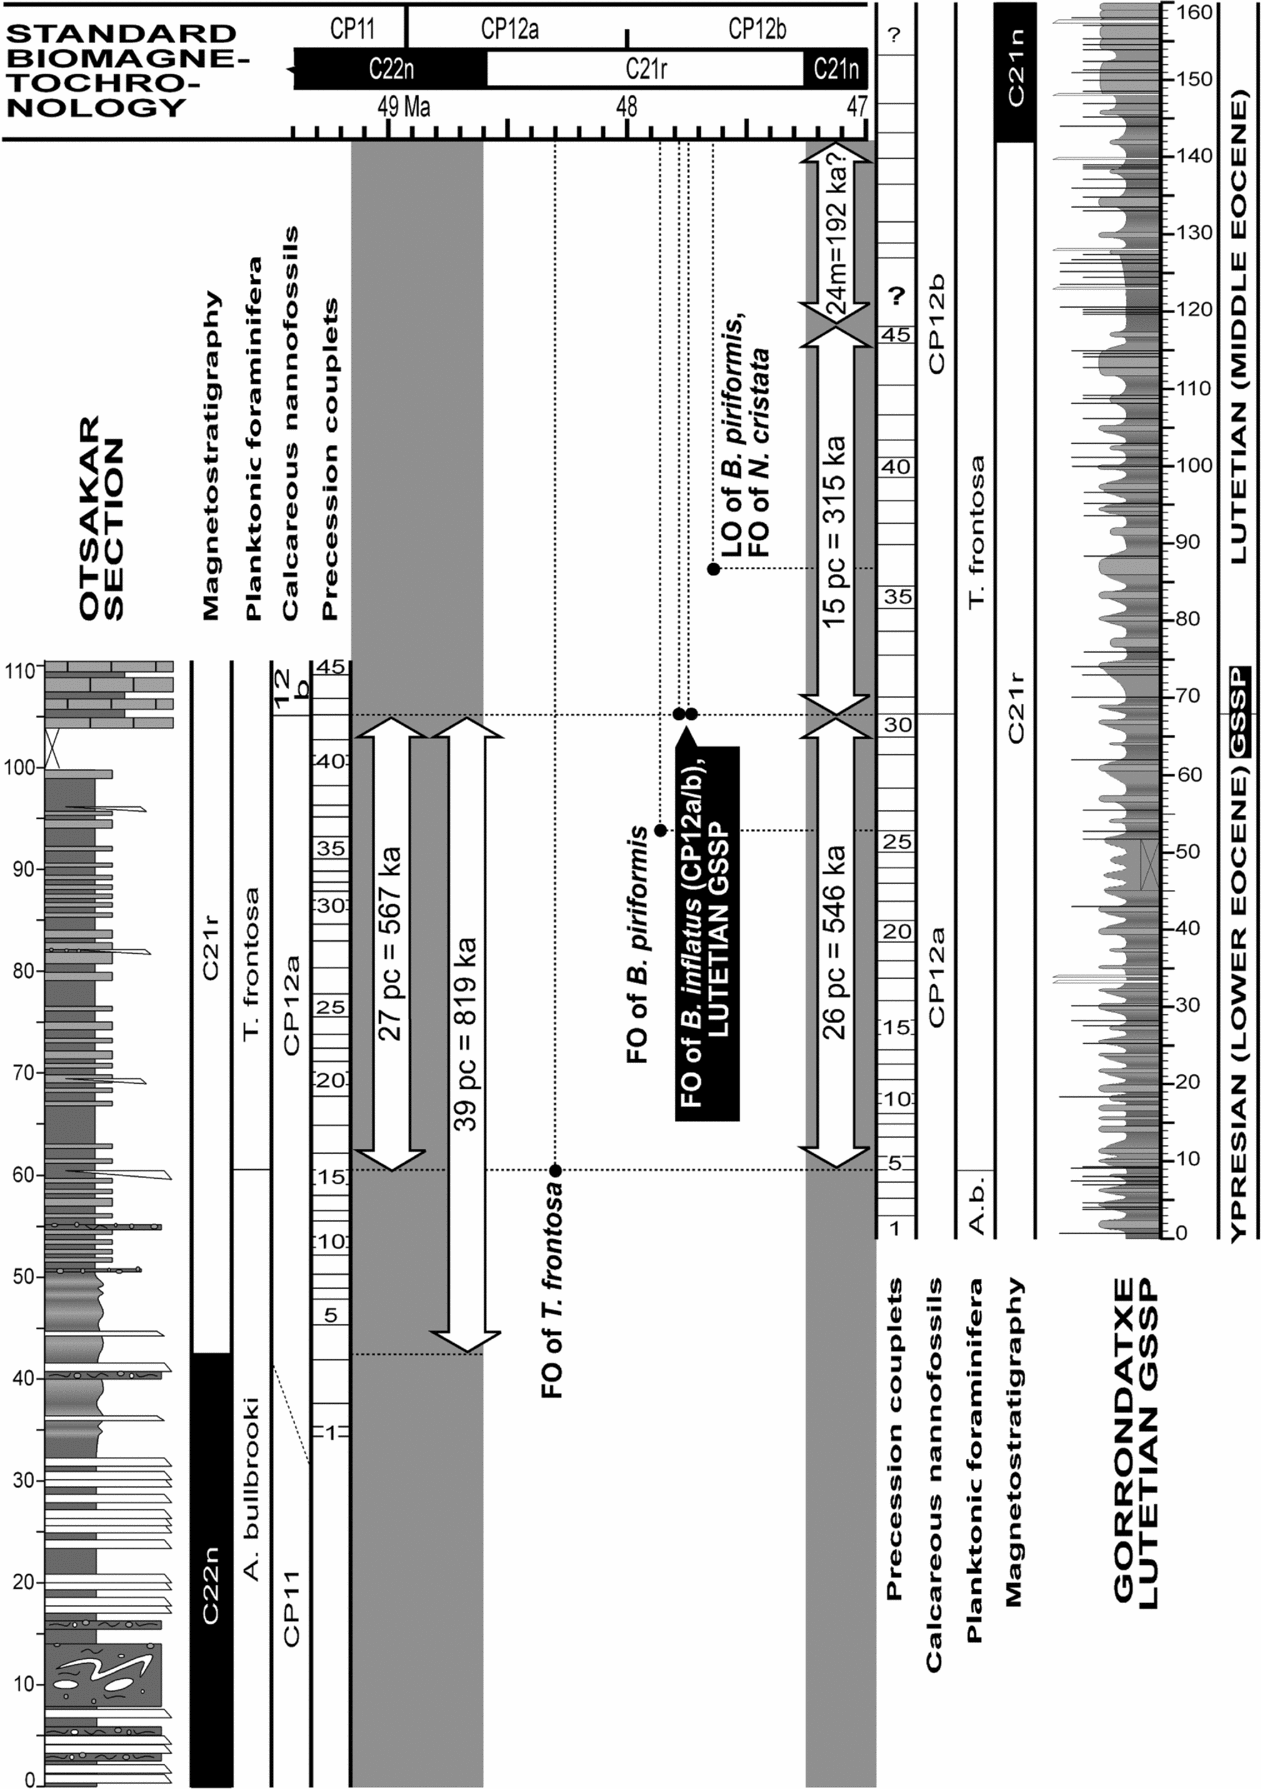
Alternating mudstone–marl couplets are a distinctive characteristic of both the Otsakar and Gorrondatxe sections. The Gorrondatxe mudstone–marl couplets were demonstrated to be the manifestation of sedimentary changes driven by astronomical precession cycles, each couplet therefore representing approximately 21 ka (Payros et al. Reference Payros, Orue-Etxebarria, Bernaola, Apellaniz, Dinarès-Turell, Tosquella and Caballero2009a,b). These authors showed that 26 hemipelagic mudstone–marl couplets occur in Gorrondatxe between the first occurrence of the planktonic foraminifer T. frontosa and the Lutetian GSSP, which is marked by the first occurrence of the calcareous nannofossil B. inflatus and the CP12a/b zonal boundary. Thus, the first occurrence of T. frontosa in Gorrondatxe is 546 ka older than the Lutetian GSSP (Fig. 9).
Age model for the Ypresian/Lutetian boundary interval at the Otsakar (left) and Gorrondatxe (right) sections, as obtained by correlating the C22n/C21r and C21r/C21n chron boundaries with their respective ages in the standard biomagnetochronology of Gradstein, Ogg & Smith (Reference Gradstein, Ogg and Smith2004) and by counting the number of precession-related mudstone–marl couplets of 21 ka (pc – precession couplets) to significant bioevents. The Lutetian GSSP (CP12a/b boundary) can be dated at 47.76 Ma, and not 48 Ma as shown in the standard time scale.

Similar hemipelagic mudstone–marl couplets also occur in the main outcrop of Otsakar, where 27 couplets were found between the first occurrences of T. frontosa and B. inflatus (Fig. 9). The near identical number of couplets between the first occurrences of T. frontosa and B. inflatus in Otsakar and Gorrondatxe demonstrates that all couplets had the same astronomical origin.
On the basis of the astronomical origin of the Otsakar mudstone–marl couplets, refinements can be made to the Early/Middle Eocene biomagnetochronology developed by Payros et al. (Reference Payros, Bernaola, Orue-Etxebarria, Dinarès-Turell, Tosquella and Apellaniz2007, Reference Payros, Orue-Etxebarria, Bernaola, Apellaniz, Dinarès-Turell, Tosquella and Caballero2009a) at Gorrondatxe. The main problem found at Gorrondatxe is that the chronostratigraphic position of the Lutetian GSSP level, which coincides with the calcareous nannofossil CP12a/b boundary and is located within Chron C21r, could not be accurately calibrated with reliably dated magnetostratigraphic events (Payros et al. Reference Payros, Orue-Etxebarria, Bernaola, Dinarès-Turell, Tosquella, Apellaniz, Caballero, Orue-Etxebarria, Payros, Caballero, Molina, Apellaniz and Bernaola2009b; Molina et al. Reference Molina, Alegret, Apellaniz, Bernaola, Caballero, Hardenbol, Heilmann-Clausen, Larrasoaña, Luterbacher, Monechi, Ortiz, Orue-Etxebarria, Payros, Pujalte, Rodríguez-Tovar, Tori and Tosquella2009). Firstly, the underlying C22n/C21r chron boundary is separated from the GSSP succession by a fault, which caused the loss of an unknown thickness of the succession (Fig. 1b). Secondly, the age difference with the overlying C21r/C21n chron boundary could not be accurately calculated. Payros et al. (Reference Payros, Orue-Etxebarria, Bernaola, Apellaniz, Dinarès-Turell, Tosquella and Caballero2009a,Reference Payros, Orue-Etxebarria, Bernaola, Dinarès-Turell, Tosquella, Apellaniz, Caballero, Orue-Etxebarria, Payros, Caballero, Molina, Apellaniz and Bernaolab) observed that in Gorrondatxe, 15 precession couplets (315 ka) occur above the CP12a/b Lutetian GSSP and that another 24 m of succession, in which the mudstone–marl alternation is partly interrupted, are still included within Chron C21r (Fig. 9). Hence, as the time lapse represented by these 24 m of succession could not be calculated cyclostratigraphically, the age difference between the Lutetian GSSP and the C21r/C21n chron boundary remained uncertain. The only possible approach was to consider that the sedimentation rate of the 24 m thick succession was the same as in the underlying 118 m thick succession, where 45 precession couplets were identified. This assumption would imply 192 ka for the inconclusive 24 m thick interval and, hence, an age difference of 507 ka between the Lutetian GSSP and the C21r/C21n chron boundary (Fig. 9). Considering that Chron C21n is one of the radiometric tie points on which the geomagnetic time scale was based, it can be assumed that the 47.235 Ma age calculated for its base is fully reliable (Berggren et al. Reference Berggren, Kent, Swisher, Aubry, Berggren, Kent, Aubry and Hardenbol1995; Gradstein, Ogg & Smith, Reference Gradstein, Ogg and Smith2004). Assuming this to be correct, the age of the Lutetian GSSP would be 47.742 Ma, approximately 250 ka younger than the 48 Ma age assigned by Gradstein, Ogg & Smith (Reference Gradstein, Ogg and Smith2004) to the CP12a/b boundary.
Interestingly, however, the absolute age estimated at Gorrondatxe for the CP12a/b zonal boundary is now supported by the Otsakar data. In Otsakar, 39 mudstone–marl couplets separate the C22n/C21r chron boundary and the CP12a/b boundary, which represent 819 ka (Fig. 9). Given the 48.599 Ma age reported by Gradstein, Ogg & Smith (Reference Gradstein, Ogg and Smith2004) for the base of Chron C21r, this implies an age of 47.78 Ma for the CP12a/b boundary, which is surprisingly similar to the age obtained at Gorrondatxe.
Taking into account the results from both the Gorrondatxe and Otsakar sections, it can be concluded that the whole Chron C21r lasted 1.326 Ma, a figure that is very close to the 1.364 Ma calculated by Gradstein, Ogg & Smith (Reference Gradstein, Ogg and Smith2004). Furthermore, these estimates could also agree with the duration of Chron C21r in ODP Leg 207, Site 1257 (Westerhold & Röhl, Reference Westerhold and Röhl2009). These authors counted 13 ± 1/2 short eccentricity cycles within Chron C21r. Using 95 ka as the mean duration of short eccentricity cycles, they estimated that Chron C21r lasted 1.235 (± 0.048) Ma, a considerably shorter duration than that obtained in Gradstein, Ogg & Smith (Reference Gradstein, Ogg and Smith2004) and herein. However, if the more commonly used 100 ka duration is considered for the short eccentricity cycles, the 13 ± 1/2 cycles of Westerhold & Röhl (Reference Westerhold and Röhl2009) would yield a Chron C21r duration of 1.3 (± 0.05) Ma, thus being very similar to the duration estimated herein.
5.b. Chronostratigraphic position of other bioevents
The chronostratigraphic calibration of the larger foraminiferal SBZ scale of Serra-Kiel et al. (Reference Serra-Kiel, Hottinger, Caus, Drobne, Ferrandez, Jauhri, Less, Pavlovec, Pignatti, Samso, Schaub, Sirel, Strougo, Tambareau, Tosquella and Zakrevskaya1998) and of the planktonic foraminiferal P and E scales of Berggren et al. (Reference Berggren, Kent, Swisher, Aubry, Berggren, Kent, Aubry and Hardenbol1995) and Berggren & Pearson (Reference Berggren and Pearson2005) can be refined using the Otsakar results.
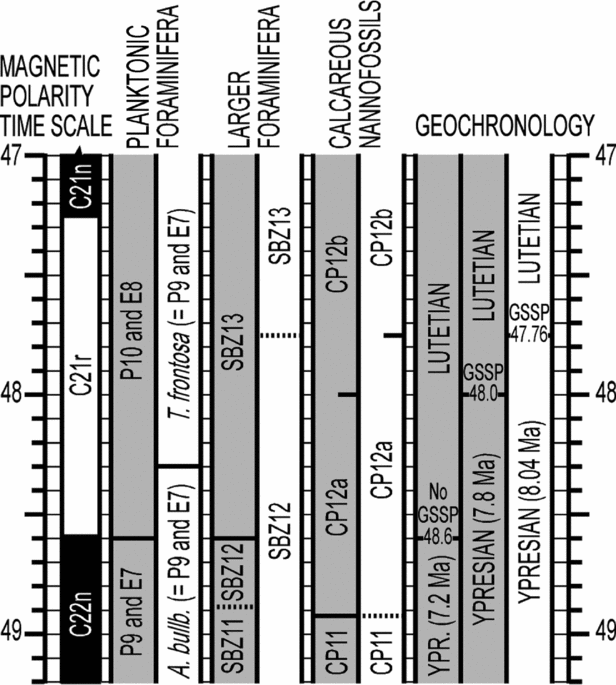
The chronostratigraphic position of the nummulitid Zone SBZ12 in Otsakar is at odds with that assumed in the standard scheme of Serra-Kiel et al. (Reference Serra-Kiel, Hottinger, Caus, Drobne, Ferrandez, Jauhri, Less, Pavlovec, Pignatti, Samso, Schaub, Sirel, Strougo, Tambareau, Tosquella and Zakrevskaya1998). Firstly, this scheme placed the base of SBZ12 within calcareous nannofossil zone CP12a (Fig. 10). Nevertheless, in Otsakar the latter part of calcareous nannofossil zone CP11 correlates with SBZ12. Secondly, and more importantly, the position of the top of SBZ12 within calcareous nannofossil Zone CP12a and at the C22n/C21r chron boundary, as shown by Serra-Kiel et al. (Reference Serra-Kiel, Hottinger, Caus, Drobne, Ferrandez, Jauhri, Less, Pavlovec, Pignatti, Samso, Schaub, Sirel, Strougo, Tambareau, Tosquella and Zakrevskaya1998), is not supported by the Otsakar results. In Otsakar, the top of SBZ12 was found much higher than the C22n/C21r chron boundary, close to the base of Zone CP12b (Fig. 10). This is not the first study to find the top of SBZ12 higher than in the standard scheme. In fact, a similar situation was also found in Gorrondatxe (Bernaola et al. Reference Bernaola, Orue-Etxebarria, Payros, Dinarès-Turell, Tosquella, Apellaniz and Caballero2006). Using the Agost section data, Larrasoaña et al. (Reference Larrasoaña, Gonzalvo, Molina, Monechi, Ortiz, Tori and Tosquella2008) also suggested that the top of SBZ12 correlates with Zone CP12b. Payros et al. (Reference Payros, Tosquella, Bernaola, Dinarès-Turell, Orue-Etxebarria and Pujalte2009c), by updating the obsolete taxonomic classification used by Kapellos & Schaub (Reference Kapellos and Schaub1973) to report nummulitids and calcareous nannofossils from the Esera section (central Pyrenees), concluded that the latter authors found the top of SBZ12 within Zone CP12b. Taking everything into account, it can be argued that the new position of the top of SBZ12, as approximately correlated in Otsakar with the calcareous nannofossil CP12a/b zonal boundary and with Chron C21r, is probably the oldest position reported to date and that, therefore, may be the most accurate.
Comparison between the Early/Middle Eocene boundary biomagnetochronological time scales (grey columns – Gradstein, Ogg & Smith, Reference Gradstein, Ogg and Smith2004; white columns – this study). The left-hand grey column in the Geochronology section shows the position of the Early/Middle Eocene (Ypresian/Lutetian) boundary before definition of the Lutetian GSSP; the middle grey column shows its position after definition of the Lutetian GSSP (Molina et al. Reference Molina, Alegret, Apellaniz, Bernaola, Caballero, Hardenbol, Heilmann-Clausen, Larrasoaña, Luterbacher, Monechi, Ortiz, Orue-Etxebarria, Payros, Pujalte, Rodríguez-Tovar, Tori and Tosquella2009) and assumption of the age of the marker event (CP12a/b) in Gradstein, Ogg & Smith (Reference Gradstein, Ogg and Smith2004); the right-hand white column shows the position of that boundary after this study. The duration of the Early Eocene (Ypresian) is given for each case, assuming a 55.8 Ma age for the base of the Eocene (Gradstein, Ogg & Smith, Reference Gradstein, Ogg and Smith2004).

The Otsakar results also show that the bases of the standard planktonic foraminiferal zones E8 and P10 do not correlate with the calcareous nannofossil Zone CP12a and neither with the C22n/C21r chron boundary, as previously assumed in standard Palaeogene chronostratigraphic schemes (Fig. 10; Berggren et al. Reference Berggren, Kent, Swisher, Aubry, Berggren, Kent, Aubry and Hardenbol1995; Gradstein, Ogg & Smith, Reference Gradstein, Ogg and Smith2004; Berggren & Pearson, Reference Berggren and Pearson2005). Although zones E8 and P10 were not found in Otsakar, the available data show that both planktonic foraminiferal zones must be considerably younger than indicated in standard schemes, confirming previous suggestions by Payros et al. (Reference Payros, Bernaola, Orue-Etxebarria, Dinarès-Turell, Tosquella and Apellaniz2007), Larrasoaña et al. (Reference Larrasoaña, Gonzalvo, Molina, Monechi, Ortiz, Tori and Tosquella2008), Ortiz et al. (Reference Ortiz, Gonzalvo, Molina, Rodriguez-Tovar, Uchman, Vandenberghe and Zeelmaekers2008) and Rögl & Egger (Reference Rögl and Egger2010). Moreover, the Otsakar data back up the results obtained by Payros et al. (Reference Payros, Orue-Etxebarria, Bernaola, Apellaniz, Dinarès-Turell, Tosquella and Caballero2009a) in Gorrondatxe, which suggested that the planktonic foraminiferal event that lies closest to the Lutetian GSSP is the first occurrence of T. frontosa, which is 550 ka older. The fact that identical conclusions were reached in different Eocene basins clearly confirms that the standard chronostratigraphic correlation framework needed to be amended (Payros et al. Reference Payros, Bernaola, Orue-Etxebarria, Dinarès-Turell, Tosquella and Apellaniz2007, Reference Payros, Orue-Etxebarria, Bernaola, Apellaniz, Dinarès-Turell, Tosquella and Caballero2009a).
6. Conclusions
The integrated bio-, magneto- and cyclostratigraphic results from Otsakar show that the CP12a/b boundary is 819 ka (39 precession couplets) younger than the C22n/C21r chron boundary. Similar studies from Gorrondatxe suggest that the CP12a/b boundary is 507 ka older than the C21r/C21n chron boundary (Fig. 9). The combination of these cyclostratigraphic results suggests that the whole duration of Chron C21r could be 1.326 Ma, a figure that is very similar to, and midway between, previous estimates. Given that the first occurrence of the calcareous nannofossil Blackites inflatus (marker taxon of the CP12a/b boundary) has been considered as the main correlation criterion for the recently defined Lutetian GSSP (Molina et al. Reference Molina, Alegret, Apellaniz, Bernaola, Caballero, Hardenbol, Heilmann-Clausen, Larrasoaña, Luterbacher, Monechi, Ortiz, Orue-Etxebarria, Payros, Pujalte, Rodríguez-Tovar, Tori and Tosquella2009), the magnetostratigraphic and cyclostratigraphic calibration carried out herein will be useful in the identification of the Early/Middle Eocene boundary in successions without that biostratigraphic information. Furthermore, our results show that the age of the Lutetian GSSP needs to be refined (Fig. 10). This age was estimated at 48 Ma on the basis of the CP12a/b boundary age provided in standard time scales (Gradstein, Ogg & Smith, Reference Gradstein, Ogg and Smith2004). However, it has long been acknowledged that the CP12a/b boundary was one of the most poorly dated Eocene events. According to the new findings, the age of the Lutetian GSSP, and hence that of the Early/Middle Eocene boundary, should be established at approximately 47.76 Ma, practically 250 ka younger than previously thought. This means that the duration of the Early Eocene must be reassessed. Taking into account that the base of the Eocene is officially dated at 55.8 Ma, the duration of the Early Eocene (Ypresian Stage) is now 8 Ma, being therefore 0.8 Ma longer than in current geological time scales (Gradstein, Ogg & Smith, Reference Gradstein, Ogg and Smith2004). However, it must be emphasized that the precise age of the base of the Early Eocene, as calculated by means of astronomically tuned cyclostratigraphy, is currently a fiercely debated topic (Dinarès-Turell et al. Reference Dinarès-Turell, Baceta, Pujalte, Orue-Etxebarria and Bernaola2002, Reference Dinarès-Turell, Baceta, Bernaola, Orue-Etxebarria and Pujalte2007; Westerhold et al. Reference Westerhold, Röhl, Mccarren and Zachos2009; Galeotti et al. Reference Galeotti, Krishnan, Pagani, Lanci, Gaudio, Zachos, Monechi, Morelli and Lourens2010).
The Otsakar results provide further refinements to the Early/Middle Eocene biomagnetochronology. Thus, the new results show that the calcareous nannofossil CP12a/b zonal boundary, which is the main correlation criterion for the Early/Middle Eocene boundary, and the nummulitid SBZ12/13 boundary may be practically coeval (Fig. 10). Our results also confirm the amendments made by Payros et al. (Reference Payros, Bernaola, Orue-Etxebarria, Dinarès-Turell, Tosquella and Apellaniz2007, Reference Payros, Orue-Etxebarria, Bernaola, Apellaniz, Dinarès-Turell, Tosquella and Caballero2009a) to the Early/Middle Eocene time scale on the basis of data from Gorrondatxe. Most importantly, it can be concluded that the bases of the planktonic foraminiferal E8 and P10 zones do not correlate with calcareous nannofossil Zone CP12a and the C22n/C21r chron boundary, but are much younger. In addition, the Otsakar information supports previous estimates by Payros et al. (Reference Payros, Orue-Etxebarria, Bernaola, Apellaniz, Dinarès-Turell, Tosquella and Caballero2009a) that suggested that the first occurrence of T. frontosa is the planktonic foraminiferal event that lies closest to the CP12a/b boundary, being approximately 550 ka older than the Early/Middle Eocene boundary.
Acknowledgements
Field and laboratory works were funded by the Basque Government (Research Project GIC07/122-IT-215–07 of the Basque University System) and the Department of Science and Innovation of the Spanish Government (Research Projects CGL2008-01780/BTE, CGL2008-00009/BTE, CGL2008-00809/BTE and CTM2006-06722/MAR). Thanks are due to Eustoquio Molina (University of Zaragoza) for his encouragement and insightful comments on a previous manuscript and to Carl Sheaver for his language corrections.