1. Introduction
Magnetic helicity conservation is often considered as one of the most important ingredients in magnetic field generation for the Sun and other solar type stars (Brandenburg & Subramanian Reference Brandenburg and Subramanian2005; Blackman & Thomas Reference Blackman and Thomas2015). It is also important for magnetic activities in the solar atmosphere and corona (Mackay & Yeates Reference Mackay and Yeates2012). Magnetic helicity characterizes the complexity of the magnetic field topology in a closed volume (Berger & Field Reference Berger and Field1984). Observing the magnetic field on the surface we can deduce some local proxies of the helicity integral. The observational constraints of the solar dynamo models are related to the hemispheric helicity rule (HRR) (Pevtsov, Canfield & Metcalf Reference Pevtsov, Canfield and Metcalf1994; Seehafer Reference Seehafer1994) and the magnetic helicity fluxes from the solar interior (Berger & Ruzmaikin Reference Berger and Ruzmaikin2000; Blackman & Brandenburg Reference Blackman and Brandenburg2003). The HHR follows from the theoretical properties of the large-scale dynamo which we expect to be working in the solar interior. This rule states that the small-scale magnetic fields on the northern hemisphere have a negative twist (the right-hand coordinate system) and the opposite twist occurs in the southern hemisphere. In dynamo theory the small scales include the scale of the solar active regions and smaller scales. The helicity conservation constrains the helicity sign distribution over the spatial scales. The results of Pouquet, Frisch & Léorat (Reference Pouquet, Frisch and Léorat1975) showed that in turbulent dynamo processes we can expect that the twist of the large-scale magnetic field is opposite to the twist of the small-scale magnetic field. This property is also called the bi-helical dynamo.
The vector magnetic field observations make it possible to deduce information about the magnetic and current helicity density on the solar surface (Pevtsov et al. Reference Pevtsov, Canfield and Metcalf1994; Bao & Zhang Reference Bao and Zhang1998; Zhang et al. Reference Zhang, Sakurai, Pevtsov, Gao, Xu, Sokoloff and Kuzanyan2010). In general, these proxies show the HHR for the small-scale magnetic field. The issues about the HHR of the large-scale magnetic field and the bi-helical solar dynamo are still debatable (Brandenburg, Petrie & Singh Reference Brandenburg, Petrie and Singh2017; Singh et al. Reference Singh, Käpylä, Brandenburg, Käpylä, Lagg and Virtanen2018; Pipin et al. Reference Pipin, Pevtsov, Liu and Kosovichev2019).
However, the relevance of the local proxies, which are observed on the surface, as the proxies of the bi-helical magnetic fields generated by the dynamo processes in the depth of the convection zone can be questioned. On the surface some of the helical magnetic field configurations can be generated by means of other processes which are not readily related to the dynamo. For example, the emergence of the magnetic field on the surface and its interaction with the ambient magnetic field can produce a local helicity flux. Hawkes & Yeates (Reference Hawkes and Yeates2019) showed one such example (see figure 4c in their paper). They illustrated that the emerging bipolar region which interacts with the global magnetic field results in a local quadrupole helicity density flux pattern. It is interesting that this effect drives the helicity density flux butterfly diagrams, which are satisfying their own HHR (see the figure 3c in their paper). Another similar kind of effect was illustrated by Pipin et al. (Reference Pipin, Pevtsov, Liu and Kosovichev2019) in their benchmark dynamo model. Here we elaborate on this example and study the effect of the emerging bipolar regions on the surface helicity density patterns. Note, on the solar surface most magnetic activity is produced by sunspots (Stenflo Reference Stenflo2013). We find that the emerging active regions can create a bias in our conclusions about the helical properties of the dynamo inside the convection zone. This study is based on the numerical simulations of the non-axisymmetric dynamo model, which was suggested recently by Pipin & Kosovichev (Reference Pipin and Kosovichev2018). The next section describes the model.
2. Dynamo model
Evolution of a large-scale magnetic field in perfectly conductive media is described by the mean-field induction equation (Krause & Rädler Reference Krause and Rädler1980):
 \begin{equation} \partial_{t}\left\langle \boldsymbol{B}\right\rangle =\boldsymbol{\nabla} \times\left({\boldsymbol{\mathcal{E}}}+\left\langle \boldsymbol{U}\right\rangle \times\left\langle \boldsymbol{B}\right\rangle \right), \end{equation}
where  $\boldsymbol {\mathcal {E}}=\langle \boldsymbol {u}\boldsymbol {\times } \boldsymbol {b}\rangle$ is the mean electromotive force;
 $\boldsymbol {u}$ and
 $\boldsymbol {b}$ are the turbulent fluctuating velocity and magnetic field respectively; and
 $\langle \boldsymbol {U}\rangle$ and
 $\langle \boldsymbol {B}\rangle$ are the mean velocity and magnetic field. Pipin & Kosovichev (Reference Pipin and Kosovichev2018) (PK18) suggested a minimal set of dynamo equations to model non-axisymmetric magnetic field evolution. In our model, similarly to Moss et al. (Reference Moss, Sokoloff, Usoskin and Tutubalin2008), we neglect the radial dependence of magnetic field, and assume that the radial gradient of angular velocity is greater than the latitudinal gradient. In earlier studies, e.g. Jennings et al. (Reference Jennings, Brandenburg, Tuominen and Moss1990), it was found that neglecting terms related to
 $r$ dependence may cause significant reduction of the threshold for magnetic field excitation by a dynamo process. Therefore, we construct the model in such a way that it holds the results of Moss et al. (Reference Moss, Sokoloff, Usoskin and Tutubalin2008) in the limit of the axisymmetric one-dimensional case. Therefore, the results of the model have an illustrative character which is typical for toy dynamo models.
It is convenient to represent the vector  $\langle \boldsymbol {B}\rangle$ in terms of the axisymmetric and non-axisymmetric components as follows:
 \begin{gather} \left\langle \boldsymbol{B}\right\rangle = \bar{\boldsymbol{B}}+\tilde{\boldsymbol{B}}, \end{gather}
 \begin{gather}\bar{\boldsymbol{B}} = \hat{\boldsymbol{\phi}}B+\boldsymbol{\nabla}\times \left(A\hat{\boldsymbol{\phi}}\right), \end{gather}
 \begin{gather}\tilde{\boldsymbol{B}} = \boldsymbol{\nabla}\times\left(\boldsymbol{r}T\right)+ \boldsymbol{\nabla}\times\boldsymbol{\nabla}\times\left(\boldsymbol{r}S\right), \end{gather}
where  $\bar {\boldsymbol {B}}$ and
 $\tilde {\boldsymbol {B}}$ are the axisymmetric and non-axisymmetric components;
 ${A}$,
 ${B}$,
 ${T}$ and
 ${S}$ are scalar functions representing the field components;
 $\hat {\boldsymbol {\phi }}$ is the azimuthal unit vector,
 $\boldsymbol {r}$ is the radius vector;
 $r$ is the radial distance, and
 $\theta$ is the polar angle. Krause & Rädler (Reference Krause and Rädler1980) showed that the only gauge transformation for potentials
 $T$ and
 $S$ is a sum with the arbitrary
 $r$-dependent function. To fix this arbitrariness they suggested the following normalization:
 \begin{equation} \int_{0}^{2{\rm \pi}}\int_{{-}1}^{1}S\,\textrm{d}\mu \,\textrm{d}\phi=\int_{0}^{2{\rm \pi}}\int_{{-}1}^{1}T\, \textrm{d}\mu \,\textrm{d}\phi=0.\end{equation}
Hereafter, the over-bar denotes the axisymmetric magnetic field, and tilde denotes non-axisymmetric properties. Following the above ideas we consider a reduced dynamo model where we neglect the radial dependence of the magnetic field. In this case, the induction vector of the large-scale magnetic field is represented in terms of the scalar functions as follows:
 \begin{equation} \left\langle \boldsymbol{B}\right\rangle ={-}\frac{\boldsymbol{\hat{r}}}{R^{2}}\frac{\partial\sin\theta A}{\partial\mu}- \frac{\hat{\theta}}{R}A+\hat{\boldsymbol{\phi}}B - \frac{\hat{\boldsymbol{r}}}{R^{2}}\varDelta_{\varOmega}S+\frac{\hat{\theta}}{\sin\theta}\frac{\partial T}{\partial\phi}+\hat{\phi}\sin\theta\frac{\partial T}{\partial\mu},\end{equation}
where  $R$ represents the radius of the spherical surface inside a star where the hydromagnetic dynamo operates. The above equation defines the three-dimensional divergency free
 $B$-field on the sphere. In the model we employ the simple expression of
 $\boldsymbol {\mathcal {E}}$:
 \begin{equation} \boldsymbol{\mathcal{E}} = \alpha\left\langle \boldsymbol{B}\right\rangle -\eta_{T}\boldsymbol{\nabla}\times\left\langle \boldsymbol{B}\right\rangle +V_{\beta}\hat{\boldsymbol{r}}\times\left\langle \boldsymbol{B}\right\rangle +\alpha_{\beta}\hat{\boldsymbol{\phi}}\left\langle \boldsymbol{B}\right\rangle _{\phi}. \end{equation}
The last term is introduced to simulate the tilt of the emerging active regions. The magnetic buoyancy is the source of the non-axisymmetric magnetic field in the model. We assume that the magnetic buoyancy acts on relatively small-scale parts of the axisymmetric magnetic field, and perhaps it is caused by some kind of nonlinear instability. This effect cannot be derived within the mean-field magnetohydrodynamic framework. The main purpose for introducing this effect is to mimic the bipolar region formation on the solar surface. Following the results of Pipin & Kosovichev (Reference Pipin and Kosovichev2018), the effect satisfactory reproduces the bipolar structure of the radial magnetic field which can be observed in the simple active regions. We assume that the magnetic buoyancy velocity depends on the strength of the large-scale magnetic field and the random longitudinal position. It is formulated as follows:
 \begin{equation} V_{\beta}=\left\{\begin{array}{ll} \dfrac{\alpha_{\textrm{MLT}}}{\gamma}u_{c}\beta^{2}K(\beta)(1+\xi_{\beta}(\phi,\theta)), & \beta \geqslant\beta_{\textrm{cr}},\\ 0, & \beta<\beta_{\textrm{cr}}, \end{array}\right. \end{equation}
where  $\alpha _{\mathrm {MLT}}=1.9$ is the mixing-length theory parameter,
 $\gamma$ is the adiabatic law constant,
 $\beta =|\langle \boldsymbol {B}\rangle |/B_{\mathrm {eq}}$,
 $B_{\mathrm {eq}}=\sqrt {4{\rm \pi} \bar {\rho }u_{c}^{2}}$ and function
 $K(\beta )$ is defined in Kitchatinov & Pipin (Reference Kitchatinov and Pipin1993). For
 $\beta \ll$1, we have
 $K(\beta )\sim 1$, and for the strong magnetic field, when
 $\beta >$1,
 $K(\beta )\sim 1/\beta ^{3}$. The function
 $\xi _{\beta }(\phi ,\theta )$ describes the latitudinal and longitudinal dependences of the instability, and parameter
 $\beta _{cr}$ controls the instability threshold. In this formulation, the preferable latitude of the ‘active region emergence’ is determined by the latitude of the maximum of the toroidal magnetic field energy,
 $\theta _{\mathrm {max}}$. The magnetic buoyancy instability perturbations are determined by the function
 \begin{equation} \xi_{\beta}\left(\phi,\theta\right)=C_{\beta}\exp\left({-}m_{\beta}\left(\sin^{2}\left( \frac{\phi-\phi_{0}}{2}\right)+\sin^{2}\left(\frac{\theta-\theta_{\mathrm{max}}}{2}\right)\right)\right).\end{equation}
The instability is randomly initiated in the northern or southern hemispheres, and the longitude,  $\phi _{0}$, is also chosen randomly. We arbitrarily chose the fluctuation interval
 $\tau _{\beta }=0.01P_{\textrm {cyc}}$, where
 $P_{\textrm {cyc}}$ is the dynamo cycle period. The dynamic of the buoyancy instability is restricted by the five time run-steps, i.e. we put the function
 $\xi _{\beta }(\phi ,\theta )$ to zero after five steps from initiation. The given period roughly corresponds to a few days. In the model we measure the time in diffusive units,
 $R^{2}/\eta _{T}$. If we scale the dynamo period of the model to 11 years, then the simulated emerging time is about one week, which is much longer than for the Sun (Toriumi & Wang Reference Toriumi and Wang2019). Parameter
 $m_{\beta }$ controls the spatial scale of the instability. Theoretically, using high values of
 $m$ we can reproduce the spatial scale of the solar active regions. However, this requires increasing the resolution both in longitude and latitude. This makes a toy model computationally expensive. We choose the value
 $m_{\beta }=1/\delta \phi ^{2}$,
 $\delta \phi =2^{\circ }$, which allows us to accurately resolve the evolving non-axisymmetric perturbations of the magnetic field, and qualitatively reproduce the essential physical effects. Parameter
 $C_{\beta }$ controls the amount of the injected magnetic flux. If the large-scale toroidal magnetic flux at a given co-latitude
 $\theta$ is transformed into the magnetic flux of the perturbation, then
 $\langle \xi _{\beta }(\phi ,t)\rangle _{\phi }\approx 1$. This condition corresponds to
 $C_{\beta }\approx 15$. In reality, solar active regions are formed by concentrations of the toroidal magnetic flux emerging into the photosphere. Turbulent convective motions and other physical processes may take part in the process of formation of solar active regions. Therefore, parameter
 $C_{\beta }$ can be higher than the above-mentioned value. Similarly to Pipin & Kosovichev (Reference Pipin and Kosovichev2018), we choose
 $C_{\beta }=40$. In the numerical experiments, we found that higher values of
 $C_{\beta }$ result in strong cycle-to-cycle variability of the magnetic energy, even in the case of the stationary
 $\alpha$ effect. For the chosen
 $C_{\beta }$,
 $|\langle \boldsymbol {B}\rangle |\approx 2|\overline {B_{\phi }}|$, and therefore fluctuations of the magnetic field because of the magnetic buoyancy instability are of the order of the axisymmetric toroidal magnetic field strength, which is widely accepted in the literature (Krause & Rädler Reference Krause and Rädler1980; Brandenburg & Subramanian Reference Brandenburg and Subramanian2005).
In the model the strength of the magnetic field is measured relative to the strength of the equipartition field,  $B_{\mathrm {eq}}$. The dependence of the instability on the toroidal magnetic field strength results in magnetic cycle modulation in a number of bipolar regions. Besides, the critical parameter
 $\beta _{\textrm {cr}}=0.5$ prevents the emergence of active regions at high latitudes. The fact that
 $\beta _{\textrm {cr}} \leqslant 1$ ensures that the magnetic field strength in the emerged bipolar regions is about the equipartition value. To get the model closer to observations, the temporal and spatial resolutions have to be increased. Bearing in mind the whole simplicity of our model, we restrict ourselves to qualitative considerations. In our description, the magnetic buoyancy instability results in generation of the magnetic bipolar regions. These regions supply the energy for the large-scale non-axisymmetric magnetic field of the Sun. Besides, the magnetic buoyancy instability results in magnetic flux loss and large-scale dynamo saturation for the magnetic field strength
 $|\boldsymbol {B}|>0.5B_{\mathrm {eq}}$. This was anticipated earlier, e.g. by Parker (Reference Parker1984) and Noyes, Weiss & Vaughan (Reference Noyes, Weiss and Vaughan1984).
In this paper we would like to calculate the magnetic helicity flux provided by the emergence of the tilted active regions on the solar surface. For this purpose, we assume that the emerging part of the toroidal magnetic field is subjected to some extra  $\alpha$ effect, which is caused by the dynamics of the magnetic loop. Note that the dynamics of the buoyancy instability is restricted to five time run-steps. With this choice, we find that a
 $5^{\circ }$ tilt (Tlatov et al. Reference Tlatov, Illarionov, Sokoloff and Pipin2013) can be reproduced if we put
 \begin{equation} \alpha_{\beta}=0.33\cos\theta V_{\beta},\end{equation}
where  $V_{\beta }$ is determined by (2.8) and the coefficient 0.33 was found by the numerical experiments. In the case when
 $\alpha _{\beta }=V_{\beta }$ the tilt is around
 ${\rm \pi} /4$. Note that the first term in (2.7) includes the
 $\alpha$ effect which acts on the unstable part of the non-axisymmetric magnetic field and produces some amount of tilt as well. We find this effect negligible in comparison observations. We deliberately assume that the
 $\alpha _{\beta }$ effect acts only on the non-axisymmetric part of the magnetic field. In this case, it does not change the conditions for the linear stability of the axisymmetric magnetic field.
For the standard part of the  $\alpha$ effect we use the phenomenological description and take into account the contribution of the magnetic helicity following the suggestions of Pouquet et al. (Reference Pouquet, Frisch and Léorat1975):
 \begin{equation} \alpha = \alpha_{0}\cos\theta+\frac{\left\langle \boldsymbol{b}\boldsymbol{\cdot}\boldsymbol{\nabla}\times\boldsymbol{b}\right\rangle \tau_{c}}{4{\rm \pi}\bar{\rho}}, \end{equation}
where  $\alpha _{0}$ is a free positive parameter which controls the strength of the
 $\alpha$ effect. The results of the above-cited paper suggest that the negative sign of the small-scale current helicity results from magnetic helicity conservation. Following Moffatt (Reference Moffatt1978), we insert
 $\langle \boldsymbol {b}\boldsymbol {\cdot }\boldsymbol {\nabla }\times \boldsymbol {b}\rangle \sim \langle \chi \rangle /\ell ^{2}$, where
 $\langle \chi \rangle$ is the magnetic helicity density,
 $\langle \chi \rangle =\langle \boldsymbol {a}\boldsymbol {\cdot }\boldsymbol {b}\rangle$ (
 $\boldsymbol {a}$ and
 $\boldsymbol {b}$ are the fluctuating parts of the magnetic field vector potential and the magnetic field vector, respectively). Magnetic helicity conservation results in dynamical quenching of the dynamo (Kleeorin & Ruzmaikin Reference Kleeorin and Ruzmaikin1982; Kleeorin & Rogachevskii Reference Kleeorin and Rogachevskii1999; Kleeorin et al. Reference Kleeorin, Moss, Rogachevskii and Sokoloff2000). For the sake of simplicity, the above equation (2.10) has no explicit inclusion of magnetic helicity. This is partly justified by the fact that in our formulation the
 $\alpha _{\beta }$ term is not a primary dynamo effect. This is in contrast to the Babcock–Leighton scenario for the solar dynamo (Charbonneau Reference Charbonneau2011). By following (Blackman & Brandenburg Reference Blackman and Brandenburg2003), we can anticipate that explicit addition of the magnetic helicity term in (2.10) will result in reduction of the bipolar region tilt. Also, we do not include any algebraic quenching (see Ruediger & Kichatinov Reference Ruediger and Kichatinov1993) in the
 $\alpha$-effect contributions in (2.10) and (2.11). For a simple plane model like ours, the only result of the algebraic
 $\alpha$ quenching is the reduction of the magnitude of the generated toroidal magnetic field. We find that the model reproduces the finite-amplitude dynamo waves of the reference model of Moss et al. (Reference Moss, Sokoloff, Usoskin and Tutubalin2008) even for the case when we have only nonlinear effects due to the magnetic buoyancy term. Therefore, we skip the algebraic
 $\alpha$ quenching in our calculations.
Similarly to Hubbard & Brandenburg (Reference Hubbard and Brandenburg2012), Pipin et al. (Reference Pipin, Sokoloff, Zhang and Kuzanyan2013) and Brandenburg (Reference Brandenburg2018), in our model we use the global conservation law for the total magnetic helicity. In this case the magnetic helicity density,  $\langle \chi \rangle =\langle \boldsymbol {a}\boldsymbol {\cdot }\boldsymbol {b}\rangle$, is governed by the equation
 \begin{equation} \left(\frac{\partial}{\partial t}+\left\langle \boldsymbol{U}\right\rangle \boldsymbol{\cdot}\boldsymbol{\nabla} \right)\left\langle \chi\right\rangle ^{(\textrm{tot})}={-}\frac{\left\langle \chi\right\rangle }{R_{m}\tau_{c}}-2 \eta\left\langle \boldsymbol{B}\right\rangle \boldsymbol{\cdot}\left\langle \boldsymbol{J}\right\rangle -\boldsymbol{\nabla}\boldsymbol{\cdot}{\boldsymbol{\mathcal{F}}}^{\chi},\end{equation}
where  $\langle \chi \rangle ^{(\textrm {tot})}=\langle \chi \rangle +\langle \boldsymbol {A}\rangle \boldsymbol {\cdot }\langle \boldsymbol {B}\rangle$ is the total magnetic helicity density of the mean and turbulent fields. It is assumed that
 $\boldsymbol {\nabla }\boldsymbol {\cdot }\langle \boldsymbol {U}\rangle =0$. Note that in the derivations of (2.12), following Kleeorin & Rogachevskii (Reference Kleeorin and Rogachevskii1999), we have
 $2\eta \langle \boldsymbol {b}\boldsymbol {\cdot }\boldsymbol {j}\rangle ={\langle \chi \rangle }/{R_{m}\tau _{c}}$. The heuristic term
 ${\boldsymbol {\mathcal {F}}}^{\chi }=-\eta _{\chi }\boldsymbol {\nabla }\langle \chi \rangle ^{(\textrm {tot})}$ is the diffusive flux of the total magnetic helicity, and
 $R_{m}$ is the magnetic Reynolds number. The coefficient of the turbulent helicity diffusivity,
 $\eta _{\chi }$, is chosen to be 10 times smaller than the isotropic part of the magnetic diffusivity (Mitra et al. Reference Mitra, Candelaresi, Chatterjee, Tavakol and Brandenburg2010):
 $\eta _{\chi }=\frac {1}{10}\eta _{T}$. Here, in comparison to the axisymmetric model of Pipin et al. (Reference Pipin, Sokoloff, Zhang and Kuzanyan2013), we have to take into account the redistribution of the non-axisymmetric part of the magnetic helicity by the differential rotation. Our ansatz differs from that suggested in the papers of Kleeorin & Ruzmaikin (Reference Kleeorin and Ruzmaikin1982) and Kleeorin & Rogachevskii (Reference Kleeorin and Rogachevskii1999). Here, the turbulent fluxes of the magnetic helicity are approximated by the only term which is related to the diffusive flux. Pipin et al. (Reference Pipin, Sokoloff, Zhang and Kuzanyan2013) found that dynamo models where helicity evolution follows (2.12) show a magnetic helicity wave propagating with the dynamo wave. This alleviates the so-called catastrophic quenching of the
 $\alpha$ effect (Brandenburg Reference Brandenburg2018).
Similarly to the magnetic field, the mean magnetic helicity density can be formally decomposed into axisymmetric and non-axisymmetric parts:  $\langle \chi \rangle ^{(\textrm {tot})}=\bar {\chi }^{(\textrm {tot})}+\tilde {\chi }^{(\textrm {tot})}$. The same can be done for the magnetic helicity density of the turbulent field:
 $\langle \chi \rangle =\bar {\chi }+\tilde {\chi }$, where
 $\bar {\chi }=\overline {\boldsymbol {a}\boldsymbol {\cdot }\boldsymbol {b}}$ and
 $\tilde {\chi }=\widetilde {\langle \boldsymbol {a}\boldsymbol {\cdot }\boldsymbol {b}\rangle }$. Then we have
 \begin{gather} \bar{\chi}^{(\textrm{tot})} = \bar{\chi}+\bar{\boldsymbol{A}} \boldsymbol{\cdot}\bar{\boldsymbol{B}}+\overline{\tilde{\boldsymbol{A}}\boldsymbol{\cdot}\tilde{\boldsymbol{B}}}, \end{gather}
 \begin{gather}\tilde{\chi}^{(\textrm{tot})} = \tilde{\chi}+\bar{\boldsymbol{A}} \boldsymbol{\cdot}\tilde{\boldsymbol{B}}+\tilde{\boldsymbol{A}}\boldsymbol{\cdot} \bar{\boldsymbol{B}}+\tilde{\boldsymbol{A}}\boldsymbol{\cdot}\tilde{\boldsymbol{B}}. \end{gather}
Evolution of  $\bar {\chi }$ and
 $\tilde {\chi }$ is governed by the corresponding parts of (2.12). Thus, the model takes into account the contributions of the axisymmetric and non-axisymmetric magnetic fields in the whole magnetic helicity density balance, providing a nonlinear coupling. We see that the
 $\alpha$ effect is dynamically linked to the longitudinally averaged magnetic helicity of the
 $\tilde {\boldsymbol {B}}$-field, which is the last term in (2.13). Thus, the nonlinear
 $\alpha$ effect is non-axisymmetric, and it contributes to coupling between the
 $\bar {\boldsymbol {B}}$ and
 $\tilde {\boldsymbol {B}}$ modes. The coupling works in both directions. For instance, the azimuthal
 $\alpha$ effect results in
 $\mathcal {E}_{\phi }=\alpha \langle B_{\phi }\rangle +\alpha _{\beta }\tilde {B}_{\phi }$. If we denote the non-axisymmetric part of the
 $\alpha$ by
 $\tilde {\alpha }$, then the mean electromotive force is
 $\bar {\mathcal {E}}_{\phi }=\bar {\alpha }\bar {B}_{\phi }+\overline {\tilde {\alpha }\tilde {B}_{\phi }}+ \overline {\alpha _{\beta }\langle B\rangle _{\phi }}$. This introduces a new generation source which is usually ignored in the axisymmetric dynamo models. Magnetic helicity conservation is determined by the magnetic Reynolds number
 $R_{m}$. In this paper we employ
 $R_{m}=10^{6}$.
Helicity conservation in the form of equation (2.12) is suitable for the dynamo simulation. To estimate the helicity flux from the dynamo we will follow the approach of Berger & Ruzmaikin (Reference Berger and Ruzmaikin2000). We derive the equation for the small-scale helicity integral in appendix 3. Following their method, the change of the helicity integral is determined by the dynamo processes inside and the helicity fluxes out of the dynamo regions as follows:
 \begin{align} \left(\frac{\textrm{d}}{\textrm{d}t}+\frac{1}{R_{m}\tau_{c}}\right)\int\left\langle \chi\right\rangle \textrm{d}V & ={-}2\int{\boldsymbol{{\mathcal{E}}}}\boldsymbol{\cdot}\left\langle \boldsymbol{B}\right\rangle \mathrm{d}V-\int{\boldsymbol{\mathcal{F}}}^{\chi} \boldsymbol{\cdot}\boldsymbol{n}\,\mathrm{d}S\nonumber\\ & \quad -2\oint\left(\left\langle \boldsymbol{A}\right\rangle \boldsymbol{\cdot} \left\langle \boldsymbol{U}\right\rangle \right)\left(\left\langle \boldsymbol{B}\right\rangle \boldsymbol{\cdot}\boldsymbol{n}\right)\mathrm{d}S- 2\oint\left({\boldsymbol{\mathcal{E}}}\times\left\langle \boldsymbol{A}\right\rangle \right) \boldsymbol{\cdot}\boldsymbol{n}\,\mathrm{d}S \nonumber\\ & \quad -2\eta\oint\left(\left\langle \boldsymbol{A}\right\rangle \times\left\langle \boldsymbol{J}\right\rangle \right)\boldsymbol{\cdot}\boldsymbol{n}\,\mathrm{d}S+ \oint\left(\left\langle \boldsymbol{A}\right\rangle \boldsymbol{\cdot}\left\langle \boldsymbol{B}\right\rangle \right)\left(\left\langle \boldsymbol{U}\right\rangle \boldsymbol{\cdot}\boldsymbol{n}\right)\mathrm{d}S. \end{align}
This equation is fully compatible with (2.12). It is suitable for estimation of the helicity fluxes out of the dynamo domain. The first term in the second line of (2.15) defines the helicity flux due to the differential rotation:
 \begin{equation} F_{\varOmega}={-}2\left\langle B_{r}\right\rangle \left\langle A_{\phi}\right\rangle \bar{U}_{\phi}.\end{equation}
The second term, i.e.  $-2\oint ({\boldsymbol {\mathcal {E}}}\times \langle \boldsymbol {A}\rangle )\boldsymbol {\cdot }\boldsymbol {n}\,\mathrm {d}S$, describes the helicity fluxes due to the effect of the turbulent flows and magnetic field. The expression of the mean electromotive force contains contributions from the
 $\alpha$ effect, turbulent diffusivity and the magnetic buoyancy. For this study we skip the effect of the turbulent diffusivity. Note that this flux is additive to the term in the third line of (2.15). In our discussion, we include contributions due to the
 $\alpha$ and magnetic buoyancy effects:
 \begin{gather} -2\left({\boldsymbol{\mathcal{E}}}\times\left\langle \boldsymbol{A}\right\rangle \right) \boldsymbol{\cdot}\boldsymbol{n} = F_{\alpha}+F_{\beta}+\dots, \end{gather}
 \begin{gather}F_{\alpha} ={-}2\alpha\left(\left\langle B_{\theta}\right\rangle \left\langle A_{\phi}\right\rangle -\left\langle B_{\phi}\right\rangle \left\langle A_{\theta}\right\rangle \right)+2\alpha_{\beta}\left\langle B_{\phi}\right\rangle \left\langle A_{\theta}\right \rangle, \end{gather}
 \begin{gather}F_{\beta} = 2V_{\beta}\left(\left\langle B_{\theta}\right\rangle \left\langle A_{\theta}\right\rangle +\left\langle B_{\phi}\right\rangle \left\langle A_{\phi}\right\rangle \right). \end{gather}
Note that both the axisymmetric and the non-axisymmetric modes contribute to all terms in (2.17).
Equations (2.1) and (2.12) are solved numerically in non-dimensional form. We assume that the rotational shear is constant in latitude. The effect of differential rotation is controlled by the non-dimensional parameter  $R_{\omega }=({R^{2}}/{\eta _{T}}) ({\partial \varOmega }/{\partial r})$, the
 $\alpha$ effect is measured by parameter
 $R_{\alpha }= {R\alpha _{0}}/{\eta _{T}}$, the magnetic buoyancy depends on
 $R_{\beta }=({R}/{\eta _{T}})(\alpha _{\mathrm {MLT}}u_{c}/\gamma )$ and the magnetic field is measured relative to the equipartition strength
 $B_{\mathrm {eq}}=\sqrt {4{\rm \pi} \bar {\rho }u'^{2}}$. Similarly to Pipin & Kosovichev (Reference Pipin and Kosovichev2018), we put
 $R_{\omega }=R\varOmega /\eta _{T}=10^{3}$ and
 $R_{\alpha }=1$. This choice describes the
 $\alpha ^{2}\varOmega$ dynamo regime with differential rotation as the main driver of the axisymmetric toroidal magnetic field. Note that for the given choice of the dynamo parameters the non-axisymmetric modes are stable. They do not take part in the dynamo unless some non-axisymmetric phenomena come into play. In this model the non-axisymmetric modes are a result of the magnetic buoyancy effect. The
 $R_{\beta }$ controls both the magnetic field strength in bipolar regions and magnetic flux loss. Therefore, it affects the level of the large-scale magnetic field strength in the stationary state. To estimate the magnetic buoyancy parameter we employ the results of Kitchatinov & Pipin (Reference Kitchatinov and Pipin1993), who argued that the maximum buoyancy velocity of a large-scale magnetic field of equipartition strength
 $B_{\textrm {eq}}$ is of the order of
 $6\ \textrm {m}\ \textrm {s}^{-1}$. In the solar conditions, the magnetic diffusion
 $\eta _{T}=10^{12}\ \textrm {cm}^{2}\ \textrm {s}^{-1}$ (Rüdiger, Kitchatinov & Brandenburg Reference Rüdiger, Kitchatinov and Brandenburg2011), and
 $R_{\beta }\approx 500$. With this value we get a very efficient magnetic flux loss, which results in a large-scale toroidal magnetic field strength much less than
 $B_{\textrm {eq}}$. This regime is not efficient for the bipolar region production. Hence, we use a value an order of magnitude smaller:
 $R_{\beta }=50$. For this value, we get the ‘spot's’ magnetic field strength to be around
 $B_{\textrm {eq}}$. Reduction of
 $R_{\beta }$ results in weaker bipolar regions and a stronger larger-scale toroidal magnetic field. Note that the magnetic helicity in the model is measured in units of
 $B_{\mathrm {eq}}^{2}R$. Comparing our results with observations, we have to bear in mind that in the model the magnetic field dynamo generation and the bipolar region formation occur in the same place. Therefore, the resulting configuration of the axisymmetric magnetic field is expected to be different from solar surface observations. However, the evolution of the non-axisymmetric magnetic field mimics the observational magnetic patterns reasonably well. Further details about the model can be found in Pipin & Kosovichev (Reference Pipin and Kosovichev2018). Also, the python code for the model can be found at zenodo (Pipin Reference Pipin2018).
3. Results
3.1. Helicity density patterns from bipolar regions
In this section we consider the helicity patterns which are produced by the emerging bipolar regions. In this case, we start simulations with a simple antisymmetric distribution of the toroidal magnetic field,  $\bar {B}_{\phi }=2\sin 2\theta$. The two bipolar regions are injected successively in the southern and northern hemispheres with intervals of about
 $0.004R^{2}/\eta _{T}$. The time in the model is measured in units of the diffusive time. If we scale the dynamo period of the model to 11 years, then the interval
 $0.004R^{2}/\eta _{T}$ corresponds to 2.5 months.
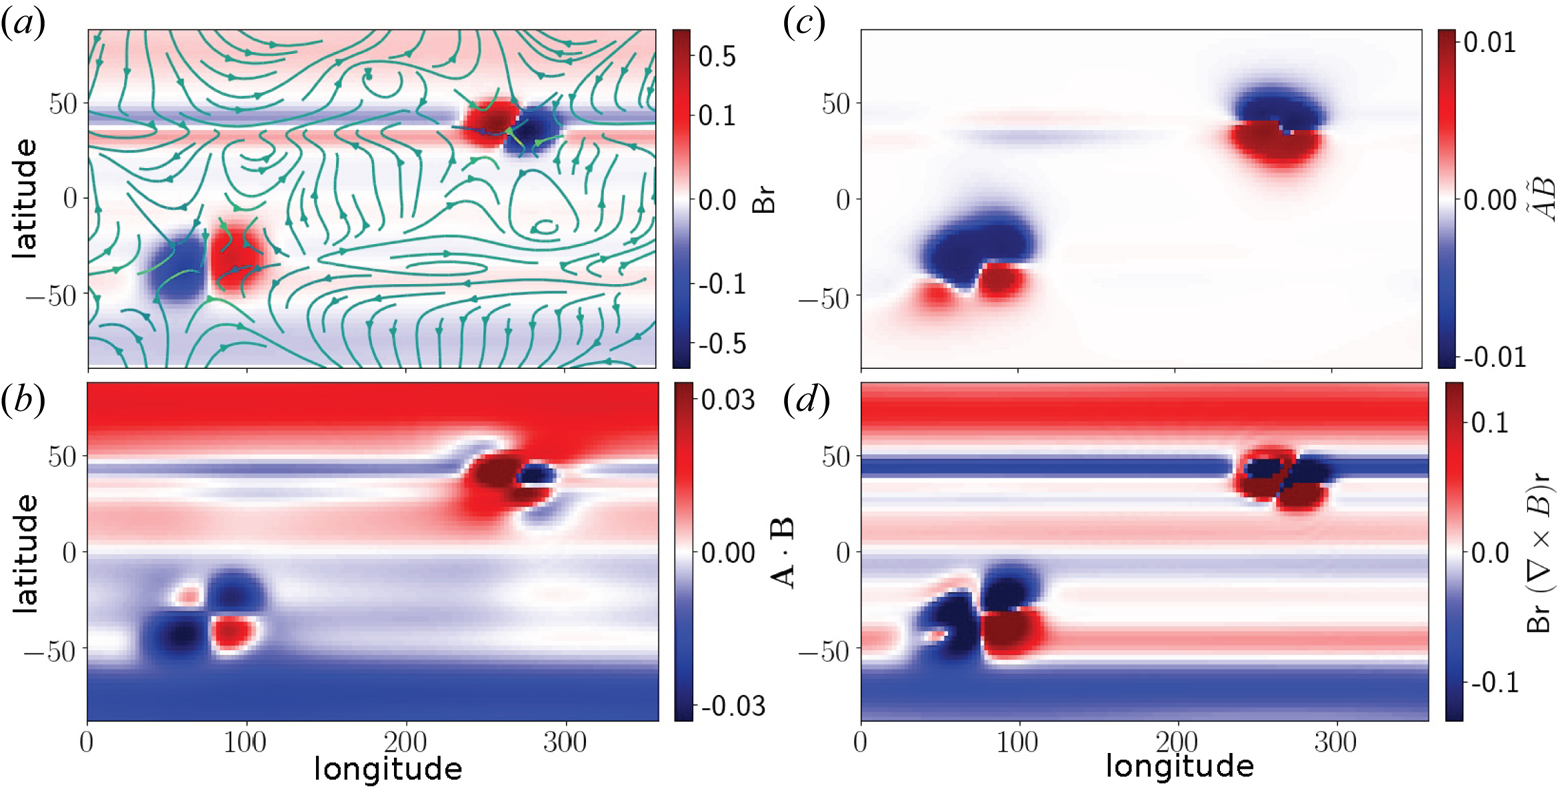
Figure 1 illustrates the magnetic field configurations, as well as the total helicity density,  $\bar {\boldsymbol {A}}\boldsymbol {\cdot }\bar {\boldsymbol {B}}+\tilde {\boldsymbol {A}} \boldsymbol {\cdot }\tilde {\boldsymbol {B}}$, the helicity density of the non-axisymmetric magnetic fields and the current helicity density distributions,
 $B_{r}(\boldsymbol {\nabla }\times \boldsymbol {B})_{r}$. The snapshots are taken shortly after formation of the second bipolar region in the northern hemisphere. We see that the helicity density patterns of the bipolar regions have quadrupole distributions. The large-scale helicity density is in the background. In agreement with the theoretical expectations, the large-scale magnetic field has positive magnetic and current helicity density sign in the northern hemisphere. This helicity was generated by the large-scale dynamo. The emerging bipolar regions show inverted quadrupole helicity patterns in the southern and the northern hemispheres. The positive and negative helicity density parts nearly cancel each other in each hemisphere. The effect of tilt is most pronounced in the distribution of the current helicity density. On the
 $B_{r}(\boldsymbol {\nabla }\times \boldsymbol {B})_{r}$ synoptic map we see the negative trace, which is produced by the emerging region. Therefore,
 $\overline {\tilde {B}_{r}(\boldsymbol {\nabla }\times \tilde {\boldsymbol {B}})_{r}}<0$ inside the latitudinal band of the bipolar region. We did not find this effect in another run where we neglected the
 $\alpha _{\beta }$ term in the mean electromotive force. Also, some part of the net helicity is due to participation of the bipolar regions in the large-scale dynamo.
(a) The colour background shows the radial magnetic field (both the axisymmetric and the non-axisymmetric modes) and streamlines show the horizontal non-axisymmetric magnetic field; (b) the total magnetic helicity density,  $(\bar {\boldsymbol {A}}+\tilde {\boldsymbol {A}})\boldsymbol {\cdot } (\bar {\boldsymbol {B}}+\tilde {\boldsymbol {B}})$; (c) the same as (b) for
 $\tilde {\boldsymbol {A}}\boldsymbol {\cdot }\tilde {\boldsymbol {B}}$; (d) the same as (b) for the current helicity density.

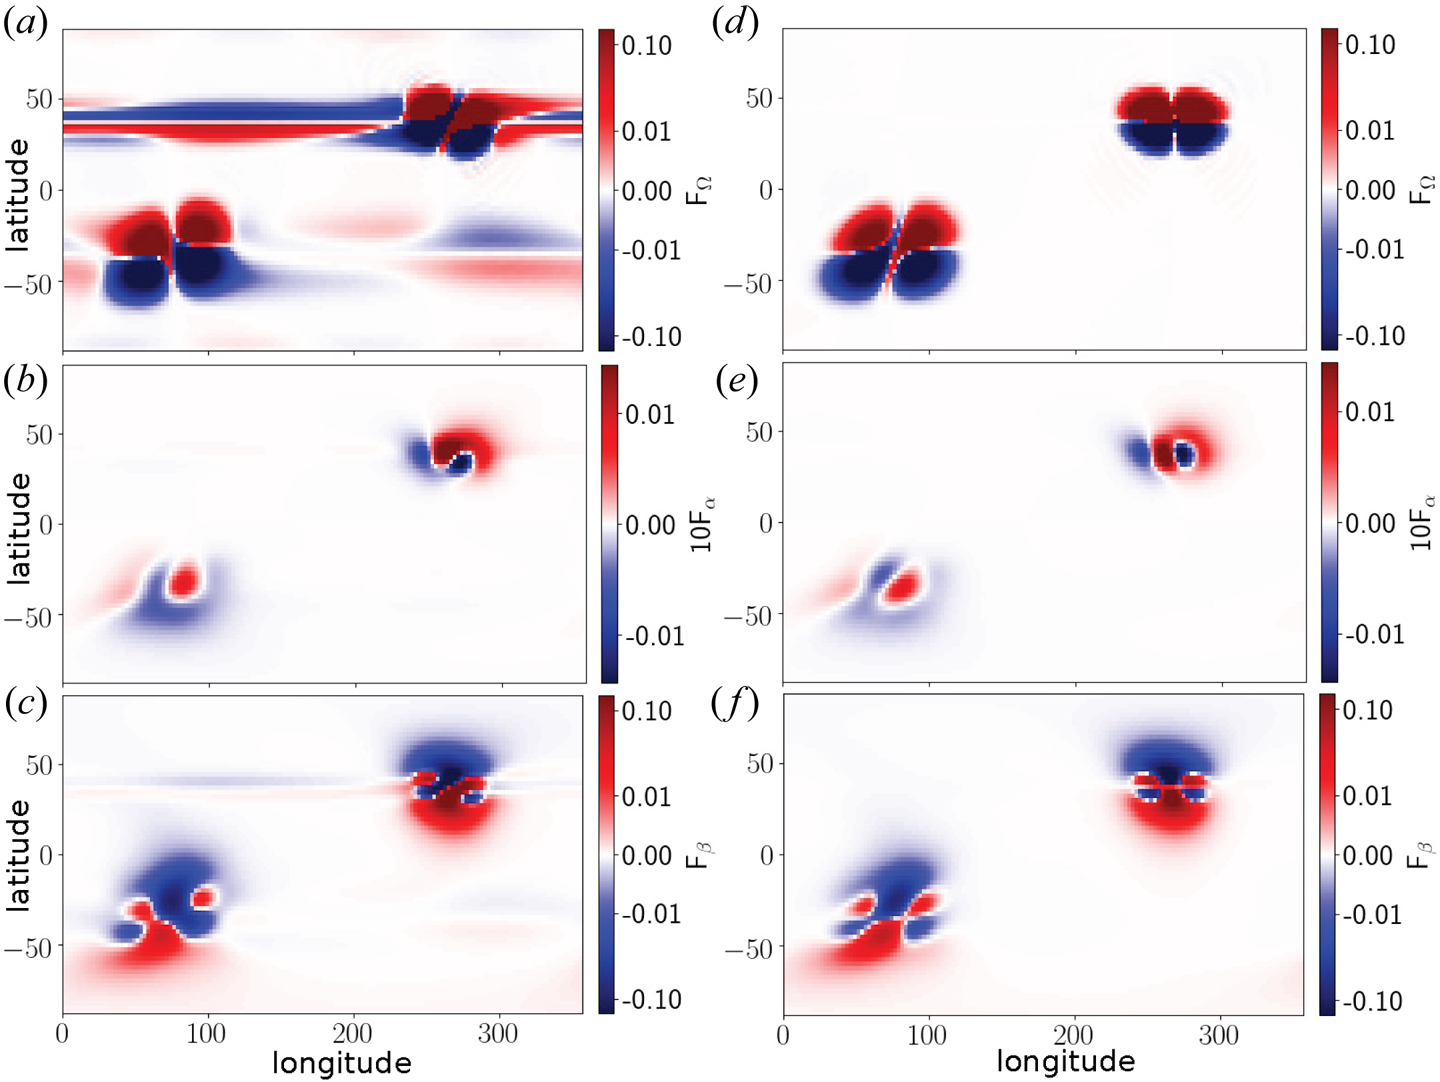
Figure 2 illustrates the patterns of the helicity density fluxes, the terms  $F_{\varOmega }$,
 $F_{\alpha }$ and
 $F_{\beta }$ in (2.15), for the models with and without the tilt effect. We find that coupling the emerging bipolar regions and the differential rotation produces the flux pattern which is inverted compared to the helicity density,
 $\tilde {\boldsymbol {A}}\boldsymbol {\cdot }\tilde {\boldsymbol {B}}$. Figures 2(a) and 2(d) agree qualitatively with the results of Hawkes & Yeates (Reference Hawkes and Yeates2019) (see figure 4c, there). It is found that the flux
 $F_{\beta }$ is substantially smaller than the flux
 $F_{\varOmega }$. Also, in all the cases the net helicity flux from each bipolar region is close to zero.
The helicity density fluxes: (a) the flux due to differential rotation,  $F_{\varOmega }$; (b) the flux due to the
 $\alpha$ effect,
 $F_{\alpha }$; (c) the flux due to the magnetic buoyancy,
 $F_{\beta }$; (d–f) the same for the model without tilt, i.e.
 $\alpha _{\beta }=0$.

3.2. Bipolar regions in the dynamo evolution
We make a run of the dynamo model with the random injections of the bipolar regions by means of the magnetic buoyancy instability. The instability is randomly initiated in the northern or southern hemispheres, and the longitude,  $\phi _{0}$, is also chosen randomly. We arbitrary chose the fluctuation interval
 $\tau _{\beta }=0.01P$. After injection of the perturbation the evolution is solely determined by the dynamo equations. Note that the condition of the buoyancy instability is defined by the critical magnetic field strength, see (2.8).
Figure 3 shows the time–latitude diagrams for the toroidal magnetic field evolution, as well as the small-scale helicity density,  $\langle \chi \rangle$, and the helicity density fluxes,
 $F_{\varOmega }$,
 $F_{\alpha }$ and
 $F_{\beta }$, for axisymmetric and non-axisymmetric magnetic fields. The model shows the regular dynamo waves of the toroidal magnetic field which drifts toward the equator in the course of the magnetic cycle. The emerging bipolar regions are shown to have no effect on the butterfly diagram because the coupling between the axisymmetric and non-axisymmetric modes is weak. However, the bipolar regions have a cumulative effect on the rate of magnetic flux loss. Therefore they affect the magnitude of the axisymmetric toroidal field. The properties of the given model were discussed in detail by Pipin & Kosovichev (Reference Pipin and Kosovichev2018). The small-scale helicity density,
 $\langle \chi \rangle$, evolves following the conservation law of helicity density. This conservation law preserves the integral balance between
 $\langle \chi \rangle$,
 $\bar {\boldsymbol {A}}\boldsymbol {\cdot }\bar {\boldsymbol {B}}$ and
 $\overline {\tilde {\boldsymbol {A}}\boldsymbol {\cdot }\tilde {\boldsymbol {B}}}$. In the quasi-stationary state the
 $\bar {\boldsymbol {A}}\boldsymbol {\cdot }\bar {\boldsymbol {B}}$ contribution is much larger than
 $\overline {\tilde {\boldsymbol {A}}\boldsymbol {\cdot }\tilde {\boldsymbol {B}}}$ (cf. figure 5d). Therefore, the
 $\langle \chi \rangle$ evolution follows the standard HHR. The time–latitude variations of
 $\overline {\tilde {\boldsymbol {A}}\boldsymbol {\cdot }\tilde {\boldsymbol {B}}}=\overline {\tilde {\chi }}$ show two bands in each hemisphere. The near equatorial bands show a positive sign in the northern hemisphere and a negative sign in the southern one. In the polar sides the situation is opposite. These patterns result naturally from the longitudinal averaging of the synoptic maps such as that shown in figure 1(c). Interestingly, in the run without tilt effect these bands show some equatorial drift, which results in noisy behaviour of
 $\overline {\tilde {\boldsymbol {A}}\boldsymbol {\cdot }\tilde {\boldsymbol {B}}}$ near the equator in that run. The time–latitude diagram of
 $\overline {\tilde {\boldsymbol {A}}\boldsymbol {\cdot }\tilde {\boldsymbol {B}}}$ sometimes shows the same sign of helicity on both hemispheres. This period corresponds to the time when the wave of the toroidal magnetic field is close to the equator. Therefore, there is interaction of the bipolar regions emerging in opposite hemispheres. The helicity fluxes due to the differential rotation are opposite for the axisymmetric and non-axisymmetric magnetic field (see figure 3b,e). Our results show that the helicity fluxes due to the mean-electromotive force effects are substantially less than those from the effect of the differential rotation. The butterfly diagram of
 $F_{\varOmega }$ agrees qualitatively with results of Hawkes & Yeates (Reference Hawkes and Yeates2019) (see figure 3c, there).
(a) The time–latitude diagrams for the toroidal magnetic field (contours) and the small-scale helicity density,  $\langle \chi \rangle$, is shown by the background image; (b) the large-scale magnetic field helicity flux due to the differential rotation; (c) the same as (b) for the flux due to the magnetic buoyancy; (d) the time–latitude evolution of the helicity density of the non-axisymmetric magnetic field; (e) the same as (b) for the helicity flux due to stretching of the non-axisymmetric magnetic field due to the differential rotation flux; ( f) the sum of the fluxes
 $F_{\alpha }$ and
 $F_{\beta }$ for the non-axisymmetric magnetic field.

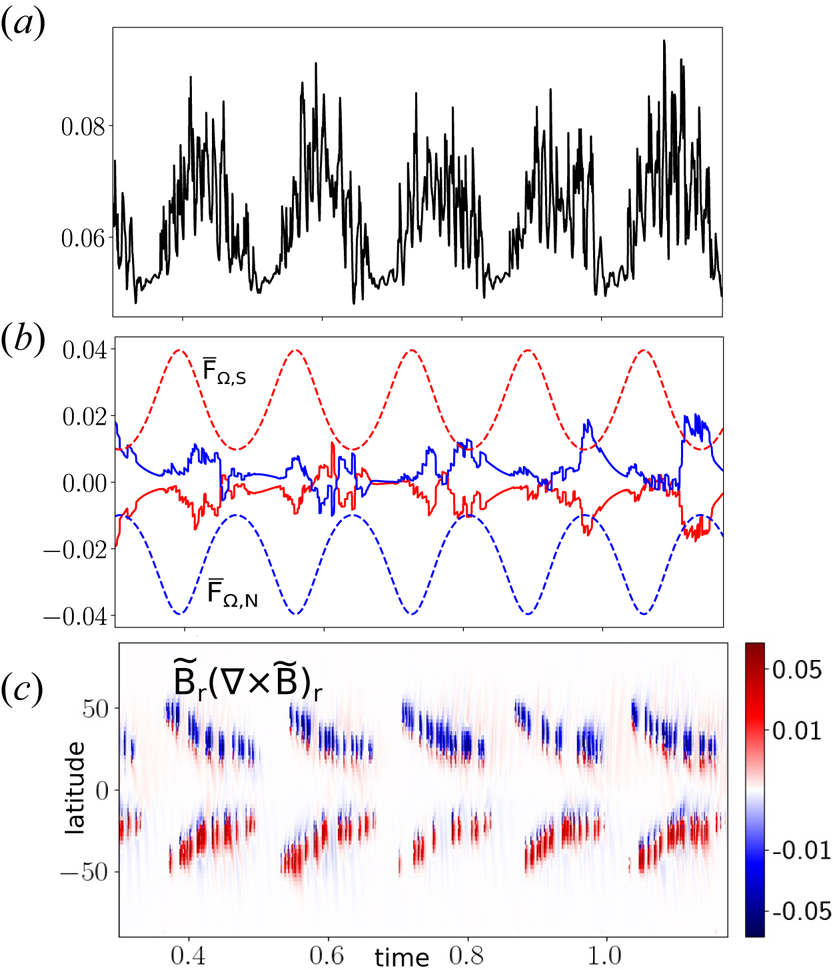
Figure 4 shows the integral parameters of the run and variations of the current helicity density of the non-axisymmetric magnetic field. The total flux of the radial magnetic field can be considered as a proxy of the sunspot activity (Stenflo Reference Stenflo2013). Beside the main magnetic cycle variation, this parameter shows short-term quasi-biennial variations (see Frick et al. Reference Frick, Sokoloff, Stepanov, Pipin and Usoskin2020). In our model, the quasi-biennial variations result from the evolution of the non-axisymmetric magnetic field, which is induced by the bipolar region formation. The dynamo evolution of the axisymmetric and non-axisymmetric magnetic field results in the opposite helicity fluxes by the differential rotation in the northern and southern hemispheres. Note the phase difference between variations of the sunspot proxy,  $\bar {F}_{\varOmega }$ and
 $\tilde {F}_{\varOmega }$. Our results agree qualitatively with the solar observations (cf. Berger & Ruzmaikin Reference Berger and Ruzmaikin2000; Zhang Reference Zhang2006). The current helicity density of the non-axisymmetric magnetic field shows the standard HRR with a dominant negative sign in the northern hemisphere and a positive sign in the southern hemisphere.
(a) The total flux of the radial magnetic field; (b) the axisymmetric (dashed lines) and non-axisymmetric (solid lines) parts of the helicity fluxes from differential rotation, for the northern and southern hemispheres; (c) the time–latitude evolution of the mean current helicity generated by the emerging active regions.

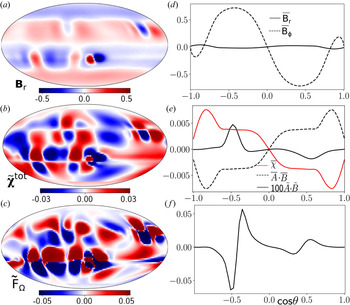
Figure 5 shows snapshots of the magnetic field and the helicity density distributions for the period of the maximum of the toroidal magnetic field cycle. The obtained magnetic field distribution is much simpler than the longitudinal structure of the solar activity proxies. This is likely because the range of the spatial scales which are involved in the dynamo model is at least a factor 10 less than in the real Sun (see figure 10 in Pipin & Kosovichev Reference Pipin and Kosovichev2018). Also, the dynamo model operates by the averaged equations, where the effect of the small-scale flows is replaced by the mean electromotive force. The helicity patterns near the bipolar regions are qualitatively similar to the case shown in figure 1(b) and that not in figure 1(c). Note that figure 5(b) shows the helicity density of the non-axisymmetric magnetic field,  $\tilde {\boldsymbol {A}}\boldsymbol {\cdot }\tilde {\boldsymbol {B}}$. The interaction of the emerging bi-poles with the background large-scale non-axisymmetric magnetic field produces a pattern similar to that in figure 1(b). At the right-hand side of the snapshot we show the mean distribution of
 $\bar {\chi }$,
 $\bar {\boldsymbol {A}}\boldsymbol {\cdot }\bar {\boldsymbol {B}}$ and
 $\overline {\tilde {\boldsymbol {A}}\boldsymbol {\cdot }\tilde {\boldsymbol {B}}}$ for this synoptic map. We find that in the model
 $\overline {\tilde {\boldsymbol {A}}\boldsymbol {\cdot }\tilde {\boldsymbol {B}}}$ has much less magnitude when compared with the other two.
(a) Snapshots of the radial magnetic field,  $\langle B\rangle _{r}$ (colour image), and the non-axisymmetric toroidal field,
 $\tilde {B}_{\phi }$ (contours are shown in the same range as
 $\langle B\rangle _{r}$); (b) the total helicity density of the non-axisymmetric field,
 $\tilde {\chi }^{(\textrm {tot})}$, (see (2.14)); (c) the snapshot of the helicity density flux due the differential rotation,
 $\tilde {F}_{\varOmega }$(non-axisymmetric part); (d–f ) the mean latitudinal profiles of the magnetic field and helicity parameters. The snapshots are taken around the maximum of the toroidal magnetic field cycle, at the diffusive time
 $\approx$1.

4. Discussion and conclusions
In the paper we study the effect of the emerging bipolar regions on the magnetic helicity density distributions and the helicity density fluxes. We employ a simplified dynamo model, which neglects the magnetic evolution in the radial direction. In the past, the model of surface dynamo waves was often used to illustrate the main principles and basic effects of a dynamo operating in the thin shear layer (Parker Reference Parker1993; Moss et al. Reference Moss, Sokoloff, Kuzanyan and Petrov2004, Reference Moss, Sokoloff, Usoskin and Tutubalin2008). We generalize the toy model from the one-dimensional axisymmetric to the two-dimensional non-axisymmetric case in such a way that it keeps the basic properties of the axisymmetric solar-type dynamo. Our formulation follows the framework of Moss et al. (Reference Moss, Sokoloff, Usoskin and Tutubalin2008) and contains results of their model in the one-dimensional limit. These restrictions result in the heuristic character of our model. Comparing our results with observations, we have to bear in mind that in the model magnetic field dynamo generation and bipolar region formation occur in the same place. The formation of the bipolar regions by means of the magnetic buoyancy instability is the main source of the non-axisymmetric magnetic field in our model. After Parker (Reference Parker1984), the magnetic buoyancy instability is usually considered as a primary process in sunspot formation. In the mean-field model, this instability results in effective nonlinear pumping of the large-scale magnetic field outwards in a radial direction. Our model employs this instability in a heuristic way. Note that the magnetic buoyancy instability is not the only mechanism which is capable of forming sunspots from the large-scale toroidal magnetic field (see, e.g., Brandenburg, Kleeorin & Rogachevskii (Reference Brandenburg, Kleeorin and Rogachevskii2013) and a review of Losada et al. Reference Losada, Warnecke, Glogowski, Roth, Brandenburg, Kleeorin and Rogachevskii2017). The model of Pipin & Kosovichev (Reference Pipin and Kosovichev2018) shows the spectral properties of the non-axisymmetric magnetic field distribution to be in agreement with observations. They found that the large-scale non-axisymmetric magnetic field results mainly from the diffusive decay of the bipolar regions.
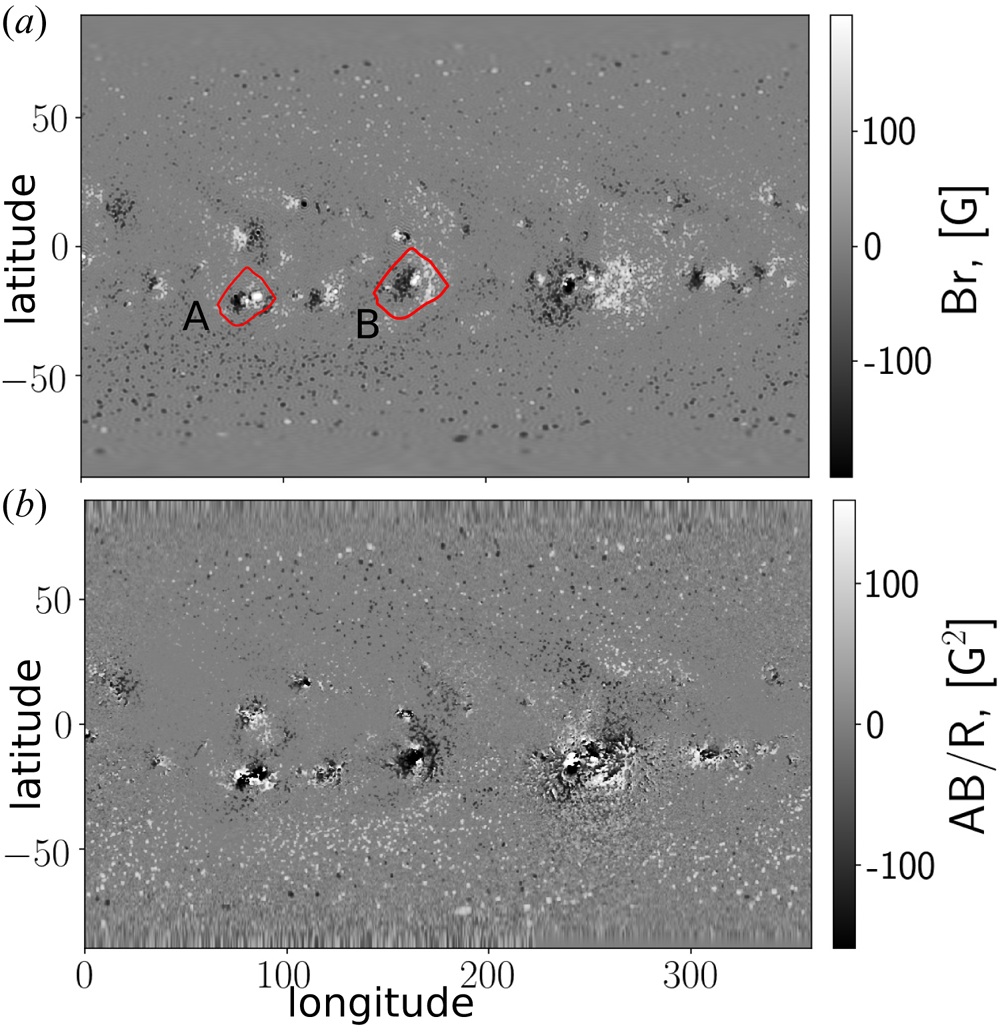
In this paper our main goal was to find a typical magnetic helicity pattern which we can observe on the surface of the Sun. We look to the case of the simple bipolar region which is formed from the large-scale toroidal magnetic field by means of magnetic buoyancy. We simulate the tilt in a heuristic way using the nonlinear  $\alpha _{\beta }$ effect which is induced by the magnetic buoyancy instability. The origin of the tilt is not specified. Such mechanisms have been discussed in a number of papers (see Leighton Reference Leighton1969; Ferriz-Mas, Schmitt & Schuessler Reference Ferriz-Mas, Schmitt and Schuessler1994; Fisher et al. Reference Fisher, Longcope, Linton, Fan and Pevtsov1999; Charbonneau Reference Charbonneau2011). We find that formation of the bipolar regions together with the large-scale magnetic field produce quadrupole magnetic helicity density patterns (figures 1b and 5c). The effect of the tilt in the bipolar region results in the tilt of the helicity pattern. Qualitatively similar results have been found recently by Yeates (Reference Yeates2020) using a completely different approach. Pipin et al. (Reference Pipin, Pevtsov, Liu and Kosovichev2019) studied the helicity density distributions of the solar magnetic field using observations of the Helioseismic and Magnetic Imager (HMI, Scherrer et al. Reference Scherrer, Schou, Bush, Kosovichev, Bogart, Hoeksema, Liu, Duvall, Zhao and Title2012) on board the Solar Dynamics Observatory (SDO, Pesnell, Thompson & Chamberlin Reference Pesnell, Thompson and Chamberlin2012). Figure 6 shows examples of the magnetic field and the magnetic helicity density synoptic maps for the Carrington rotation 2157. The two relatively small active regions in the southern hemisphere, A and B, show the quadrupole helicity density distributions to be in qualitative agreement with the results of our study. The best agreement is for the region A. This is likely to be because it has a relatively simple distribution of the radial magnetic field flux.
Synoptic maps of the radial magnetic field (a) and the magnetic helicity density (b) for the Carrington rotation 2157 (following the results of Pipin et al. Reference Pipin, Pevtsov, Liu and Kosovichev2019).

In our model the dynamo process and the bipolar region formation occur in the same place. The emerging bipolar regions result in a loss of the magnetic field flux and quenching of the large-scale dynamo. We find no profound effect of these bi-poles on the helical properties of the dynamo. This is likely due to the specifics of our model. Despite this, the nonlinear  $\alpha _{\beta }$ effect produces some amount of large-scale poloidal magnetic field flux (see, e.g., figure 1a), and it does not affect the background axisymmetric dynamo process to a great extent. This is contrary to assumptions of the Babcock–Leighton dynamo scenario (Cameron & Schüssler Reference Cameron and Schüssler2017b). To satisfy this scenario we need a meridional circulation in the model. This probably requires a three-dimensional model. Besides, it is likely that a large-scale dynamo, which utilizes such an
 $\alpha _{\beta }$ effect acting on the non-axisymmetric magnetic field, operates in highly supercritical regimes (Ferriz-Mas et al. Reference Ferriz-Mas, Schmitt and Schuessler1994). This is contrary to our original intention to have the solar-type dynamo model as a limit in the one-dimensional case. Therefore, we cannot expect the the generated
 $\overline {\tilde {\boldsymbol {A}}\boldsymbol {\cdot }\tilde {\boldsymbol {B}}}$ to have a considerable effect on the small-scale helicity density evolution. The modelled
 $\langle \chi \rangle$ distributions are determined by the axisymmetric type of the dynamo model. In compare with the sign of the current helicity density of the solar active regions (see, Zhang et al. Reference Zhang, Sakurai, Pevtsov, Gao, Xu, Sokoloff and Kuzanyan2010; Zhang, Brandenburg & Sokoloff Reference Zhang, Brandenburg and Sokoloff2016), the term
 $\overline {\tilde {\boldsymbol {A}}\boldsymbol {\cdot }\tilde {\boldsymbol {B}}}$ shows the inverted HHR near the equator. The positive sign of the magnetic helicity density from the tilted bipolar regions was anticipated in earlier studies (Pevtsov et al. Reference Pevtsov, Berger, Nindos, Norton and van Driel-Gesztelyi2014). Theoretically, it is expected that the tilt results in the internal twist opposing the writhe by the magnetic tensions (Blackman & Brandenburg Reference Blackman and Brandenburg2003). In our model this process is taken into account by the conservation law. Following this law, the small-scale helicity density
 $\bar {\chi }$ evolves in balance with the
 $\overline {\tilde {\boldsymbol {A}}\boldsymbol {\cdot }\tilde {\boldsymbol {B}}}$ helicity density of the axisymmetric field,
 $\bar {\boldsymbol {A}}\boldsymbol {\cdot }\bar {\boldsymbol {B}}$. Our heuristic type of model does not allow a detailed quantitative comparison with observations. This can be improved in three-dimensional models, which allow all the dynamo effects to be taken into account in a physically consistent way. We may anticipate that, for a shallow process of sunspot formation, three-dimensional models can give results which agree qualitatively with ours.
Summing up, it is found that the emerging bipolar regions produce quadrupole helicity density patterns. Similar patterns were found for the helicity flux by means of the differential rotation. We found that the tilted bipolar regions show an inverted HRR near the equator in comparison with observations of the magnetic helicity in the solar active regions. In general, our results suggest that on intermediate scales such as the scale of the bipolar active regions the averaged magnetic helicity distribution can show no definite sign distribution in the northern and southern hemispheres of the Sun.
Acknowledgements
The author acknowledges financial support from a Russian Foundation for Basic Research grant 19-52-53045 and support of the scientific project FR II.16 of ISTP SB RAS. This work utilizes HMI data which are used here courtesy of NASA/SDO and the HMI science teams. Some part of this work was presented and discussed during the ‘Solar Helicities in Theory and Observations: Implications for Space Weather and Dynamo Theory’ Program at Nordic Institute for Theoretical Physics (NORDITA) on 4–29 March 2019. I thank the anonymous referee for helpful comments and constructive remarks on this manuscript.
Editor Mitchell Berger thanks the referees for their advice in evaluating this article.
Declaration of interests
The authors report no conflict of interest.
Appendix A
A.1. The large-scale magnetic field and its vector potential
We decompose the total magnetic field induction vector into the sum of the axisymmetric and non-axisymmetric parts:  $\langle \boldsymbol {B}\rangle =\bar {\boldsymbol {B}}+\tilde {\boldsymbol {B}}$. In spherical coordinates, the axisymmetric part,
 $\bar {\boldsymbol {B}}$, is represented as follows:
 \begin{align} \boldsymbol{\bar{B}} & = \hat{\boldsymbol{\phi}}B+\boldsymbol{\nabla}\times\left(A\hat{\boldsymbol{\phi}}\right)\nonumber\\ & = \hat{\boldsymbol{\phi}}B-\frac{\hat{r}}{r}\frac{\partial A\sin\theta}{\partial\mu}- \frac{\hat{\theta}}{r}\frac{\partial rA}{\partial r}, \end{align}
where  $\hat {r}$ is the unit vector in the radial direction,
 $\hat {\theta }$ is the unit vector in the meridional direction,
 $\hat {\phi }$ is the unit vector in the azimuthal direction and
 $\mu =\cos \theta$. In this paper we assume that the scalars
 $A$ and
 $B$ are independent of radius. Therefore, for the axisymmetric magnetic field at
 $r=R$ we get
 \begin{equation} \boldsymbol{\bar{B}} = \hat{\boldsymbol{\phi}}B-\frac{\hat{r}}{R}\frac{\partial A\sin\theta}{\partial\mu}-\frac{\hat{\theta}A}{R}. \end{equation}
The above definitions preserve the divergence-free vector field,  $\boldsymbol {\nabla }\boldsymbol {\cdot }\boldsymbol {\bar {B}}=0$. For the axisymmetric part of the vector potential we have
 \begin{equation} \bar{\boldsymbol{A}}=\hat{r}A_{r}+\hat{\boldsymbol{\phi}}A,\end{equation}
where  $B=\partial A_{r}/\partial \mu$ (see Pipin & Pevtsov Reference Pipin and Pevtsov2014). The unique axisymmetric potential is found for the gauge
 $\int _{-1}^{1}A_{r}\,\textrm {d}\mu =0$ (cf. the derivations below). For the non-axisymmetric part of the magnetic field, we use the same idea. Following Krause & Rädler (Reference Krause and Rädler1980), we write
 \begin{align} \boldsymbol{\tilde{B}} & = \boldsymbol{\nabla}\times\left(\hat{r}T\right)+\boldsymbol{\nabla} \times\boldsymbol{\nabla}\times\left(\hat{r}S\right)\nonumber\\ & ={-}\frac{\hat{r}}{r}\varDelta_{\varOmega}S+\hat{\theta}\left(\frac{1}{\sin\theta}\frac{\partial T}{\partial\phi}-\frac{\sin\theta}{r}\frac{\partial}{\partial\mu}\frac{\partial rS}{\partial r}\right)+\hat{\phi}\left(\sin\theta\frac{\partial T}{\partial\mu}+\frac{1}{r\sin\theta}\frac{\partial}{\partial\phi}\frac{\partial rS}{\partial r}\right), \end{align}
where  ${\varDelta _{\varOmega }=({\partial }/{\partial \mu }) \sin ^{2}\theta ({\partial }/{\partial \mu })+ ({1}/{\sin ^{2}\theta })({\partial ^{2}}/{\partial \phi ^{2}})}$. Besides, we apply the following gauge (see, e.g., Krause & Rädler Reference Krause and Rädler1980):
 \begin{equation} \int_{0}^{2{\rm \pi}}\int_{{-}1}^{1}S\,\textrm{d}\mu \,\textrm{d}\phi=\int_{0}^{2{\rm \pi}}\int_{{-}1}^{1}T\,\textrm{d}\mu \,\textrm{d}\phi=0.\end{equation}
Assuming that the potential's scalar functions  $S$ and
 $T$ are independent of the radius, we get
 \begin{equation} \boldsymbol{\tilde{B}}={-}\frac{\hat{r}}{R}\varDelta_{\varOmega}S+\hat{\theta}\left(\frac{1}{\sin\theta}\frac{\partial T}{\partial\phi}-\frac{\sin\theta}{R}\frac{\partial S}{\partial\mu}\right)+\hat{\phi}\left(\sin\theta\frac{\partial T}{\partial\mu}+\frac{1}{R\sin\theta}\frac{\partial S}{\partial\phi}\right), \end{equation}
and  $\boldsymbol {\nabla }\boldsymbol {\cdot }\boldsymbol {\tilde {B}}=0$. With the above assumptions, the non-axisymmetric part of the vector potential reads
 \begin{align} \tilde{\boldsymbol{A}} & = \hat{r}T+\boldsymbol{\nabla}\times\left(\hat{r}S\right)\nonumber\\ & = \hat{r}T+\frac{\hat{\theta}}{R\sin\theta}\frac{\partial S}{\partial\phi}+\hat{\phi}\frac{\sin\theta}{R}\frac{\partial S}{\partial\mu}. \end{align}
Analysis of the solar observations (e.g. Pipin et al. Reference Pipin, Pevtsov, Liu and Kosovichev2019) shows that the  ${\partial rS}/{\partial r}$ term is related to the non-potential component of the non-axisymmetric magnetic field of the solar active regions. Therefore, the radial derivative of
 $S$ can provide the essential contribution to topology and energy of the surface magnetic field. In principle, we can neglect the uniform part of
 $S$ for the sake of its derivative. However, in this case we would lose the radial component of the non-axisymmetric magnetic field. The solar observations show that the radial magnetic field in solar active regions is dominant (Scherrer et al. Reference Scherrer, Schou, Bush, Kosovichev, Bogart, Hoeksema, Liu, Duvall, Zhao and Title2012). The model reflects this basic property but it fails to unveil the radial structure of the non-axisymmetric magnetic field.
A.2. Dynamo equations
With our representation of the mean electromotive force in the form of (2.7), the full version of the dynamo equations for the axisymmetric magnetic field reads as follows:
 \begin{align} \partial_{t}A &= \overline{\alpha\langle B_{\phi}\rangle }+\overline{\alpha_{\beta}\langle B_{\phi}\rangle}+\eta_{T}\varDelta'A+\frac{V_{\beta}}{r} \frac{\partial(rA)}{\partial r}+\overline{V_{\beta}\tilde{B}_{\theta}},\end{align}
 \begin{align} \partial_{t}B & = \frac{\sin\theta}{r}\frac{\partial\left(r\sin\theta A,\varOmega\right)}{\partial\left(r,\mu\right)}+\eta_{T}\varDelta'B-\frac{1}{r}\frac{\partial}{\partial r}r^{2}(V_{\beta}B+\overline{V_{\beta}\tilde{B}_{\phi}})\nonumber\\ &\quad + \frac{1}{r}\frac{\partial}{\partial r}r\overline{\alpha\langle B_{\theta}\rangle }+\frac{\sin\theta}{r}\frac{\partial}{\partial\mu}\overline{\alpha\langle B_{r}\rangle } \end{align}
where  $\varDelta '=\varDelta -{{1}/{r^{2}\sin ^{2}\theta }}$. For the sake of brevity, all the
 $\alpha$-effect and magnetic buoyancy terms are written explicitly via the magnetic field components. Besides, these contributions contain the effects of the nonlinear coupling between the axisymmetric and non-axisymmetric modes of the magnetic field. For example, we have
 $\overline {\alpha \langle B\rangle _{\phi }}=\bar {\alpha }B+\overline {\tilde {\alpha }\tilde {B}_{\phi }}$ and the same for other similar terms. Note that the second part in this formula, the term
 $\overline {\tilde {\alpha }\tilde {B}_{\phi }}$ , as well terms such as
 $\overline {\alpha _{\beta }\langle B\rangle _{\phi }}$ and those that are similar, which are related to the magnetic buoyancy, are usually ignored in standard mean-field dynamo models. In general, we can see some similarity of the effect due to
 $\overline {\tilde {\alpha }\tilde {B}_{\phi }}$ and the non-local
 $\alpha$ effect employed in the flux-transport models (Cameron & Schüssler Reference Cameron and Schüssler2017a). In our approach, we explicitly take into account the dynamics of the non-axisymmetric magnetic field and their averaged effect on the evolution of the large-scale magnetic field.
Applying our simplifications to (A8) and (A9) we arrive at the ‘no- $r$’ equations for evolution of the axisymmetric magnetic field:
 \begin{align} \partial_{t}A &= \alpha\mu\left\langle B_{\phi}\right\rangle +\eta_{T}\frac{\sin^{2}\theta}{R^{2}}\frac{\partial^{2}\left(\sin\theta A\right)}{\partial\mu^{2}}-\frac{V_{\beta}}{R}A-\frac{A}{\tau},\end{align}
 \begin{align} \partial_{t}B & ={-} \sin\theta\frac{\partial\varOmega}{\partial r}\frac{\partial\left(\sin\theta A\right)}{\partial\mu}+\eta_{T}\frac{\sin^{2}\theta}{R^{2}}\frac{\partial^{2}\left(\sin\theta B\right)}{\partial\mu^{2}}\nonumber\\ &\quad +\frac{\sin\theta}{R}\frac{\partial}{\partial\mu}\overline{\alpha\left\langle B_{r}\right\rangle }+\frac{\overline{\alpha\left\langle B_{\theta}\right\rangle }}{R}-\frac{1}{R}V_{\beta}\left\langle B_{\phi}\right\rangle -\frac{B}{\tau}. \end{align}
On the one hand, in the shortened version of the dynamo equations we keep the dominant dynamo effect caused by the radial gradient of the angular velocity. The  $\tau$ terms in (A11) and (A10) were suggested by Moss et al. (Reference Moss, Sokoloff, Usoskin and Tutubalin2008) to account for turbulent diffusion in the radial direction. Similarly to this paper, we put
 $\tau =3({R^{2}}/{\eta _{T}})$. The magnetic buoyancy effect results in physically similar terms (see Noyes et al. Reference Noyes, Weiss and Vaughan1984). On the other hand, we assume that the magnetic field and the
 $\alpha$ effect are uniform in the radial direction. This is an inconsistency of the ‘no-
 $r$’ approach.
To get the evolution equation for the non-axisymmetric potential  $S$ we substitute (A4) into (2.1), and then calculate the scalar product with vector
 $\boldsymbol {\hat {r}}$. Similarly, the equation for
 $T$ is obtained by taking the curl of (2.1) and then the scalar product with the vector
 $\boldsymbol {\hat {r}}$. The procedure is described in detail by Krause & Rädler (Reference Krause and Rädler1980); also, see Bigazzi & Ruzmaikin (Reference Bigazzi and Ruzmaikin2004) and Pipin & Kosovichev (Reference Pipin and Kosovichev2015). The equations for the potentials
 $T$ and
 $S$ are
 \begin{gather} \partial_{t}\varDelta_{\varOmega}S = \varDelta_{\varOmega}U^{(U)}+\varDelta_{\varOmega}U^{(\mathcal{E})}, \end{gather}
 \begin{gather}\partial_{t}\varDelta_{\varOmega}T = \varDelta_{\varOmega}V^{(U)}+\varDelta_{\varOmega}V^{(\mathcal{E})}, \end{gather}
where we introduce the new notation
 \begin{gather} \varDelta_{\varOmega}V^{(U)} ={-}\hat{\boldsymbol{r}}\boldsymbol{\cdot}\boldsymbol{\nabla}\times\boldsymbol{\nabla}\times\left(\boldsymbol{\bar{U}}\times{\tilde{\boldsymbol{B}}}\right), \end{gather}
 \begin{gather}\varDelta_{\varOmega}V^{(\mathcal{E})} ={-}\hat{\boldsymbol{r}}\boldsymbol{\cdot}\boldsymbol{\nabla}\times\boldsymbol{\nabla}\times{\boldsymbol{\mathcal{E}}}, \end{gather}
 \begin{gather}\varDelta_{\varOmega}U^{(U)} ={-}\hat{\boldsymbol{r}}\boldsymbol{\cdot}\boldsymbol{\nabla} \times\left(\boldsymbol{\bar{U}}\times\tilde{\boldsymbol{B}}\right), \end{gather}
 \begin{gather}\varDelta_{\varOmega}U^{(\mathcal{E})} ={-}\hat{\boldsymbol{r}}\boldsymbol{\cdot} \boldsymbol{\nabla}\times{\boldsymbol{\mathcal{E}}}. \end{gather}
The effect of the differential rotation on the non-axisymmetric magnetic field reads as follows:
 \begin{align} \varDelta_{\varOmega}V^{(U)} & ={-}\varDelta_{\varOmega}\varOmega\frac{\partial T}{\partial\phi}+\varDelta_{\varOmega}\left\{ \left(\boldsymbol{\varOmega}\cdot\boldsymbol{\nabla}\right)F_{S}-\left(\boldsymbol{\hat{r}}\boldsymbol{\cdot}\boldsymbol{\varOmega}\right)\Delta S\right\} \nonumber\\ & \quad -\boldsymbol{\nabla}\boldsymbol{\cdot}\left\{ \frac{\boldsymbol{\varOmega}}{\varOmega}\left(\boldsymbol{\hat{r}\boldsymbol{\cdot} \boldsymbol{\nabla}}\right)-\left(\boldsymbol{\hat{r}}\boldsymbol{\cdot}\frac{\boldsymbol{\varOmega}}{\varOmega} \right)\boldsymbol{\nabla}\right\} \left(\varOmega\varDelta_{\varOmega}S\right), \end{align}
 \begin{align} \varDelta_{\varOmega}U^{(U)} &={-}\frac{\partial}{\partial\phi}\left(\varOmega\varDelta_{\varOmega}S\right). \end{align}
For the turbulent magnetic diffusivity, magnetic buoyancy and  $\alpha$ effect we get
 \begin{align} \varDelta_{\varOmega}V^{(\mathcal{E})} & ={-}\varDelta_{\varOmega}\left(\frac{1}{r}\frac{\partial}{\partial r}\left(\eta_{T}\frac{\partial}{\partial r}rT\right)+\frac{\eta_{T}}{r^{2}}\varDelta_{\varOmega}T\right)\nonumber\\ &\quad - \frac{1}{r\sin\theta}\frac{\partial}{\partial\phi}\frac{\partial}{\partial r}\left(r\left\langle B_{\theta}\right\rangle V_{\beta}\right)-\frac{\partial}{\partial\mu}\left(\frac{\sin\theta}{r}\frac{\partial}{\partial r}\left(r\left\langle B_{\phi}\right\rangle V_{\beta}\right)\right) \nonumber\\ & \quad + \frac{1}{r}\varDelta_{\varOmega}\alpha\left\langle B_{r}\right\rangle +\frac{1}{r} \frac{\partial}{\partial r}r\frac{\partial}{\partial\mu}\alpha\left\langle B_{\theta}\right\rangle - \frac{1}{r}\frac{\partial}{\partial r}r\left[\frac{1}{\sin\theta}\frac{\partial}{\partial\phi}\left(\alpha+\alpha_{\beta}\right)\left\langle B_{\phi}\right\rangle \right], \end{align}
 \begin{align} \varDelta_{\varOmega}U^{(\mathcal{E})} & = \eta_{T}\varDelta_{\varOmega}\varDelta S-\frac{1}{\sin\theta}\frac{\partial}{\partial\phi}\left(\left\langle B_{\phi}\right\rangle V_{\beta}\right)+\frac{\partial}{\partial\mu}\left(\sin\theta\left\langle B_{\theta}\right\rangle V_{\beta}\right)\nonumber\\ & \quad + \frac{\partial}{\partial\mu}\left(\alpha+\alpha_{\beta}\right)\left\langle B_{\phi}\right\rangle +\frac{1}{\sin\theta}\frac{\partial}{\partial\phi}\alpha\left\langle B_{\theta}\right\rangle . \end{align}
Applying our ‘no- $r$’ approach to (A12) and (A13) we get
 \begin{align} \partial_{t}\varDelta_{\varOmega}T & ={-}\varDelta_{\varOmega}\varOmega\frac{\partial T}{\partial\phi}+\frac{\eta_{T}}{R^{2}}\varDelta_{\varOmega}^{2}T-\frac{\varDelta_{\varOmega}T}{\tau}\nonumber\\ &\quad - \frac{1}{R}\frac{\partial\varOmega}{\partial r}\sin^{2}\theta\frac{\partial\varDelta_{\varOmega}S}{\partial\mu}-\frac{1}{R}\frac{\partial}{\partial\phi}\left[\frac{\alpha+\alpha_{\beta}}{\sin\theta}\left\langle B_{\phi}\right\rangle \right] \nonumber\\ &\quad + \varDelta_{\varOmega}\frac{\alpha\left\langle B_{r}\right\rangle }{R}+\frac{1}{R}\frac{\partial}{\partial\mu}\alpha\left\langle B_{\theta}\right\rangle \nonumber\\ &\quad - \frac{1}{R\sin\theta}\frac{\partial}{\partial\phi}\left\langle B_{\theta}\right\rangle V_{\beta}-\frac{1}{R}\frac{\partial}{\partial\mu}\left(\sin\theta\left\langle B_{\phi}\right\rangle V_{\beta}\right), \end{align}
 \begin{align} \partial_{t}\varDelta_{\varOmega}S & ={-}\left(\varOmega\varDelta_{\varOmega}\frac{\partial}{\partial\phi}S\right)+\frac{\eta_{T}}{R^{2}}\varDelta_{\varOmega}^{2}S-\frac{\varDelta_{\varOmega}S}{\tau} \nonumber\\ &\quad +\frac{\partial}{\partial\mu}\left(\alpha+\alpha_{\beta}\right)\left\langle B_{\phi}\right\rangle +\frac{\partial}{\partial\phi}\frac{\alpha\left\langle B_{\theta}\right\rangle }{\sin\theta} \nonumber\\ &\quad - \frac{1}{\sin\theta}\frac{\partial}{\partial\phi}\left(\left\langle B_{\phi}\right\rangle V_{\beta}\right)+\frac{\partial}{\partial\mu}\left(\sin\theta\left\langle B_{\theta}\right\rangle V_{\beta}\right). \end{align}
Here, as before, we write all the  $\alpha$ effect and magnetic buoyancy terms explicitly via the magnetic field components. The numerical solution of the dynamo problem treats these terms in the same way. Our above comments about the shortened version of the axisymmetric dynamo should be applied to (A22) and (A23) as well. In addition, to simulate stretching of the non-axisymmetric magnetic field by the surface differential rotation we take into account the latitudinal dependence of the angular velocity
 $\varOmega =1-0.25\sin ^{2}\theta \varOmega$.
A.3. Helicity evolution equation
We start from the mean-field evolution equations for the large-scale magnetic field:
 \begin{equation} \partial_{t}\left\langle \boldsymbol{B}\right\rangle = \boldsymbol{\nabla}\times\left({{\boldsymbol{\mathcal{E}}}+}\left\langle \boldsymbol{U}\right\rangle \times\left\langle \boldsymbol{B}\right\rangle - \eta\boldsymbol{\nabla}\times\left\langle \boldsymbol{B}\right\rangle \right). \end{equation}
For the time derivative of the magnetic helicity of the large-scale field in a volume we get
 \begin{align} \frac{\textrm{d}}{\textrm{d}t}\int\left\langle \boldsymbol{A}\right\rangle \boldsymbol{\cdot}\left\langle \boldsymbol{B}\right\rangle \mathrm{d}V & = \int\left(\left\langle \boldsymbol{A}\right\rangle \cdot\partial_{t}\left\langle \boldsymbol{B}\right\rangle +\left\langle \boldsymbol{B}\right\rangle \boldsymbol{\cdot}\partial_{t}\left\langle \boldsymbol{A}\right\rangle +\boldsymbol{\nabla}\boldsymbol{\cdot}\left\langle \boldsymbol{U}\right\rangle \left(\left\langle \boldsymbol{A}\right\rangle \boldsymbol{\cdot}\left\langle \boldsymbol{B}\right\rangle \right)\right)\mathrm{dV}\nonumber\\ & = \int\left\{ 2\left\langle \boldsymbol{A}\right\rangle \boldsymbol{\cdot}\partial_{t}\left\langle \boldsymbol{B}\right\rangle +\boldsymbol{\nabla}\boldsymbol{\cdot}\left\langle \boldsymbol{U}\right\rangle \left(\left\langle \boldsymbol{A}\right\rangle \boldsymbol{\cdot}\left\langle \boldsymbol{B}\right\rangle \right)\right\} \textrm{d}V\nonumber\\ &\quad +\oint\left(\left\langle \boldsymbol{A}\right\rangle \times\partial_{t}\left\langle \boldsymbol{A}\right\rangle \right)\boldsymbol{\cdot}\boldsymbol{n}\,\mathrm{d}S. \end{align}
Using the mean-field evolution equation we obtain
 \begin{align} \frac{\textrm{d}}{\textrm{d}t}\int\left\langle \boldsymbol{A}\right\rangle \boldsymbol{\cdot}\left\langle \boldsymbol{B}\right\rangle \mathrm{d}V & = 2\int\left({\boldsymbol{\mathcal{E}}}\boldsymbol{\cdot}\left\langle \boldsymbol{B}\right\rangle -\eta\left\langle \boldsymbol{J}\right\rangle \boldsymbol{\cdot}\left\langle \boldsymbol{B}\right\rangle \right)\mathrm{d}V\nonumber\\ & \quad + 2\int\boldsymbol{\nabla}\boldsymbol{\cdot}\left({\boldsymbol{\mathcal{E}}}\times\left\langle \boldsymbol{A}\right\rangle +\left\langle \boldsymbol{B}\right\rangle \left(\left\langle \boldsymbol{A}\right\rangle \boldsymbol{\cdot}\left\langle \boldsymbol{U}\right\rangle \right)-\eta\left\langle \boldsymbol{J}\right\rangle \times\left\langle \boldsymbol{A}\right\rangle \right)\mathrm{d}V \nonumber\\ & \quad - \oint\left(\left\langle \boldsymbol{A}\right\rangle \boldsymbol{\cdot}\left\langle \boldsymbol{B}\right\rangle \right)\left(\left\langle \boldsymbol{U}\right\rangle \boldsymbol{\cdot}\boldsymbol{n}\right)\mathrm{d}S+\oint\left(\left\langle \boldsymbol{A}\right\rangle \times\partial_{t}\left\langle \boldsymbol{A}\right\rangle \right)\boldsymbol{\cdot}\boldsymbol{n}\,\mathrm{d}S, \end{align}
where we denote  $\langle \boldsymbol {J}\rangle =\boldsymbol {\nabla }\times \langle \boldsymbol {B}\rangle$. Interestingly, the diffusive part of the flux
 ${\boldsymbol {\mathcal {E}}}\times \langle \boldsymbol {A}\rangle =-\eta _{T}\langle \boldsymbol {J}\rangle \times \langle \boldsymbol {A}\rangle$ contains the flux of large-scale magnetic helicity, which can be represented though the gradient of the large-scale helicity. Indeed,
 \begin{align} \left\langle \boldsymbol{A}\right\rangle \times\boldsymbol{\nabla}\times\left\langle \boldsymbol{B}\right\rangle & = \left(\left\langle \boldsymbol{A}\right\rangle _{i}\boldsymbol{\nabla}\left\langle \boldsymbol{B}\right\rangle _{i} \right)-\left(\left\langle \boldsymbol{A}\right\rangle \boldsymbol{\cdot}\boldsymbol{\nabla}\right) \left\langle \boldsymbol{B}\right\rangle ,\nonumber\\ & = \boldsymbol{\nabla}\left(\left\langle \boldsymbol{A}\right\rangle \boldsymbol{\cdot}\left\langle \boldsymbol{B}\right\rangle \right)-\left(\left\langle \boldsymbol{B}\right\rangle _{i}\boldsymbol{\nabla}\left\langle \boldsymbol{A}\right\rangle _{i}\right)-\left(\left\langle \boldsymbol{A}\right\rangle \boldsymbol{\cdot}\boldsymbol{\nabla}\right)\left\langle \boldsymbol{B}\right\rangle , \end{align}
and therefore we have
 \begin{align} \boldsymbol{\nabla}\boldsymbol{\cdot}\left({{-\boldsymbol{\eta}_{\boldsymbol{T}}\left\langle \boldsymbol{J}\right\rangle \times\left\langle \boldsymbol{A}\right\rangle }}\right)=\boldsymbol{\nabla}\boldsymbol{\cdot}\left(\eta_{T}\boldsymbol{\nabla}\left(\left\langle \boldsymbol{A}\right\rangle \boldsymbol{\cdot}\left\langle \boldsymbol{B}\right\rangle \right)-\eta_{T}\left(\left\langle \boldsymbol{B}\right\rangle _{i}\boldsymbol{\nabla}\left\langle \boldsymbol{A}\right\rangle _{i}+\left(\left\langle \boldsymbol{A}\right\rangle \boldsymbol{\cdot}\boldsymbol{\nabla}\right)\left\langle \boldsymbol{B}\right\rangle \right)\right).\end{align}
The last equation shows that the contribution of the gradient flux of the large-scale helicity is a part of a more general expression. In our paper we are not concerned with the meaning of this flux for the dynamo model. The helicity flux from  $-\eta _{T}\langle \boldsymbol {J}\rangle \times \langle \boldsymbol {A}\rangle$ was analysed recently by Hawkes & Yeates (Reference Hawkes and Yeates2019) using the surface flux-transport model. In our model there is some arbitrariness about the contribution of the gradient flux of the large-scale helicity density in the evolution of the total magnetic helicity. We employ the heuristic integral conservation law for the evolution of the total helicity,
 $\langle \chi \rangle ^{(\textrm {tot})}=\langle \chi \rangle +\langle \boldsymbol {A}\rangle \boldsymbol {\cdot }\langle \boldsymbol {B}\rangle$, originally suggested by Hubbard & Brandenburg (Reference Hubbard and Brandenburg2012),
 \begin{align} \frac{\textrm{d}}{\textrm{d}t}\int\left(\left\langle \chi\right\rangle +\left\langle \boldsymbol{A}\right\rangle \boldsymbol{\cdot}\left\langle \boldsymbol{B}\right\rangle \right)\mathrm{d}V={-}\frac{1}{R_{m}\tau_{c}}\int\left\langle \chi\right\rangle \mathrm{d}V-2\eta\int\left\langle \boldsymbol{B}\right\rangle \boldsymbol{\cdot}\left\langle \boldsymbol{J}\right\rangle \mathrm{d}V-\int\boldsymbol{\nabla}\boldsymbol{\cdot}{\boldsymbol{\mathcal{F}}}^{\chi}\,\mathrm{d}V,\end{align}
where the heuristic term  ${\boldsymbol {\mathcal {F}}}^{\chi }=-\eta _{\chi }\boldsymbol {\nabla }\langle \chi \rangle ^{(\textrm {tot})}$ was suggested in the above-cited paper in substitution of the third-order correlations, which involve products of the small-scale turbulent parts of the vector potential, magnetic field and currents (see also Kleeorin & Rogachevskii Reference Kleeorin and Rogachevskii1999). Subtracting (A26) from (A29) we get
 \begin{align} \left(\frac{\textrm{d}}{\textrm{d}t}+\frac{1}{R_{m}\tau_{c}}\right)\int\left\langle \chi \right\rangle \mathrm{d}V & ={-}2\int{{\boldsymbol{\mathcal{E}}}} \boldsymbol{\cdot}\left\langle \boldsymbol{B}\right\rangle \mathrm{d}V-\int\boldsymbol{\nabla}\boldsymbol{\cdot} {\boldsymbol{\mathcal{F}}}^{\chi}\,\mathrm{d}V\nonumber\\ &\quad - 2\oint\left({\boldsymbol{\mathcal{E}}}\times{\left\langle \boldsymbol{A}\right\rangle }\right)\boldsymbol{\cdot}\boldsymbol{n}\,\mathrm{d}S-2\oint\left(\left\langle \boldsymbol{A}\right\rangle \boldsymbol{\cdot}\left\langle \boldsymbol{U}\right\rangle \right)\left(\left\langle \boldsymbol{B}\right\rangle \boldsymbol{\cdot}\boldsymbol{n}\right)\mathrm{d}S \nonumber\\ & \quad - 2\eta\oint\left(\left\langle \boldsymbol{A}\right\rangle \times\left\langle \boldsymbol{J}\right\rangle \right)\boldsymbol{\cdot}\boldsymbol{n}\,\mathrm{d}S+\oint\left(\left\langle \boldsymbol{A} \right\rangle \boldsymbol{\cdot}\left\langle \boldsymbol{B}\right\rangle \right)\left(\left\langle \boldsymbol{U}\right\rangle \boldsymbol{\cdot}\boldsymbol{n}\right)\mathrm{d}S \nonumber\\ & \quad - \oint\left(\left\langle \boldsymbol{A}\right\rangle \times\partial_{t}\left\langle \boldsymbol{A}\right\rangle \right)\boldsymbol{\cdot}\boldsymbol{n}\,\mathrm{d}S. \end{align}
The last term in the above equation is zero for divergence-free surface vector potentials (Berger & Hornig Reference Berger and Hornig2018). In our definitions, the vector potential consists of the sum of the divergence-free components and the pure radial components (see (A3) and (A4)). Therefore, the last term in (A30) is zero as well.