Introduction
In popular culture, ageing is typically reduced to loss of youth and portrayed as a problem to be dealt with by hiding and masking it as long as possible (Van Bauwel, Reference Van Bauwel2018). Unsurprisingly, then, despite being the fastest growing age group in American society and avid television viewers, older adults have been marginally represented in media for decades (e.g. Lauzen and Dozier, Reference Lauzen and Dozier2005; United Nations Department of Economic and Social Affairs, 2017). Using various theoretical perspectives, scholars have examined this phenomenon and argued that both the amount and characteristics of media representation can affect a society's perception of ageing and older adults.
For instance, cultivation theory posits that as a result of long-term exposure, heavy television (TV) viewers tend to align their beliefs about social reality with the worldview presented on TV. This is because TV conveys a narrow set of messages – consistent across genres and over time – which reflect the values and interests of media companies in charge of programme production (Morgan, Reference Morgan, Nabi and Oliver2009). Therefore, the messages included in primetime programmes are designed not to deviate significantly from the views perceived to be shared by most viewers. Previous research has argued that exposure to programmes in which older adult characters are absent or depicted in limited ways could result in perpetuating stereotypical views related to ageing and older adults (Signorielli, Reference Signorielli2004). On the other hand, intergroup contact theory suggests that interaction with members of different social groups can help improve outgroup attitudes (Brown and Hewstone, Reference Brown and Hewstone2005). Recent studies have shown that such contact does not need to be direct and that even exposure to outgroup characters in the media can be effective (see Park, Reference Park2012). Accordingly, more frequent exposure to and positive portrayals of older adult characters could facilitate more favourable perceptions of older adults among younger audiences (Joyce and Harwood, Reference Joyce and Harwood2014). In addition, the social identity theory suggests that characteristics of media representation of older adults can be consequential for social identification, self-esteem and feeling of worth among older viewers (Williams et al., Reference Williams, Ylänne, Wadleigh and Chen2010).
These and similar theoretical perspectives have inspired an impressive amount of empirical research which analysed media representations of older adults over several decades in various contexts: on primetime TV (Vernon et al., Reference Vernon, Williams, Phillips and Wilson1991; Robinson and Skill, Reference Robinson and Skill1995; Signorielli, Reference Signorielli2004; Lauzen and Dozier, Reference Lauzen and Dozier2005; Lauzen et al., Reference Lauzen, Dozier and Reyes2007), in teen movies (Robinson et al., Reference Robinson, Callister and Magoffin2009), animated movies (Robinson et al., Reference Robinson, Callister, Magoffin and Moore2007; Zurcher and Robinson, Reference Zurcher and Robinson2018), children's books (Hollis-Sawyer and Cuevas, Reference Hollis-Sawyer and Cuevas2013), print advertisements (Miller et al., Reference Miller, Miller, McKibbin and Pettys1999; Williams et al., Reference Williams, Ylänne, Wadleigh and Chen2010) and TV commercials (Miller et al., Reference Miller, Leyell and Mazachek2004; Lee et al., Reference Lee, Carpenter and Meyers2007). With only scarce exceptions, previous studies have shown that older adults, especially women and ethnic minorities, are grossly under-represented (e.g. Vernon et al., Reference Vernon, Williams, Phillips and Wilson1991; Signorielli, Reference Signorielli2004; Lee et al., Reference Lee, Carpenter and Meyers2007). Furthermore, even when older people appear in the media, they are frequently represented in a stereotypical manner and cast in marginal roles within limited social contexts (Vasil and Wass, Reference Vasil and Wass1993; Lee et al., Reference Lee, Carpenter and Meyers2007).
Even in today's complex media environments, primetime TV series still offer significant opportunities for mediated contact with and exposure to older adult characters for millions of viewers, many of whom have limited contact with older adults in the real world (Signorielli, Reference Signorielli2004). The last comprehensive, peer-reviewed quantitative content analysis of the portrayal of older adults on primetime TV in the United States of America (USA), published in a scientific journal, was conducted for the 2003–2004 TV season, and its results were mostly consistent with that of earlier studies (Lauzen et al., Reference Lauzen, Dozier and Reyes2007). Since then, several developments have occurred which signal a change in how older adults are represented. As media landscapes become more diversified, younger viewers are increasingly turning towards new platforms such as streaming services, which increases the importance of the older cohort in TV viewership (Kang, Reference Kang2014). Further, there are signs of change in the way entertainment television contributes to the public discussion on race, gender and sexual identities, by providing more diversity, nuance and complexity in portrayals (see Sink and Mastro, Reference Sink and Mastro2017). In some cases, these portrayals also involve the issues of ageing. For instance, the main character on Transparent is an older transgender woman, and the cast of Grace and Frankie includes two older women and two gay men. However, these important examples were produced for streaming services, not for traditional broadcast/cable primetime TV. Do these examples constitute the norm, or are they just notable exceptions in the contemporary media landscape? This study updates previous literature by examining how, if at all, the portrayal of older adults in primetime fiction TV series has changed in the context of changing media environments and audience structures. Specifically, it focuses on quantitatively analysing the prevalence and diversity of older adult characters and age stereotypes in their portrayals.
Persisting invisibility
TV show creators make numerous decisions regarding what characters to feature and how to represent them. At least to some extent, these decisions are informed by the intention to attract the largest possible audience whose attention could be sold to advertisers (Gross, Reference Gross2001). Only a limited number of characters can be cast in an episode; therefore, the decision to exclude or include a character of a certain social group reflects that group's perceived status in society. Thus, by examining the structure of the portrayal of older adults in the media, we can understand the expectations that producers and writers have about how their target audiences perceive older adults (Robinson et al., Reference Robinson, Skill, Turner, Nussbaum and Coupland2004).
So far, the most consistent finding of the extant literature on media portrayal of older adults – which dates back to the 1970s – is that older adults are visibly absent (Signorielli, Reference Signorielli2004). Vasil and Wass (Reference Vasil and Wass1993) reviewed the early studies on the media portrayal of older adults and found under-representation to be most striking in primetime TV where senior characters account for between 1.5 and 4.9 per cent of the TV population.
Under-representation of older adults in the media was often explained by the market logic (e.g. Robinson et al., Reference Robinson, Skill, Turner, Nussbaum and Coupland2004) which encourages production of programmes that appeal to wider audiences. Some scholars have argued that as the ratio of older people in the general population increases, their visibility in the media would rise as well. However, many studies reported that, in fact, this has not happened. For example, Robinson and Skill (Reference Robinson and Skill1995) reported that senior characters accounted for only 2.8 per cent in primetime TV series in 1990, which was not substantially different from the ratios reported two decades earlier. A more recent study found less than 4 per cent of characters to be older than 60 on primetime programmes in the 2003–2004 TV season (Lauzen et al., Reference Lauzen, Dozier and Reyes2007). To put this in perspective, the ratio of people aged 65 and older in the American population rose from 10 per cent in 1970 to 12.3 per cent in 2004.
In line with the market logic argument, the only notable exceptions to under-representation of older adults can be found in studies examining portrayal in the media catering to this age group. Williams et al. (Reference Williams, Ylänne, Wadleigh and Chen2010) found that 62 per cent of magazine advertisements targeting older audiences contained senior characters, which is ten times more than advertisements in magazines intended for general audiences. Similarly, another commonly referenced exception to many findings regarding under-representation of older adult characters on TV is an analysis of day-time soap operas, which found 15.9 per cent of the characters to be older adults (Cassata et al., Reference Cassata, Anderson and Skill1980). While primetime TV programming targets mainly younger audiences with higher disposable incomes, day-time soap operas cater to different audiences including housewives and retired persons. In conclusion, previous findings almost uniformly show a strong tendency for popular entertainment programming to exclude older adults, which served as a basis for our first hypothesis:
• Hypothesis 1 (H1): Older adult characters will be under-represented in primetime fiction TV series in the USA compared to the census data on the ratio of older adults in the general population.
The lack of diversity among older adult characters in the media
In addition to under-representation, another striking finding in previous literature is the lack of diversity among the media portrayal of older adults. For example, numerous studies analysed the gender of older adult characters and found that even though women account for the majority of the older adult population, this reality does not translate well to the media. On the contrary, Vernon et al. (Reference Vernon, Williams, Phillips and Wilson1991) found twice as many older adult men compared to women, while Lauzen et al., (Reference Lauzen, Dozier and Reyes2007) reported an even more dramatic ratio with men accounting for almost three-quarters of all older adult characters. Television strongly favours younger women as most women TV characters are in their thirties and forties (Signorielli, Reference Signorielli2004).
Moreover, older adults form a considerably more homogenous group in terms of their chronological age in the media compared to that in the real world. Miller et al. (Reference Miller, Leyell and Mazachek2004) found that young-old characters (60–74 years old) outnumber old-old characters (75 years and older) threefold in TV commercials. In addition, Miller et al. (Reference Miller, Miller, McKibbin and Pettys1999) have analysed the portrayal of older adults in print advertisements and found 53 characters to be 65–74 years old and only six characters to be 75 years and older. The bias towards the young-old group among older adults is in line with contemporary discourses on ageing which promote an image of a successful, healthy and active ageing experience (Whelehan and Gwynne, Reference Whelehan, Gwynne, Whelehan and Gwynne2014). The discourse on successful ageing is more commonly associated with older adults who have not yet reached their mid-seventies, in comparison to those in their late seventies and older – to whom more traditional narratives of decline and loss still apply (Van Bauwel, Reference Van Bauwel2018).
Similar to the findings about gender and age, previous studies revealed limited variability when it comes to ethnicity of older adult characters. Signorielli (Reference Signorielli2004) found that white men comprise the most numerous section of older adult characters, followed by white women and minority men with similar rates of representation. According to another study (Lee et al., Reference Lee, Carpenter and Meyers2007), 86 per cent of print advertisements featuring older adults included Caucasian older adults, 13 per cent portrayed African Americans and 12 per cent included older adults of other ethnicities.
Other aspects of diversity have received less research attention in the study of media portrayal of older adults compared to gender, age and ethnicity. However, insights from a wider literature on representation of social class, sexual minorities and people with disabilities indicate that minoritarian identities are often absent from the media. In a comprehensive examination of diversity in the US media, Luther et al. (Reference Luther, Lepre and Clark2012) note that entertainment TV programming both reflects societal trends and promotes desirable social conditions. In other words, primetime TV programmes are likely to include a combination of characters with which a majority of viewers could easily identify, and characters they would desire to become. Subsequently, most characters in TV series are middle- and upper-middle class. Working-class and low-income people rarely appear, and when they do, they are ridiculed and portrayed in an unflattering manner. Further, research on representation of sexual and gender minorities shows that, since the mid-1990s, visibility of lesbian and gay characters has increased, although the same does not apply to transgender and bisexual characters (Luther et al., Reference Luther, Lepre and Clark2012; Garretson, Reference Garretson2015). In 2000, only 2 per cent of characters in popular sitcoms were identified as gay (Fotus and Inch, Reference Fotus and Inch2005). A half decade later, a study found 7.5 per cent of characters to be gay and bisexual in primetime TV series which feature recurring lesbian, gay, bisexual and transgender (LGBT) characters (Netzley, Reference Netzley2010). Finally, previous findings suggest that people with disabilities are among the most under-represented groups in the media (Nelson, Reference Nelson, Lester and Ross2003). For instance, Farnall and Lyons (Reference Farnall and Lyons2012) analysed 2009 primetime TV advertisements and found only 1.7 per cent of advertisements included people with disabilities. The TV season of 2018–2019 saw a slight increase of characters with disabilities who accounted for 2.1 per cent of the TV population (GLAAD, 2018). Yet, the actors who play such roles were almost exclusively able-bodied (Butler, Reference Butler2016).
In sum, in addition to under-representation issues, previous literature shows that the media tend to favour the most powerful sections of the older population, i.e. an older character usually appears as a white man. However, little is known about other aspects of diversity of older adult characters. The following hypotheses and research questions are posed to better understand how diverse older adult characters are on primetime TV and how well they represent the diversity of older Americans:
• Hypothesis 2 (H2): Older men characters will outnumber older women characters.
• Hypothesis 3 (H3): Young-old adult characters will outnumber both middle-old and old-old adult characters.
• Research question 1 (RQ1): How diverse are older adult character portrayals in terms of the character's (a) ethnicity, (b) social class, (c) sexual orientation and (d) disability status?
Age stereotypes in media portrayals of older adults
When it comes to issues of representation in the media, it is important to discuss not only who is (not) included in media contents but also how they are portrayed. Media portrayals of social groups typically reflect and reproduce widely shared beliefs of the audiences (Signorielli, Reference Signorielli2004). Ageing is an immensely complex, mysterious and contradictory experience for ageing persons, and their close communities and societies. Cole (Reference Cole1992) describes how cultures offer significant repositories of meaning for people to make sense of ageing and human temporality. Since the early 19th century, there has been a strong tendency to think about ageing and older adults in simplistic, binary terms: as succeeding or failing to preserve youthfulness and combating the signs of age-related decline of mental and physical function. This type of binary thinking is reflected in several persistent and widely shared age stereotypes – positive and negative generalisations about people based on their age group (Hummert et al., Reference Hummert, Gratska, Shaner and Strahm1994). On the one hand, these stereotypes can help individuals and societies process uncontrollable complexities of ageing. On the other hand, stereotypes can play a part in reinforcing ageism, i.e. prejudices and discrimination against older adults either at an individual or system level (Butler, Reference Butler1980; Schmidt and Bolard, Reference Schmidt and Boland1986; Miller et al., Reference Miller, Miller, McKibbin and Pettys1999; Hummert et al., Reference Hummert, Gratska, Bouchard Ryan, Bonnesen, Nussbaum and Coupland2004).
By reverberating age stereotypes, the media can become an important conduit of ageism. Negative stereotypical portrayals are commonly recognised as the most explicit form of ageism, because negative age stereotypes perpetuate the idea of ageing and older adults as a burden at both individual and societal levels. For Rozanova et al. (Reference Rozanova, Northcott and McDaniel2006), this is a form of intergenerational ageism, because negative stereotypes evoke evaluations of older adults as inferior to the youths. In contrast, positive age stereotypes tackle the intergenerational inequalities by portraying older adults just as healthy, independent and productive as their younger counterparts. However, these positive stereotypical portrayals are limited in that they draw upon the same dichotomy as the negative ones. Thus, they do not challenge the idea that there are both desirable and unattractive versions of ageing but suggest that the latter can and should be overcome. As a result, positive stereotypical representations can reinforce intragenerational inequalities by attributing, even if only implicitly, lesser value to people whose diverse ageing experiences are inconsistent with narratives of ageing as maintained youthfulness, ability and power (McHugh, Reference McHugh2003; Rozanova et al., Reference Rozanova, Northcott and McDaniel2006).
Further, scholars have codified widely shared age stereotypes and provided systematic and comparable guidelines to measure them. As a result, previous empirical research identified various persistent stereotypes towards a generalised older adult in American society. Schmidt and Boland (Reference Schmidt and Boland1986) asked university students to organise 99 personal traits into groups that represent typical older persons. The authors identified eight negative (the despondent, the mildly impaired, the vulnerable, the severely impaired, the shrew/curmudgeon, the recluse, the nosy neighbour and the bag lady/vagrant) and four positive age stereotypes (the John Wayne conservative, the liberal matriarch/patriarch, the perfect grandparent and the sage). Using mostly the same traits with a few additions, Hummert et al. (Reference Hummert, Gratska, Shaner and Strahm1994) repeated the experiment on representative samples of young, middle-aged and older adults. Even though the authors identified some differences in stereotypes among different age groups, they also found three positive and four negative age stereotypes shared by all generations in their sample. These findings were persistent across time (Hummert et al., Reference Hummert, Gratska, Bouchard Ryan, Bonnesen, Nussbaum and Coupland2004; Blaine, Reference Blaine2007). Positive age stereotypes included the golden ager (adventurous, healthy and active), the perfect grandparent (family-oriented, kind and loving) and the John Wayne conservativeFootnote 1 (patriotic, nostalgic and religious). On the other hand, negative stereotypes included the severely impaired (senile and incompetent), the despondent (sad and lonely), the shrew/curmudgeon (complaining and ill-tempered) and the recluse (timid and naïve).
Building upon this line of research, scholars have also applied previously identified classifications of age stereotypes in quantitative content analyses of media portrayals of older adults. For instance, Robinson et al. (Reference Robinson, Callister and Magoffin2009) reported that portrayals of 59 per cent of older characters in teen movies were consistent with some age stereotypes – mostly positive – and the perfect grandparent and the shrew were the most frequently applied positive and negative stereotypes, respectively. A recent examination of animated movies (Zurcher and Robinson, Reference Zurcher and Robinson2018) found 44 per cent of applied age stereotypes to be negative, with the shrew being the most pronounced. Again, the perfect grandparent was the most commonly applied positive stereotype. Previous findings indicate that the most prevalent positive stereotypical representation of older people can be found in advertisements (Miller et al., Reference Miller, Miller, McKibbin and Pettys1999; Lee et al., Reference Lee, Carpenter and Meyers2007). A recent analysis of Super Bowl commercials found no less than 80.5 per cent of commercials included positive stereotypes of older adults (Brooks et al., Reference Brooks, Bichard and Craig2016). This is in stark contrast with the early studies reporting media portrayal of older adults to be mostly negative (see Vasil and Wass, Reference Vasil and Wass1993).
When it comes to primetime TV, Vernon et al. (Reference Vernon, Williams, Phillips and Wilson1991) reported more positive portrayals of older adult characters than that in earlier studies. Specifically, most common positive characteristics were ‘active’ and ‘socially involved’, while negative characteristics included ‘arrogant’ and ‘unpleasant’. The authors also found a gender difference in the stereotypes, with men scoring higher on six out of nine positive, and women scoring higher on seven out of nine negative characteristics. Another study found that, compared to younger characters, older adults are typically represented as less powerful, sexually less active and less engaged in leisure activities (Lauzen et al., Reference Lauzen, Dozier and Reyes2007). The following research questions were asked to examine the prevalence of commonly identified age stereotypes (Hummert et al., Reference Hummert, Gratska, Shaner and Strahm1994), as well as whether and how distribution of stereotypes differs based on a character's identity and role prominence in recent primetime TV series:
• Research question 2a (RQ2a): What age stereotypes are applied in portrayals of older adult characters in primetime TV series?
• Research question 2b (RQ2b): How does the application of age stereotypes relate to older adult characters’ role prominence, age, gender, ethnicity, social class, sexual orientation and disability status?
Methods
This study employed quantitative content analysis to examine the presence and nature of portrayals of older adult characters in popular American fiction TV series. Neuendorf (Reference Neuendorf2002: 10) defined content analysis as ‘a summarizing, quantitative analysis of messages that relies on the scientific method (including attention to objectivity-intersubjectivity, a priori design, reliability, validity, generalizability, replicability, and hypothesis testing)’. The analysis covered TV series broadcast from the season of 2004–2005 to 2017–2018, or 14 TV seasons in total. The beginning year for the analysis was selected considering that the last systematic examination of portrayals of older adult characters on primetime scripted TV in the USA that was published in a peer-reviewed journal was conducted for the 2003–2004 TV season (Lauzen et al., Reference Lauzen, Dozier and Reyes2007).
Sampling
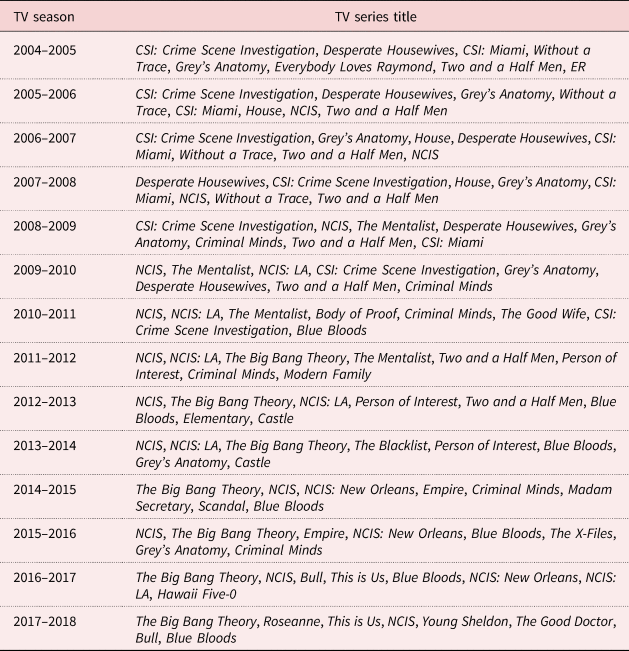
The sample for this study was collected according to the following procedure. First, for each TV season in the timeframe, the eight most popular fiction TV series were listed based on the Nielsen ratings for primetime TV programmes in the USA. The sample only included fiction series regardless of genre, while other types of programming, such as reality series (e.g. Survivor), sports telecasts (e.g. Sunday Night Football) or news programmes (e.g. 60 Minutes) were excluded. Then, one episode was randomly selected for each season of the TV show that was selected in the first sampling stage, resulting in a total of 112 episodes. First episodes of each season were excluded from the sampling frame, because they can have significantly different content characteristics than that of the rest of the season (Lauzen et al., Reference Lauzen, Dozier and Reyes2007). The final sample comprises one or more episodes of 33 different TV series (Table 1), depending on how many times a series was ranked among the top eight fictional series according to the Nielsen ratings.
List of primetime television (TV) series included in the sample, by TV season
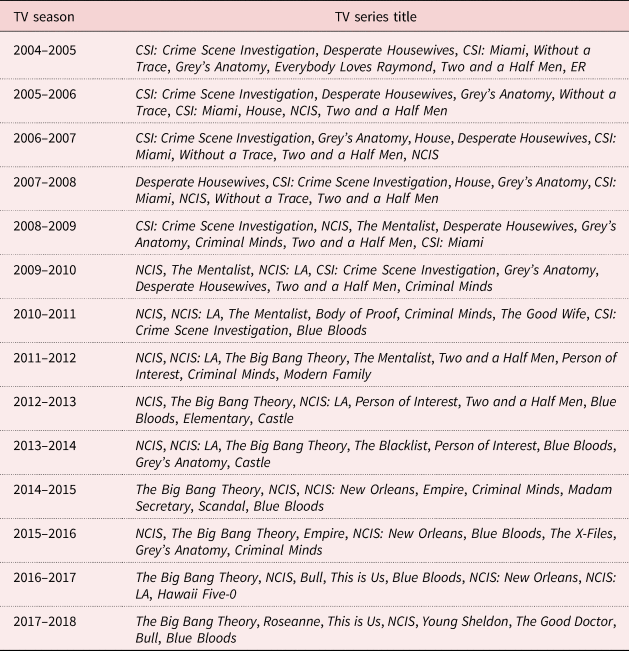
Note: One episode was randomly selected from each TV series per TV season which was included in the list.
Coding procedure
The unit of analysis for this study was a character. Coding was conducted by two coders; one of them is one of the co-authors of the study. The first task for the coders was to record each character with a speaking role and determine his or her age group. Next, coders determined whether a character was younger or older than 65. Following previous studies, if a character's age was not explicitly stated, the character was coded as 65 or older based on available cues such as physical appearance (e.g. grey hair, wrinkled skin, cracking voice), playing a role of a parent of middle-aged children or a grandfather, living in a care facility, etc. (Vernon et al., Reference Vernon, Williams, Phillips and Wilson1991; Robinson and Skill, Reference Robinson and Skill1995). Further, coders determined older characters’ chronological age and coded them as ‘young-old’ (65–75 years old), ‘middle-old’ (75–85 years old) and ‘old-old’ (85 years and older). Recording all characters with a speaking role was important for establishing the ratio of older adult characters in popular primetime series. However, since the focus of the study was to analyse portrayals of older adult characters, the rest of the coding categories were applied exclusively to older adult characters.
After identifying the older adult characters, the coders assessed their role prominence in the episode. Role prominence was operationalised as ‘major’, ‘supporting’ and ‘minor’ in the context of an episode. Major characters are considered central to the plot; a considerable portion of air time is dedicated to their actions, and the names of the actors/actresses playing the roles usually appear in the opening credits. Supporting characters play an important part in the plot, usually in relation to major characters; however, they are not the primary focus of the story. In contrast, minor characters briefly appear; their presences are not essential for story development, and they are often not addressed by their names (Robinson and Skill, Reference Robinson and Skill1995).
Character gender was classified into ‘women’, ‘men’ and ‘non-binary’. Characters who predominantly exhibited typical masculine or feminine physical features were coded as men or women, respectively. Any other gender identity expressions such as transgender, non-conforming, agender or genderqueer were coded as non-binary. Ethnicity of the characters was operationalised as ‘Caucasian’, ‘African American’, ‘Hispanic’, ‘Asian/Pacific Islander’, ‘mixed’ and ‘other’; and determined based on visual and verbal cues.
Social class was coded as ‘lower’, ‘middle’ or ‘upper’ class based on the perceived wealth and living conditions of an older adult character. Characters were coded as lower social class if they were portrayed as struggling to make a living, unemployed or performing low-paid physical work, in poor living conditions or homeless, receiving inadequate care, unable to meet their basic needs, or possessing only few or low-quality personal belongings. Characters were identified as middle class if portrayed as able to afford a relatively decent living in terms of housing, clothing and leisure activities. Upper class was coded if a character was portrayed as leading a luxurious lifestyle, being influential, and either having a highly prestigious job or being able to maintain a financially carefree lifestyle without needing to work.
Sexual orientation of characters was coded as ‘straight’, ‘gay’, ‘lesbian’, ‘bisexual’, ‘other’ or ‘unknown’. Characters married to, dating, or in any other way sexually or romantically involved with or interested in a member of the opposite sex were coded as straight. Women and men characters in such relations with a character of the same sex were coded as lesbian and gay, respectively. A character's sexual orientation was coded as bisexual if he or she was sexually or romantically involved with or interested in characters of both the same and the opposite sex. If a character's sexuality was not referenced, it was coded as unknown.
Coders also recorded whether a character displayed any type of disability. Classification provided in this study is based on examination of previous work on portrayals of characters with disabilities in mass media (Safran, Reference Safran1998; Saito and Ishiyama, Reference Saito and Ishiyama2005) and recent guidelines by relevant organisations (e.g. WebAIM). It comprises ‘physical’, ‘cognitive’ and ‘mental’ disabilities. Physical disabilities refer both to loss of or limited mobility (e.g. reduced limb function or paraplegia) and sensory impairments (e.g. visual or hearing impairment). A person with a cognitive disability may encounter difficulties with a variety of mental tasks such as processing information, remembering, communicating and learning. Examples include learning disabilities such as dyslexia and clinical cognitive disabilities such as dementia. Finally, mental illnesses refer to a variety of mental health conditions which can affect the way a person feels, thinks or behaves, such as depression, schizophrenia, obsessive compulsive disorder or post-traumatic stress disorder.
To examine the presence of age stereotyping, the study applied a widely used framework of three positive and four negative stereotypes about older people (Hummert et al., Reference Hummert, Gratska, Shaner and Strahm1994). This typology was previously applied to studies of portrayals of older adults in TV commercials (Miller et al., Reference Miller, Leyell and Mazachek2004; Lee et al., Reference Lee, Carpenter and Meyers2007) and print advertisements (Miller et al., Reference Miller, Miller, McKibbin and Pettys1999), but not to a study of characters in fiction TV series. To determine the existence and strength of stereotypical representations, the coders considered characters’ behaviours, health and living conditions, visible psychological states and interactions with other characters in the context of an episode. Following Miller et al. (Reference Miller, Miller, McKibbin and Pettys1999), an ordinal scale was used to measure the existence and strength of age stereotypes in portrayals of older adult characters. A portrayal was considered ‘not consistent’ with a certain stereotype if a character exhibited none or hardly any traits comprising that stereotype. If a portrayal included references to some but not most traits listed as representative of a stereotype, it was coded as ‘somewhat consistent’. Finally, if a character was represented in a way that matches all or the majority of the traits, it was coded as ‘consistent’ with that stereotype.
Intercoder reliability
The agreement between the two coders was calculated on a subset of 28 randomly selected episodes from the sample, which yielded 40 older adult characters. Perfect agreement was observed for the variables gender, ethnicity, disability and some age stereotype variables (the John Wayne conservative, the severely impaired, the despondent and the recluse). For the variables age, role prominence, socio-economic status, sexual orientation, the golden ager and the perfect grandparent, Krippendorf's alpha values ranging from 0.70 to 0.95 were obtained. It is important to note that the reliability score obtained for the shrew stereotype was 0.66, just below the least acceptable value of 0.67 according to Krippendorff (Reference Krippendorff2004). However, due to its importance for this study, this variable was retained. Yet, this note should be taken into consideration when interpreting the results. After establishing intercoder reliability, the rest of the sample was randomly divided and independently coded by the two coders.
Findings
Representation and diversity of older adult characters
Based on the analysis of 112 episodes of popular fictional TV shows in the USA, we found 2,003 characters in total, 133 of whom (6.6%) were coded as older adults. Given that the ratio of senior citizens in the general population in the observed period rose from 12.3 per cent in 2004 to 15.4 per cent in 2017, we can conclude that the percentage of older adult characters found in this study still indicates signs of under-representation, supporting H1. Compared to previous studies of older adults’ representation – especially in the context of primetime TV – this study records a small shift towards greater representation.
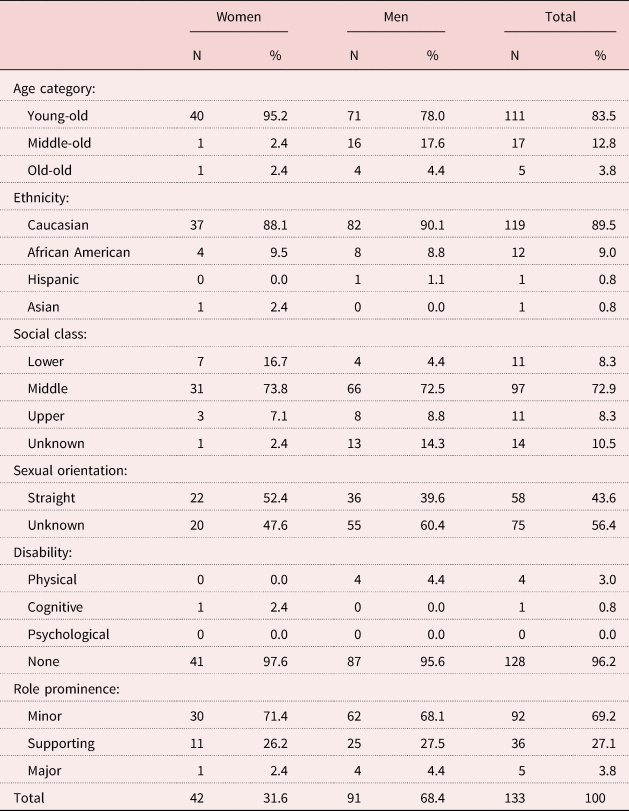
Regarding the gender of older adult characters, even though our coding scheme was designed to record gender expressions beyond the binary gender classification, all older adult characters could be coded as either men or women. Consistent with previous research, this study found men to outnumber women characters, supporting H2. Men appeared more than twice as often as women, accounting for 68.4 per cent of all older adult characters, yielding yet more evidence that women face the double jeopardy of representation on TV – discriminated based on both their age and gender.
H3 assumed that young-old characters would outnumber other age groups of older adult characters. The findings show that 111 characters were coded as young-old (83.5%), while considerably fewer were coded as middle-old (N = 17, 12.8%) and old-old (N = 5, 3.8%). Thus, H3 was also supported.
In addition to age and gender, RQ1 inquired about diversity of older adult representation in terms of ethnicity, social class, sexual orientation and disability status (Table 2). In terms of their ethnic background, 89.5 per cent of older adult characters were coded as Caucasian, while African Americans (9.0%) accounted for the most visible minority group. Asian and Hispanic older adult characters appeared extremely rarely, at the rate of 0.8 per cent each. Analysis of socio-economic status revealed that for most older adult characters, financial circumstances are not a major concern as 72.9 per cent were coded as middle class and 8.3 per cent were coded as upper class. In contrast, only 8.3 per cent of older adult characters were coded as lower class. Regarding a character's sexuality, the analysis showed that portrayals of almost half of older adult characters (43.6%) included references to straight sexual orientation, while sexuality remained unreferenced for the rest. There were no older LGBT characters in our sample. Finally, analysis of disabilities among older adult characters resulted in virtually no variability, with almost all characters (95.6%) being represented as having no apparent disabilities. The rare exceptions include four men characters (2.7%) with physical disabilities and one woman character (0.5%) depicted with signs of cognitive disability.
Frequency and diversity of older adult characters in popular American primetime television series

Age stereotypes
RQ2a asked what age stereotypes were applied to representations of older adult characters. The analysis showed that portrayals of 51.9 per cent of characters included elements of at least one age stereotype, which were mostly positive. The most prevalent positive stereotype was the golden ager with 44 characters (33.1%) portrayed as somewhat consistent and three characters (2.3%) portrayed as consistent with this stereotype. Representations of 17 characters (12.8%) were coded either as somewhat consistent or consistent with the perfect grandparent stereotype, while portrayal of 11 characters (8.3%) included elements of the John Wayne conservative stereotype (Table 3).
Frequencies of stereotypical representations of older adults in popular American television series

Considerably fewer characters – 19 in total (14.3%) – were portrayed with references to any of the four negative stereotypes. Among them, the most prevalent was the shrew with 13 (9.8%) characters portrayed as somewhat consistent or consistent with this stereotype. Seven characters (5.3%) were portrayed as at least somewhat consistent with the despondent stereotype, while three characters (2.3%) included references to the severely impaired stereotype. Finally, no character was coded as consistent with the recluse stereotype.
RQ2b asked how distribution of age stereotypes relates to a character's role prominence, gender, ethnicity, social class, sexual orientation and disability. Our analytical strategy for answering this question was to conduct a series of chi-square tests and examine the variability in each stereotype's distribution. However, due to limited variability, some of the variables needed to be recoded before the analysis. Even after reducing the number of categories, the following variables still showed extremely limited levels of variability and were dropped from further analyses: disability status, sexual orientation, and the severely impaired and the shrew stereotypes. The results also revealed a large number of cells with an expected count of less than five, indicating a violation of presumption for chi-square tests. Hence, instead of chi-square tests, the results from Fisher's exact tests were reported (see Table 4).
Distribution of age stereotypes as a function of older characters’ age, gender, ethnicity and role prominence

Notes: OR: odds ratio. CI: confidence interval. For all age stereotype variables, the values for the category labelled ‘present’ were obtained by combining the ‘somewhat consistent’ and ‘consistent’ portrayal inputs. The category labelled ‘minority’ under ‘ethnicity’ refers to African Americans, Asian and Hispanic characters. Major role prominence was computed by combining the values for major and supporting roles. Values for the severely impaired, recluse, sexual orientation and disability status variables were not included due to extremely low levels of variability.
The distributions of the age stereotypes did not significantly vary according to a character's gender and ethnicity. The age of the older adult characters appears to be associated with the way the John Wayne conservative stereotype is allocated (p = 0.02, odds ratio (OR) = 5.15, 95% confidence interval (CI) = 1.41–18.75); this stereotype is disproportionately applied in portrayals of characters who are older than 75, compared to young-old characters. Finally, role prominence was significantly related with the golden ager (p < 0.001, OR = 29.52, 95% CI = 10.83–80.47), the perfect grandparent (p < 0.001, OR = 7.20, 95% CI = 2.34–22.17) and the John Wayne conservative (p < 0.001, OR = 12.66, 95% CI = 2.59–61.72) stereotypes. In all three cases, being in a supporting or major role was associated with disproportionately more frequent allocation of positive stereotypes compared to older characters cast in minor roles. In contrast, distribution of negative age stereotypes did not significantly vary based on role prominence.
Discussion
This study utilised quantitative content analysis to examine portrayals of older adults in popular American primetime TV series in terms of prevalence, diversity and age stereotypes. The findings show a minor increase in representation rate compared to that reported in previous studies; however, older adults are still grossly under-represented considering their share in the general population. Additionally, the results indicate a dramatic lack of diversity of older adults on fiction TV, most notably in the case of the old-old, some ethnic minorities, LGBT and people with disabilities. In terms of age stereotypes, this study found positive stereotypes to be more frequently applied, with the golden ager being the most prominent.
How much importance should we place on the ratio of older adult characters when discussing issues of representation? Bell (Reference Bell1992) criticised early content analytical research for putting too much emphasis on the number of characters in different age groups. He argued that even a perfect match between the actual and the TV population would not be sufficient to solve all problems of representation. Although this is a valid point, the amount of media representation still matters, because it indicates the perceived status of a group in a society. Persisting under-representation of older adults in the media exemplifies a widespread cultural fixation with youth and rejection of old age (Van Bauwel, Reference Van Bauwel2018). It can be interpreted as a signal that the value and respect a person deserves decreases with age (Lauzen and Dozier, Reference Lauzen and Dozier2005). In contrast, recent work on mediated contact theory suggests that simply increasing the presence of outgroup members in the media can help improve outgroup attitudes (Wojcieszak and Azrout, Reference Wojcieszak and Azrout2016). Thus, although small, the trend of increasing representation of older adult characters in popular TV shows could positively influence attitudes towards older adults. Simultaneously, the older adult population is not monolith and comprises individuals of various class, gender, race and other identities. Yet, the intersection of ageing with other minoritarian identities renders many lives invisible to wide audiences. After watching dozens of hours of primetime fiction TV programmes, we were able to identify only a handful of older adult characters above 85 years of age, with disabilities, of Asian or Hispanic ethnicity, and non-normative sexuality and genders. Such representation patterns reveal significant inequalities within the older adult population. Whereas more powerful segments of the population (e.g. white, middle-class, straight men) are allowed to keep some relevance in old age, the most vulnerable ones are rendered completely invisible to the audiences.
In terms of the quality of portrayal, negative age stereotypes’ constituting an exception rather than a norm seems encouraging. As Luther et al. (Reference Luther, Lepre and Clark2012) argue, media portrayals reflect and reinforce existing societal myths about ageing that are mostly based on stereotypes, half-truths and over-exaggerations. Our findings regarding age stereotypes are not consistent with most ageing myths identified by these authors. For instance, we did not find support that the media is reinforcing myths about older adults being of poor health, disabled and losing their mental capacity. We found only one character in our sample to be depicted with a cognitive disability, and four other characters expressing some physical disability. Further, the most prevalent stereotype was found to be the golden ager, which includes characteristics such as ‘healthy’ and ‘active’ as its defining elements. In addition, this age stereotype is inconsistent with myths about older adults being uninterested in sex and trying new things. Thus, our findings suggest that TV series creators might be reluctant to use these negative myths about older adults in portrayals, as they do not expect these myths to resonate well with TV audiences.
In fact, taken together, our findings suggest that the most prevalent portrayals of older adults on primetime TV are closer to the positive pole of the dichotomy of ageing and the dominant discourse of successful ageing. In its original formulation, successful ageing was rooted in three ideas: low likelihood of disease and disability, high mental and physical capacity, and active social engagement (Rowe and Cosco, Reference Rowe, Cosco, Bengtson and Settersten2016). Our findings relating to the absence of disability, old-old age and poverty, as well as the pervasiveness of good health, productivity and sociability – reflective of the most commonly applied age stereotype (i.e. the golden ager) – are remarkably consistent with this understanding of successful ageing. As discussed earlier, positive representations can and should be seen as improvement compared to the depictions of old people as senile, ill, frail and stubborn. Simultaneously, critics have frequently discussed the shortcomings of the ideas associated with successful ageing and their manifestations in the media, which should also be considered when interpreting the findings of this study. Some scholars highlight that the emphasis on continuity of self reveals the strong tendency to deprive old age of any intrinsic value. This is why McHugh (Reference McHugh2003) referred to the successful ageing discourse as anti-ageing, while Andrews (Reference Andrews1999) saw it as a vehicle to convey the myth of agelessness – the idea that growing old is only meaningful if one can preserve one's youthfulness. Thus, the narrative of successful ageing is not used to describe how people experience ageing and make sense of it but to prescribe a desirable version of ageing (see Martinson and Berridge, Reference Martinson and Berridge2015). In this interpretation, success is narrowly defined from the perspective of ‘scientific management of ageing’ (Cole, Reference Cole1992) in terms of health, productivity and prosperity. According to Andrews (Reference Andrews1999), this means that the experiences of older adults are evaluated based on how well they conform to the needs of a society. By so doing, successful ageing is framed in terms of personal choices and treated as individual responsibility. By the same token, those whose ageing experiences do not resemble the successful ageing narratives bear the responsibility (and blame) for their circumstances, while the roles of institutional solutions and structural inequality are overlooked.
The prevalent patterns of portrayal in our sample suggest that the images of older adults in the media do not challenge but perpetuate these ideas. What is the significance of this finding? Our study was limited to a quantitative analysis of primetime TV contents, and it does not offer any empirical evidence for the audience's responses to such contents and their potential implications. However, interpreting the identified patterns in conjunction with relevant theoretical perspectives suggests important implications worth exploring in future studies. For instance, future studies should inquire into the impact of the patterns of media representations we identified on older adult viewers’ self-perceptions. According to the social identity theory (Brown, Reference Brown2000), identification with a social group can become an important source of self-esteem and sense of community. Thus, increasing rates and a more positive tone in the representation of older adults could empower older adult viewers by demonstrating the recognition and respect that their age group enjoys in a society. Simultaneously, the mediated bipolar ageism perspective warns that positive stereotyping could in fact have negative impacts on many older viewers’ self-perceptions (Andrews, Reference Andrews1999). As discussed above, this is because positive stereotypes reinforce hierarchies among older adults. If the most accessible media image of an older adult is that of someone healthy, active, socially engaged, productive and wealthy, it can impose unrealistic self-evaluation criteria on older adults who do not share these characteristics. More empirical research is needed to provide insight into diverse older adult audiences’ responses to media representations of ageing.
Since age stereotypes provide an effective heuristic to cope with the ambiguities of ageing, Cole (Reference Cole1992) suggested that education can never fully eliminate them; however, it can help promote critical reflection. Thus, in addition to providing insights for future research, our findings can help foster reflections on media representations of older adults and socio-cultural understandings of ageing among students and educators. Due to the study's design, the main findings provide a general overview of most prevalent patterns of media portrayals of older adults in primetime fiction TV programmes. In a classroom setting, these findings can help stimulate discussions about why the dominant representational patterns assume the described form and what they mean for diverse audiences, as well as whether and how they could be challenged.
Several limitations to the current study should be noted. For instance, our analysis was limited to characters in popular primetime TV shows. However, as media landscapes diversify, opportunities for exposure to entertainment programming are increasing. Therefore, future studies should consider analysing portrayals in alternative media, streaming services and social media platforms. A particularly valuable insight could come from examining portrayals in programmes in which older adults are also included in the capacity of producers, such as in YouTube videos. Another possible objection can be raised regarding the measurement of age stereotypes used, which was developed several decades ago. Although many characters did not display characteristics associated with these age stereotypes, there might have been some others that could not be captured with our coding instrument. Future studies should examine to what extent the existing tools measuring age stereotypes tap into contemporary perceptions of older adults.
These limitations notwithstanding, the current study provides an important update of the literature on media representation of older adults on primetime TV, revealing how some troubling tendencies are still persistent in contemporary media environments. Simply reducing the amount of overtly ageist content in the media is not sufficient. More holistic media representations of ageing can only appear through diversification of characters and by giving voice to less-powerful sections of the older adult population. By so doing, the public discussion can progress from prescribing what ageing should feel and look like based on a simplistic dichotomy, towards a more nuanced understanding of various lived experiences which can accommodate both change and continuity, decline and vigour.
Authors contributions
Both authors contributed substantially to designing and conceptualising the study, analysing and interpreting the data, and preparing the manuscript.
Conflict of interest
The authors declare no conflicts of interest.
Ethical standards
Ethical approval was not required.