Mobile patient equipment (MPE), such as blood pressure cuffs, thermometers, pulse oximeters and bladder scanners, are environmental surfaces that pose significant risk of infection to patients if not disinfected appropriately. Contaminated environmental surfaces can directly transmit multidrug-resistant organisms to patients, or they can travel on healthcare workers’ hands.Reference Boyce1, Reference Huang, Datta and Platt2 These devices require low-level disinfection by cleaning with a quaternary disinfectant or bleach-containing cleanser between uses. Although the disinfection process of MPE is important for reducing the bacterial burden and the subsequent risk for healthcare-associated infections (HAIs), low-level disinfection of MPE can be difficult to effectively implement and monitor.Reference Scott, Kane and Rankin3, Reference Jinadatha, Villamaria and Coppin4
Cleanliness of MPE can be assessed in various ways. Direct observations, a subjective evaluation, lack the ability to detect gross contamination. Fluorescent markers are widely reported in the literature,Reference Boyce, Havill, Havill, Mangione, Dumigan and Moore5 but they have variable reliability and success. Environmental cultures are both resource and time intensive. Adenosine triphosphate (ATP) bioluminescence assays measure effectiveness of cleaning by detecting organic material on a surface in real time. These assays are used for quality assurance after terminal patient room cleans and have been shown to be effective.Reference Boyce, Havill, Dumigan, Golebiewski, Balogun and Rizvani6–Reference Smith, Beam and Sayles8 However, research about the implementation of cleaning and disinfection programs for MPE utilizing ATP technology is limited. The goal of this study was to use the ATP bioluminescence assay to evaluate the cleanliness of inpatient MPE.
Methods
Study design and setting
This study was a cross-sectional evaluation of ATP bioluminescence on MPE, both before and after an intervention to improve the cleanliness of MPE at a 525-bed public safety net and teaching hospital. The study period was June 2015 through January 2018, with stepwise implementation on different units. The data were divided into 3 periods: baseline (month 0), implementation (months 1–6), and maintenance (months 7–12). The MPE was identified on acute-care floors and emergency department and included vitals machines (ie, blood pressure cuff, pulse oximeter, and thermometer), ultrasound machines, bladder scanners, and interpreter phones. Following the baseline period, education materials were developed for cleaning the MPE.
Data acquisition
Baseline cleanliness was measured by obtaining ATP samples from 5–15 pieces of MPE at random times from each of the 8 acute-care floors and the ED. Weekly ATP sampling was performed using premoistened ATP swabs according to the manufacturer’s instructions (3M Clean Trace NG Luminometer, 3M, St Paul, MN). According to the manufacturer’s instructions, a surface with >250 relative light units (RLU) was considered “dirty” and ≤250 RLU was considered “clean.”Reference Boyce, Havill, Dumigan, Golebiewski, Balogun and Rizvani6
In total, 3 ATP swabs were individually collected on a single vitals machine (blood pressure cuff, thermometer, and pulse oximeter), and 1 ATP swab was collected on high-touch areas of an additional piece of equipment (ie, bladder scanner, ultrasound, or interpreter phone). The ATP results were sent to nurse educators and managers weekly with machine identity, time of measurement, RLU value, and pass–fail status. Nurse leadership provided data to all staff regularly, with ongoing education. After a 6-month period of weekly measurements and feedback (implementation period), the ATP results were collected biweekly for an additional 6 months (maintenance period).
Data analysis
The median and interquartile range (IQR) was determined from the RLU for each piece of MPE for each period. A pairwise comparison of median using the Dwass, Steel, Critchlow-Fligner method was used to determine statistical differences among the median RLUs for the baseline, the implementation period, and the maintenance period. Linear regression was performed to determine the trend of the implementation- and maintenance-period ATP results. All analyses were conducted using SAS version 9.3 software (SAS Institute, Cary, NC).
This project was carried out as a quality improvement project and did not meet the definition of research and thus was exempt from the approval of our institutional review board.
Results
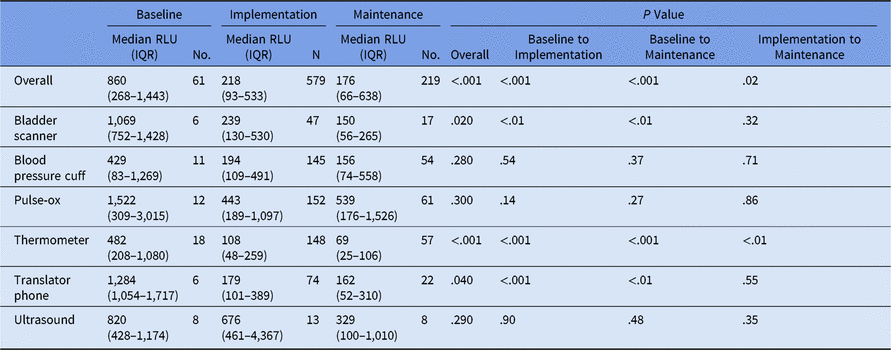
Overall, 61 swabs were collected at the baseline from 6 types of MPE (Table 1). The number of swabs collected per MPE type ranged from 6 (bladder scanner and translator phone) to 18 (thermometer). Overall, the median RLU was 860 (IQR, 256–1,443; n = 61). The highest median RLU was observed on pulse oximeters (median, 1,522; IQR, 309–3015; n = 12), whereas the lowest median RLU was observed on blood pressure cuffs (median, 429; IQR, 83–1,269; n = 11).
Baseline, Implementation and Maintenance Median Relative Light Units for Mobile Patient Equipment

Note. RLU, relative light units; IQR, interquartile range.
Overall, the median RLU in the implementation period decreased 75% from the baseline (median, 218; IQR, 93–533; n = 579; P < .001). The median RLU decreased for each MPE type during implementation period, ranging from an 18% decrease on the ultrasound machine (baseline median, 820; IQR, 428–1,174; n = 8 to implementation median, 676; IQR, 461–4,367; n = 13) to an 86% decrease on the interpreter phone (baseline median, 1,284, 1,054–1,717, n = 6 to implementation median 179; IQR, 101–389; n = 74). Significant decreases in RLU were also observed for bladder scanners (baseline median, 1,069; IQR, 752–1,428; n = 6 to implementation median, 239; IQR, 130–530; n = 47; P < .01) and thermometers (baseline median, 482; IQR, 208–1717; n = 18 to implementation median, 108; IQR, 48–259; n = 148; P < .001).
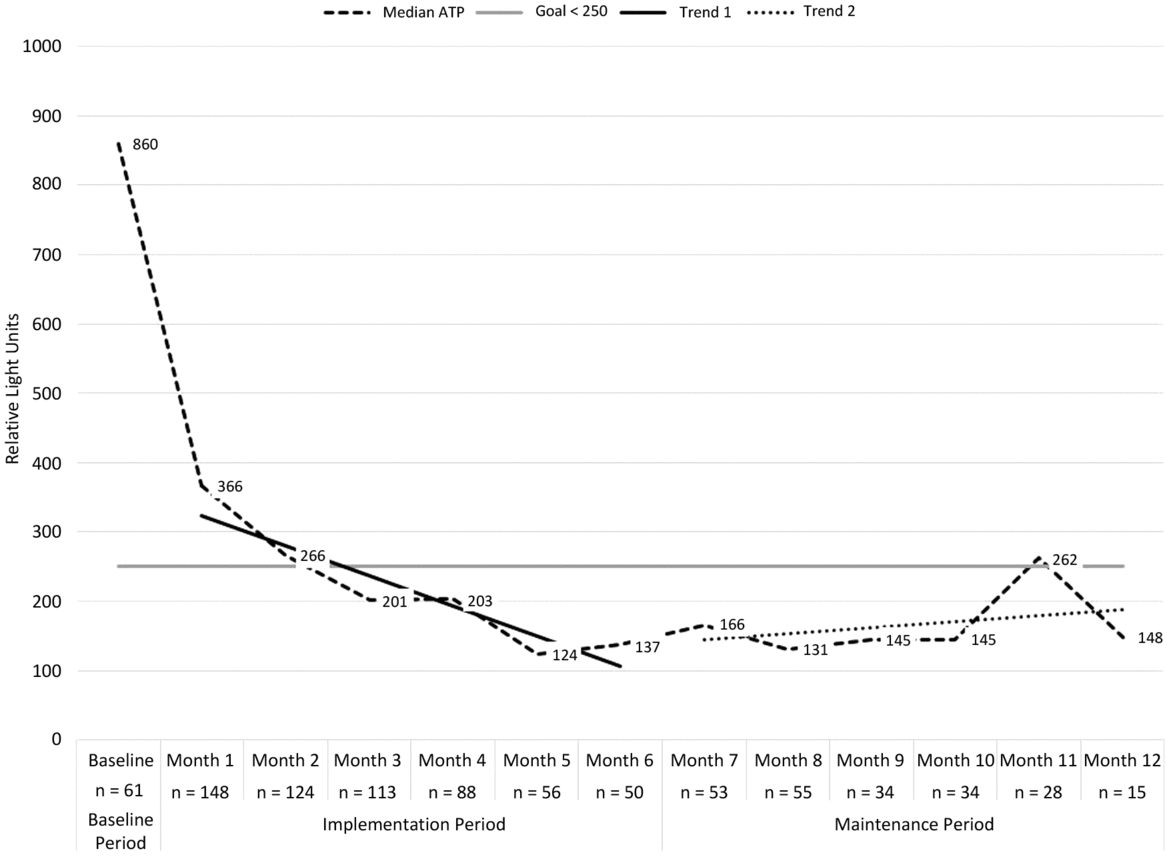
During the maintenance period, 219 swabs were collected for the same MPE types. The median RLU decreased an additional 19% from the implementation period (median, 176; IQR, 66–638; n = 219; P = .02). Performance was either maintained or improved relative to the implementation period for all MPE types. Thermometer median RLU significantly decreased from the baseline (median, 108; IQR, 48–259; n = 148) to implementation (median, 69; IQR, 25–106; n = 57; P < .01). The pulse oximeter had a small, nonsignificant increase from the implementation period (median, 443; IQR, 189–1,097; n = 152) to the maintenance period (median, 539; IQR, 176–1,526; n = 61). Linear regression indicated a significant decreasing trend during the implementation period (−43.4 RLU/month; P = .005) followed by a stable trend in the maintenance period (+8.7 RLU/month; P = .51) (Fig. 1).
Monthly median relative light unit measurements for baseline, implementation, and maintenance periods with trend line. ATP, adenosine triphosphate.

Discussion
With this study, we have demonstrated a successful MPE cleaning program utilizing ATP technology that was sustained in the 6 months following implementation. Following staff education and ATP data feedback, the data suggest that the equipment was cleaned appropriately. Median RLU decreased by 75% from 860 to 176 during the maintenance period. Thermometers and blood pressure cuffs exhibited significantly lower RLU in the maintenance period.
Although most of the equipment and locations demonstrated improvement in overall RLU values, challenges existed with some equipment and locations. For example, pulse-oximeters and ultrasound machines did not exhibit significant improvement in cleanliness throughout the study. We hypothesize that the small area on the pulse oximeter made it difficult to adequately clean, resulting in a higher RLU. The ultrasound was often tested in the ED which demonstrated higher overall RLUs throughout the study. Frota et alReference Frota, Ferreira and Koch9 highlighted similar challenges with consistent cleaning in the ED due to the large number of patients in a high-turnover area.
The study did have some limitations. The baseline period was only 1 month in duration, and the sample size was relatively small (n = 61) and may have misrepresented the overall state of the cleanliness of the MPE. The inclusion of select inpatient units was also a limitation. Although ATP technology has advantages, it has some drawbacks as well. Lack of comparability of ATP monitoring to benchmark methods of fluorescent markers and aerobic colony counts has been documented as well as inability to demonstrate actual pathogens on a surface deemed “dirty” by ATP assessment.Reference Boyce, Havill, Havill, Mangione, Dumigan and Moore5, Reference Knape, Hambraeus and Lytsy7
This study demonstrates a sustainable cleaning program for MPE utilizing ATP technology and feedback. Future directions include evaluating new cleaning techniques for persistently dirty surfaces, broadening the type of equipment that are assessed through ATP, expanding to outpatient settings, and exploring the sustainability in the absence of ATP data feedback.
Acknowledgments
The authors would like to thank the nurses and healthcare technicians at Denver Health Medical Center for their engagement with this cleaning program. The program would not have been successful without them.
Financial support
No financial support was provided relevant to this article.
Conflicts of interest
All authors report no conflicts of interest relevant to this article.