In 2014, when Najya was turning four, her parents faced “our toughest decision since becoming parents”: where should she attend school? She could go to nearby public schools “where all of their classmates … are black and Latino, nearly every student is poor, [and] … the test scores … reflect the marginalization of their students.” The other choice was “the more diverse and economically advantaged magnet schools or gifted-and-talented programs outside our area, or … pay[ing] hefty tuition to progressive but largely white private institutions.” All middle-class parents in Najya’s neighborhood made that choice.
“Integration was transformative for my husband and me,” writes Nikole Hannah-Jones, Najya’s mother. But if her parents enrolled Najya in a predominantly white and presumably less disadvantaged school, “we would be part of the problem” of persistent racial and class segregation that dooms many Black and brown children to inadequate schooling and many white children to grow up in racially exclusive, privileged bubbles. “I was determined not to do what I’d seen so many others do when their values … collided with the reality of where to send their own children to school.” Najya’s father Faraji disagreed; he “believed that our gains were too tenuous to risk putting our child in anything but a top-notch school … . There was no margin for error, and we had to use our relative status to fight to give Najya every advantage” (Hannah-Jones Reference Hannah-Jones2016).
Najya’s parents were not alone in their dilemma. Nonwhite Americans regularly face perplexing decisions about whether to maintain a daily connection with their racial or ethnic group, possibly at the expense of prosperity and mobility, or whether to depart to less Black and brown-centric spaces, possibly loosening social connections with their group in pursuit of other advantages. Many scholars have examined group-based decisions in the political arena, typically framed as unified voting patterns on a mostly national electoral stage. But decisions about where to work, which neighborhood to live in and where to school one’s children, and how to choose local representatives are routine decisions that themselves organize the political world, give individuals direct agency, and shape individual well-being, group connection, and intergroup relations.
Such decisions also may require choices between material outcomes, policy goals, and future prospects, on the one hand, and cultural capital, connection, and group-based resources, on the other. If faced with such tradeoffs, how do Americans of different groups make choices about group unity verses economic or policy advance? Does the decision depend on domain of life, social and economic capital of the chooser, or strength of one’s group attachment? Does it depend on what kind of sacrifices they will accept or aspirations they cherish? And how do they narrate the considerations, values, and constraints that motivate their choice? Despite how obvious these questions are—indeed, readers of these pages may have faced such tradeoffs—and despite how central they are to shaping stratification and structuring patterns of marginality and power, surprisingly few studies have examined people’s behavior when residential, job, or vote choice poses a cost to either personal gain or group connection.
This issue is especially important in our historical moment, when racial and ethnic inequality continue to deeply structure American life and economic fortunes are increasingly divergent both across the population and within groups. Four patterns provide the context for both this historical moment and our study. First, elaborately constructed and fiercely maintained racial and ethnic group boundaries have always shaped and been shaped by governance, markets, and social status in the United States. Second, communal politics and group solidarity are resources that allow subjugated groups to take collective action towards liberation. The third pattern is the rising role of white group identity in political decision-making. Finally, while class differences have always nested within race-based hierarchies, intra-racial class differences have grown more severe in the United States since the 1960s. Against this backdrop, we assess how Americans decide whether or not to maintain connection with their racial ingroup.
Our study relies on a new survey experiment that asks respondents to make decisions about where to live, where to work, and what political candidate to support. The study explores these three domains of life across groups positioned differently by class and by race or ethnicity. We anticipate that higher-educated members of all three groups examined—Blacks, whites, and Latinos—are more likely than those with less education to choose environments with fewer of their racial or ethnic group when personal incentives favor this choice. After developing the theory underlying that anticipation, we examine it in two ways. First, a new analysis of policy preferences in the 2012 American National Election Survey (ANES) sets up our expectation of class-based differences within racial groups on some policy issues. Next, a survey experiment in the 2014 Cooperative Congressional Election Study (CCES) complements and deepens the ANES analysis by focusing on direct choices in everyday life rather than broad policy support, and by introducing tension between remaining with one’s group and pursuing educational, economic, or political benefits outside it. The survey experiment also takes a step beyond the ANES by permitting respondents to explain their choices.
We find that a majority of whites, Blacks, and Latinos prefer their own-group environment, all else equal. But when the quality of the school, compensation, or candidate fit increases in the other-group environment, Blacks and Latinos with higher levels of formal education are more likely than lower-educated counterparts to choose the other-group context. Our findings are consistent with Jason Shelton and Anthony Greene’s observation that, “relying solely on ‘main effects’ differences between Blacks and Whites often conceals significant attitudinal variation between privileged and disadvantaged Blacks” (Shelton and Greene Reference Shelton and Greene2012, 1495). Whites present a different pattern in the survey experiment, since even when there is no tradeoff, higher-educated whites are more likely to choose racially mixed environments than are lower-educated whites.
Although our evidence cannot determine the mechanisms underlying these patterns, we do glean motivations from CCES respondents’ explanations for their choices. Their comments suggest the importance of a sense of efficacy. Blacks and Latinos with more education express expectations of success given an ability to draw on resources and past experiences in complex and fraught heterogeneous settings. They also perceive that descriptive representation is not essential for political or policy success. This explanation is only suggestive given a low sample size, and we urge further investigation of it.
We conclude with reflections on the implications of divergences within groups revealed by our findings. Although some succeed in moving to heterogeneous environments, others who remain in place may suffer from secondary marginalization, isolated ever more from group members and society at large by widening differences of resources, legal status, attitudes, and connections (Cohen Reference Cohen1999). Thus, evidence about Americans’ choices in daily life, policy opinions, and political alternatives provides vital clues to the wrenching political tensions of our time.
Inequality within Racial or Ethnic Groups
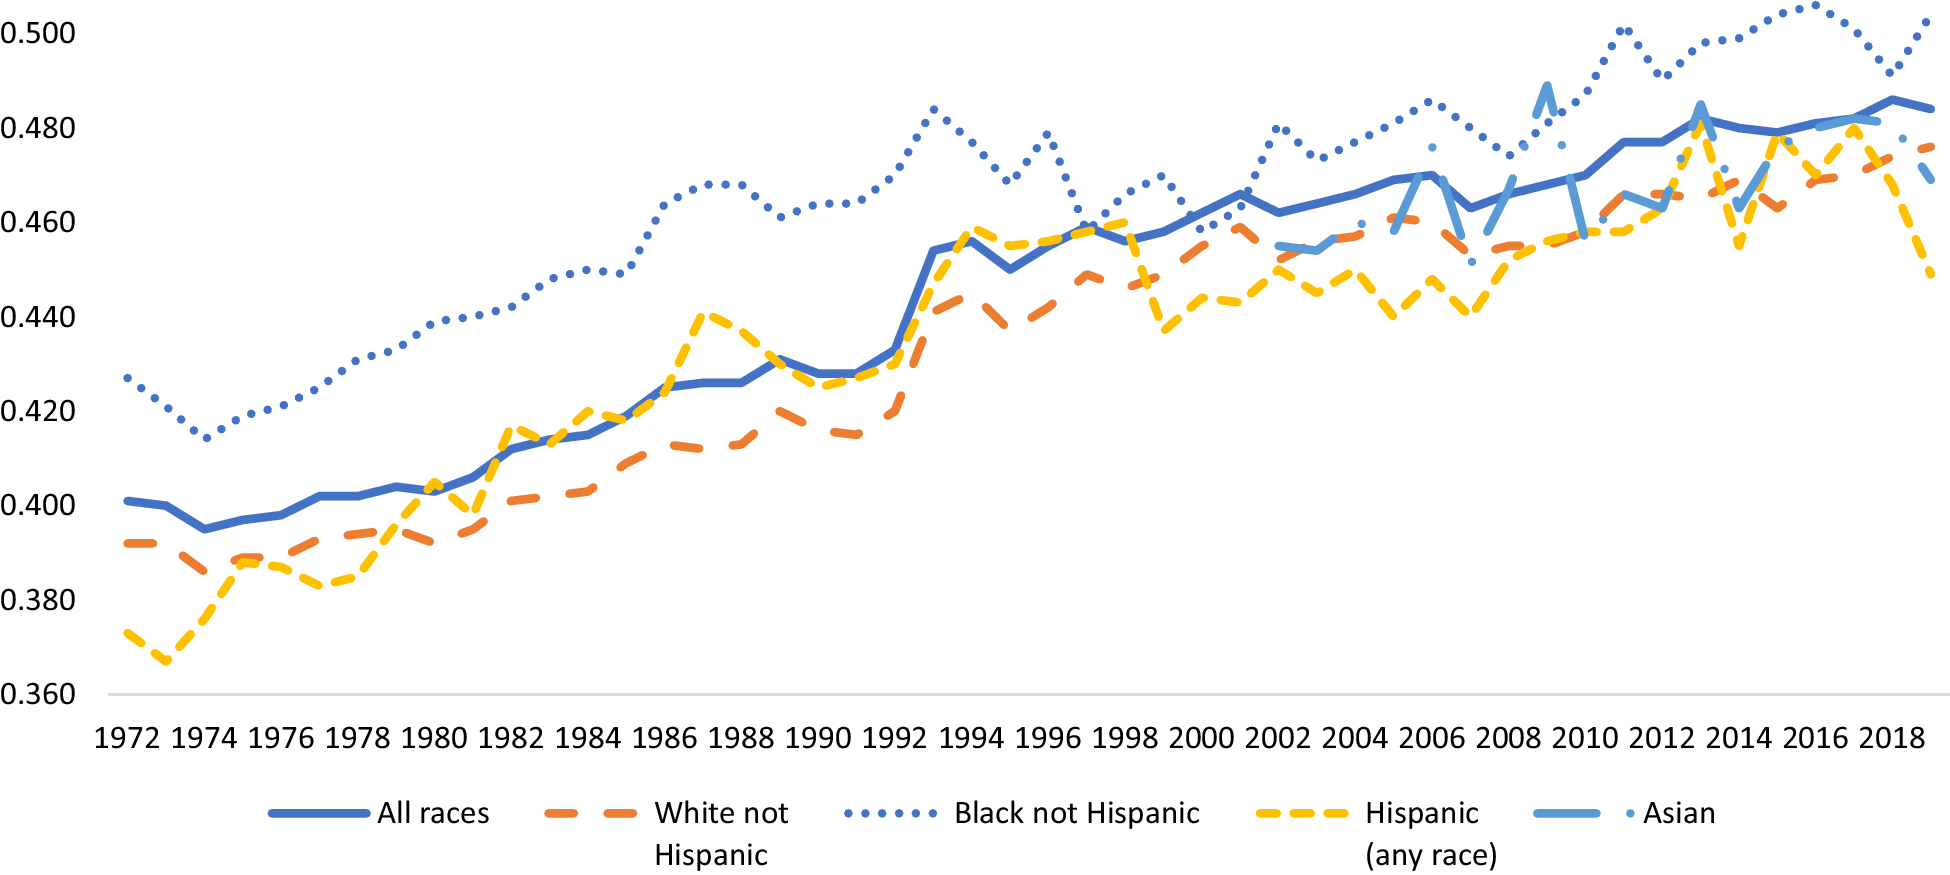
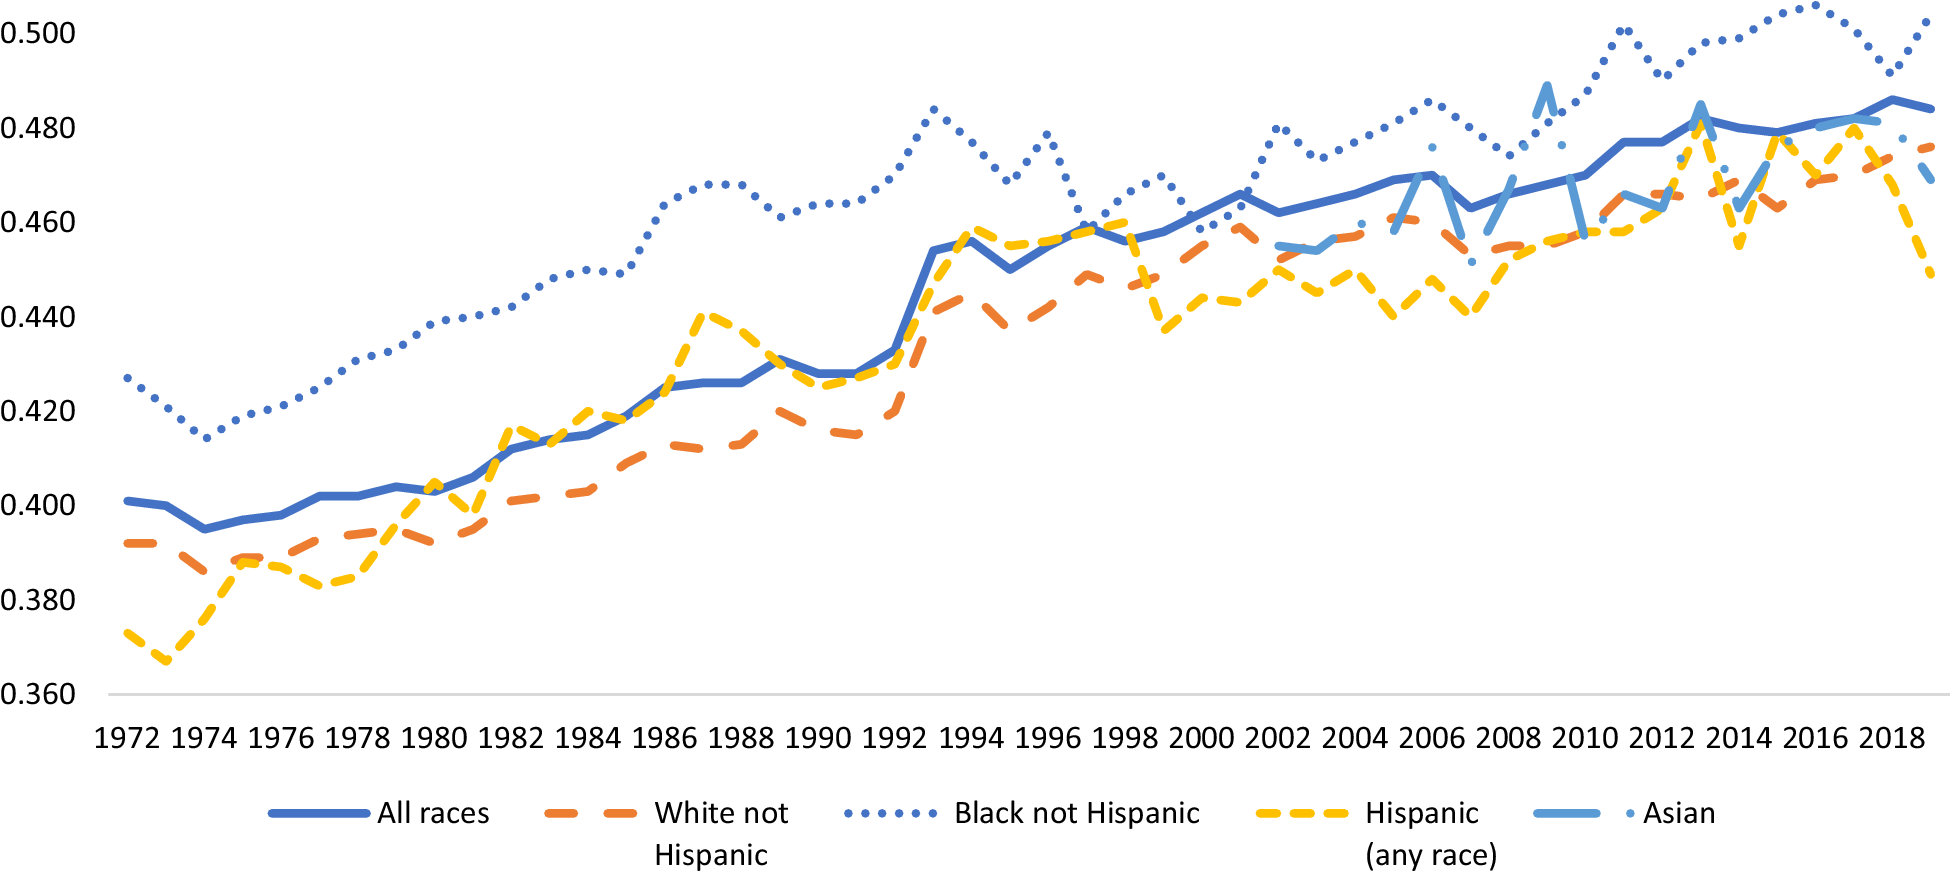
Nested within the overall rise in American inequality is high, and rising, inequality within racial and ethnic groups. Many know that Blacks’ and Latinos’ incomes continue to lag behind those of whites and Asian Americans; what is less well known is greater income inequality within the Black population than in all other groups. Although it is no longer the case, Latinos also showed more intra-group income inequality than whites for the final two decades of the twentieth century. Figure 1 shows these patterns.
Increases in intra-group income inequality: Gini indices, 1972–2019
Source: Bureau of the Census 2020
Measures of wealth likewise show stark differences across races and ethnicities (Oliver and Shapiro Reference Oliver and Shapiro2006; Pew Research Center 2014) along with rising inequality within each group. About twice as many Blacks and one-and-one-half times as many Latinos as whites or Asian Americans have zero or negative net worth; those proportions have changed little since the mid-1990s. However, the proportions of Blacks and Latinos with net worth greater than $100,000 has risen over the same period from less than one-tenth of each group to 25% of Blacks and 29% of Latinos.Footnote 1
Education shows the same pattern: in addition to inter-group disparities, intra-group differences in conventional academic achievement are substantial and widening. National Assessment of Educational Progress [NAEP] tests show the well-known gaps in standardized test scores between Blacks and whites and between those whose parents have high and low levels of schooling attainment. Equally striking but less understood, however, is the fact that within white and (especially) Black sets of 17-year-olds, the disparity in test scores between those with the most- and the least-educated parents was greater in 2012 than it had been in 1978 (math) or 1980 (reading). (That pattern does not hold for Hispanics, for whom the disparity in scores is wide but has not grown over time.)Footnote 2
Clearly, high or rising levels of material and educational inequality within groups can have lifelong and intergenerational impact. How intra-racial inequality may matter for political dynamics in particular is the subject we turn to next.
Racial and Economic Liberalism among Blacks
Racial Policy Liberalism: Two patterns crucial for our purposes emerge from a vibrant debate about sources and consequences of Black political thought and action. The first is persistent racial policy liberalism. Regardless of social class, a majority of Blacks hold strongly liberal views on issues that explicitly focus on Blacks. This pattern has held since at least the 1960s, when reliable survey-based evidence became available. Blacks are much more likely than whites to support affirmative action and descriptive representation, as well as policies to promote equal opportunity, increase Black employment, or combat racial discrimination. Blacks’ opinions have edged in the 2000s from liberalism to more centrist or varied positions, but the well-off are not consistently more conservative on these issues than are their less affluent counterparts (Bobo et al. Reference Bobo, Charles, Krysan, Simmons and Marsden2012; Hochschild, Weaver, and Burch Reference Hochschild, Weaver and Burch2012; White and Laird Reference White and Laird2020).
A great deal of research examines the foundations and implications of racial policy liberalism. The most prominent explanatory theory revolves around the concept of linked fate, which Michael Dawson (Reference Dawson1994) defined as a cognitive heuristic that “explicitly links perceptions of self-interest to perceptions of racial group interests” (76). Given the intensity of racially-based economic and political subordination in the United States, race defines one’s life chances. Thus Blacks’ “group interests have served as a useful proxy for self-interest” regardless of one’s resources, background, or ideological leanings (77; for further consideration see also Harris and McKenzie Reference Harris and McKenzie2015; M. Wilson Reference Wilson2012; Hurwitz, Peffley, and Mondak Reference Hurwitz, Peffley and Mondak2015; Gay, Hochschild, and White Reference Hochschild2016). Linked fate also conveys “a sense of belonging or conscious loyalty to the group” (Simien Reference Simien2005, 529). It develops as a defensive posture “when a group of people experience discrimination and marginalization” (Vargas, Sanchez, and Valdez Reference Vargas, Sanchez and Valdez2017), but it also provides a cherished identity and valued community (Chong and Rogers Reference Chong, Rogers, Wolbrecht and Hero2004; McClain, et al. Reference McClain, Carew, Wilson and Watts2009; Sanchez and Vargas Reference Sanchez and Vargas2016).
Economic Policy Liberalism: In the second pattern, with regard to issues that do not highlight Blacks’ collective interest, subordinated position, or need for group accountability, Blacks’ attitudes about government social provision do diverge with resources, background, or ideology. Thus, “[survey] results provide qualified support for [William Julius] Wilson’s class polarization thesis” on non-race-specific social policies (Hwang, Fitzpatrick, and Helms Reference Hwang, Fitzpatrick and Helms1998, referring to W.J. Wilson Reference Wilson2012. See also Gilliam and Whitby Reference Gilliam and Whitby1989; Shelton and Wilson Reference Shelton and Wilson2009; Tate Reference Tate2010). Well-off Blacks are less supportive than are poorer Blacks of government social provision, more likely to attribute success or failure to individual attributes rather than structural conditions, and more committed to conventional rather than protest politics.Footnote 3 That is, well-off Blacks increasingly distinguish racial policy liberalism from economic or social policy liberalism; disadvantaged Blacks do not.
We replicate these well-supported findings through the 2012 ANES in order to assess their persistence across groups. We then extend these results by fielding an original survey module where respondents focused on concrete choices that would directly affect their lives, rather than focusing on broad policy issues with less clear personal impact and on which they have little direct influence. This innovation gives our survey questions a bite and immediacy that surveys frequently lack. We also extend the reach of these patterns by posing racial and economic policy liberalism independently of one another.
We anticipate that when the choice entails individual benefit and when choices do not directly engage with collective Black interests or political commitments, high-education respondents of color choose environments without strong connections to their racial ingroup more readily than do their low-education counterparts (Harris and McKenzie Reference Harris and McKenzie2015). Our expectation is also consistent with Ismail White and Chryl Laird’s (Reference White and Laird2020) finding that where pursuing self-interest does not threaten the group’s position or reveal defection, differences in political behavior emerge.Footnote 4
Choosing a Shared Racial Group Environment
Black Group Connection: Why might high-status Blacks be more likely than low-status Blacks to choose an environment that is mostly not comprised of their racial group when faced with individual benefits? One possible explanation is that high-status Blacks may already have more experience outside their group; they are more likely to have been educated with, live among, work alongside, and possibly marry people of another race (Lacy Reference Lacy2007; Pattillo Reference Pattillo2013; Robinson Reference Robinson2011). These experiences can be difficult, even painful, given exposure to whites’ discrimination against them (Landry and Marsh Reference Landry and Marsh2011; McGowen Reference McGowen2017), and they need not signal relinquishment of group identity or consciousness. Nonetheless, high-status Blacks with familiarity outside their group may be relatively confident of their ability to pursue interests and goals wherever they lead, connecting with their group as they choose rather than out of perceived necessity.
Correspondingly, it is plausible that a larger share of less-educated Blacks may seek comfort, collective capacity, and social capital by retaining direct group connection as they choose jobs, homes, and political allies. Because they are more likely to have been raised and educated in substantially segregated environments, they may feel less confidence in or familiarity with racially-mixed settings. Furthermore, low-status Blacks may correctly perceive a need for group protection against discrimination and ill treatment, whereas high-status Blacks have more resources with which to deal with mistreatment.
White Group Connection: Evidence shows that whites’ views on government social provision, explanations forpoverty or wealth, and perceptions of opportunity vary consistently with class position: well-off whites tend to hold more conservative views than less well-off whites (Huber and Form Reference Huber and Form1973; Kluegel and Smith Reference Kluegel and Smith1986; McCall and Manza Reference McCall, Manza, Shapiro and Jacobs2011; Shelton Reference Shelton2017; Speer Reference Speer2016). Research on whites remains thin with regard to explicitly group-focused interests, policies, and political representation, but the empirical patterns seem to resemble those of Blacks, if less so. Like Blacks, many whites express a sense of linked fate; 55% did so in the 2012 ANES and 61% in the 2016 Collaborative Multiracial Post-Election Survey [CMPS] (Berry, Ebner, and Cornelius Reference Berry, Ebner and Cornelius2018; see also Knowles and Peng Reference Knowles and Peng2005). After the 2016 election, three-tenths agreed that being white is extremely or very important to their identity, and an additional one-quarter found it moderately important (Jardina Reference Jardina2019). And similar to Blacks,’ whites’ sense of linked fate is associated with a preference for descriptive representation (Schildkraut Reference Scarborough and Holbrook2015). White identity is associated with strong support of federal spending on whites, support for restrictive immigration policy, and endorsement of legacy admissions to selective universities (Jardina Reference Jardina2019; Scarborough and Holbrook Reference Schildkraut2020).
But support for group-specific policies and interests has a different connotation for whites than for Blacks, with regard to both material and normative consequences. Unlike the socially acceptable quality of Blacks’ racial policy liberalism—long seen as necessary for liberation from white domination—a claim of white identity and shared interests arguably violates norms of equality and justice that have arisen since the civil rights era and signal a preference for racial exclusion. White identity, and perceptions of discrimination against whites, are associated with support for political or social conservatism (Knowles et al. Reference Knowles, Lowery, Shulman and Schaumberg2013; Gest Reference Gest2016; Hochschild Reference Hochschild2016), Republican partisanship, and support for Donald Trump (Jardina Reference Jardina2019; Sides, Tesler, and Vavreck 2019)—a very different connotation from Black identity and perceptions of discrimination.
As inequality rises among whites and as cross-racial interaction rises among the well-off in higher education, marriage, and jobs, whites’ strategies for advancement might become less clear. Given America’s history of whites’ subordination of people of color, and whites’ arithmetic majority, the issue of whether to pursue personal gain rather than to remain within their racial ingroup environment has seldom arisen for whites. But as inequality rises within as well as across groups, whites may increasingly face similar dilemmas. Thus our survey experiment poses the same questions to white as to Black and Latino respondents.
Latino Group Connection: The theoretical logic regarding Latinos is complicated in yet a different way. Regarding group-specific policy liberalism, perhaps because of identity with their country of origin or nationality, a smaller share of Latinos than of whites or Blacks express linked fate with their pan-ethnic group in the 2012 ANES (51%), and in the 2016 CMPS (50%) (Berry, Ebner, and Cornelius Reference Berry, Ebner and Cornelius2018). Latinos’ sense of linked fate may also be “a temporary phenomenon,” declining with immigrant generation (Sanchez and Masuoka Reference Sanchez and Masuoka2010). However, Latinos do parallel Blacks in their strong cross-class support for policies that disproportionately affect their group (Affigne, Hu-DeHart, and Orr Reference Affigne, Hu-DeHart and Orr2014; Fraga et al. Reference Fraga, Garcia, Hero, Jones-Correa, Martinez-Ebers and Segura2012; Rhodes, Schaffner, and McElwee Reference Rhodes, Schaffner and McElwee2017). And where it does exist, group identity or connection operates similarly for Latinos as for Blacks and whites; it is associated with increased political participation (Gutierrez et al. Reference Gutierrez, Ocampo, Barreto and Seguro2019; Valdez Reference Valdez2011); increased perceptions of discrimination (Marsh and Ramírez Reference Marsh and Ramírez2019; Stokes Reference Stokes2003); and preference for descriptive representation (Wallace Reference Wallace2013).
Regarding economic and social policy, well-off Latinos resemble whites in being more likely than poorer Latinos to pursue individual interests. Most dramatically, some of the most affluent, well-educated, or assimilated (and disproportionately intermarried) remove themselves from the ethnic category over time, presumably “becoming” white (Alba and Islam Reference Alba and Islam2009; Duncan and Trejo Reference Duncan, Trejo, Leal and Trejo2010). This makes class analysis difficult, of course, but also suggests that well-off Latinos, even if they remain identified with the group, are relatively more conservative or individualist than are those with lower status or less income (Alba, Jiménez, and Marrow Reference Alba, Jiménez and Marrow2014; Fraga, et al. Reference Fraga, Garcia, Hero, Jones-Correa, Martinez-Ebers and Segura2012; Rhodes, Schaffner, and McElwee Reference Rhodes, Schaffner and McElwee2017). Therefore, we again anticipate that when group connection is directly juxtaposed against individual benefit or policy preferences, high-status Latinos are more likely than those with fewer resources to choose the latter.
Methods
ANES: We begin the empirical analyses by examining whether Blacks and Latinos persist in their cross-class commitment to racial policy liberalism while exhibiting class divergence on economic policy liberalism. If data from 2012 show the same patterns as in earlier years, we have a strong platform for the next analysis of how people of color choose when group connection is posed against personal or political benefit.
We rely on data from the 2012 ANES time series survey of adult U.S. citizens. This dataset includes large oversamples of Black and Latino respondents (including Spanish-language interviews). In all, 3,509 non-Hispanic whites, 1,021 non-Hispanic Blacks, and 1,009 Latino individuals were interviewed.Footnote 5 The ANES uses address-based sampling and includes weights for national representativeness, which we use in all analyses here (refer to online appendix 1 for ANES details, including question wording).
The 2012 ANES contains questions about support for government social provision, and for policies explicitly for Blacks and Latinos. Because it does not include items referring to policies for whites, we also analyze questions from the 2016 ANES that do permit this comparison.Footnote 6 All variables are transformed onto a 0 to 1 scale in order to facilitate interpretation of the ordinary least squares regression coefficients.
CCES: We test our expectation, that higher-educated Americans are more inclined than lower-educated counterparts to choose a predominantly other-race environment when incentivized to do so, through a module in the 2014 CCES. It is a bi-annual survey of a national stratified adult sample including about 50,000 respondents. Half of the items are asked of all respondents, while the rest are modules designed by participating teams.Footnote 7
Our module included 2,251 respondents, including 1,563 non-Hispanic whites, 265 Blacks, and 221 Latinos.Footnote 8 It contained four questions, three with experimental variations. For each question—parallel items about the domains of neighborhoods and schools, jobs, or local political candidates—respondents choose between two options. One option always includes people in the domain (job, school, candidate) who are predominantly of the same race or ethnicity as the respondent. The other option always includes people who are not predominantly of the same race or ethnicity as the respondent, but it varies in the depiction of the quality of the school, job, or candidate.
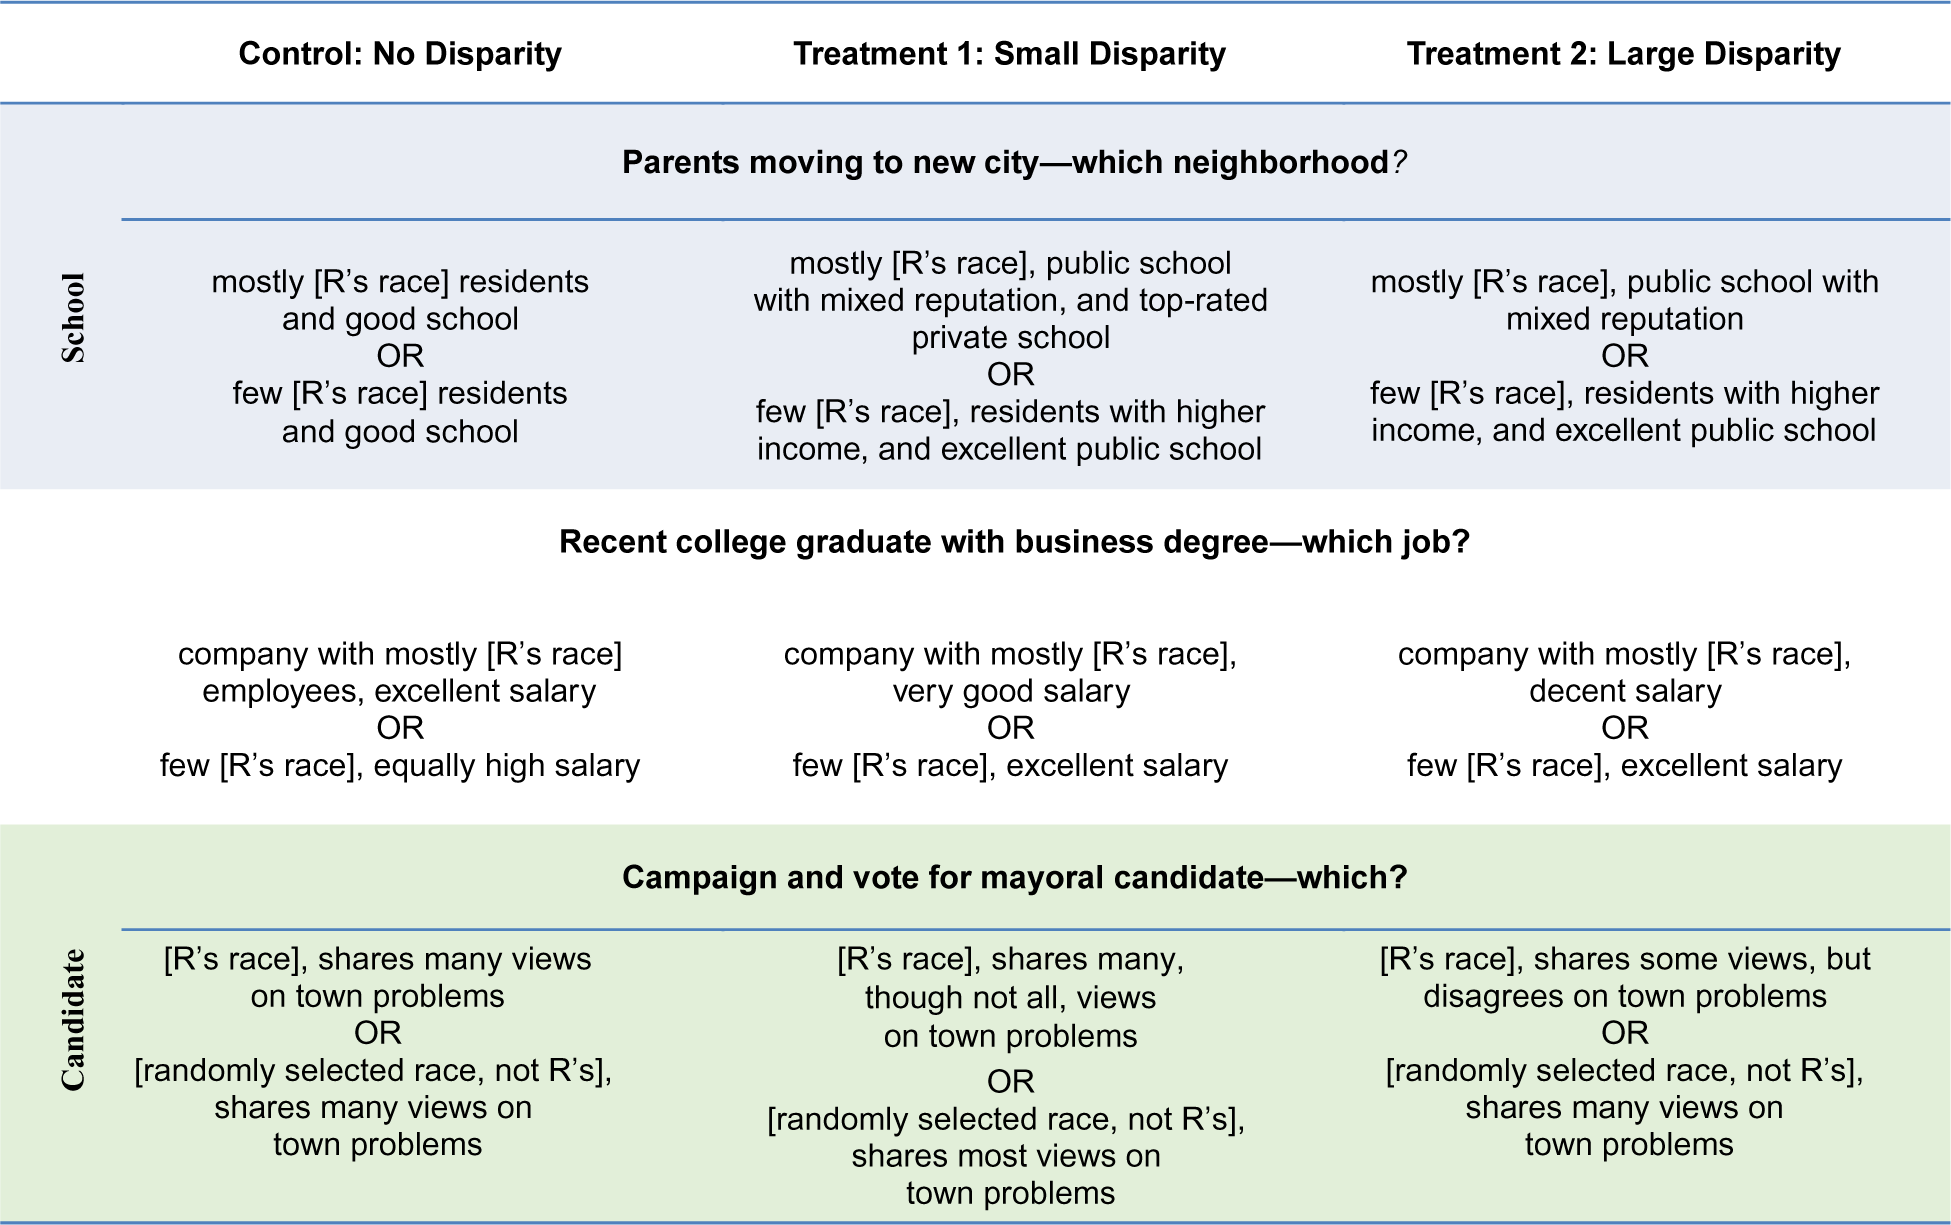
In the Control condition, the quality of the school, job, or mayoral candidate is the same in both options; the only element that varies is whether the people in that domain mostly are or are not of the respondent’s race or ethnicity. In the Small Disparity condition, the school, job, or candidate is of somewhat higher quality in the racially dissimilar option. In the Large Disparity condition, the school, job, or candidate is of considerably higher quality in the racially dissimilar option. In short, in the two Disparity conditions, respondents choose between a racially similar environment or a better school, higher salary, or more compatible mayoral candidate in a racially different environment. Each respondent was asked one question about each domain; whether they received the Control, Small, or Large Disparity item was determined randomly.
Because we sought to vary the level of cross-pressure faced by the respondents, the survey experiment departs from the common design of adding or modifying a phrase within a consistent vignette. Instead, we change the depiction of the school, salary, and candidate in order to increase the gap between the quality of the two options from none in Control to a Small or a Large Disparity. Figure 2 presents an abbreviated version of the survey items. The options in figure 2 as presented to respondents were framed with: 1) “Sophia and Daniel are parents of two children, aged 10 and 4. They are moving to a new city, and need to decide where to live. They could choose a home in a neighborhood with … . Which neighborhood would you choose if you were in Sophia and Daniel’s position?”; 2) “David has just graduated from college with a degree in business. He is deciding between two jobs. One is in a company with … . Which job would you choose if you were in David’s position?”; 3) “Maria is planning to vote for one of two candidates for mayor of her town, and to urge her friends and neighbors to vote for that person also. She is evaluating their values and views in order to decide which candidate to support … . Which candidate would you support if you were Maria?”
Vignettes in CCES survey experiment
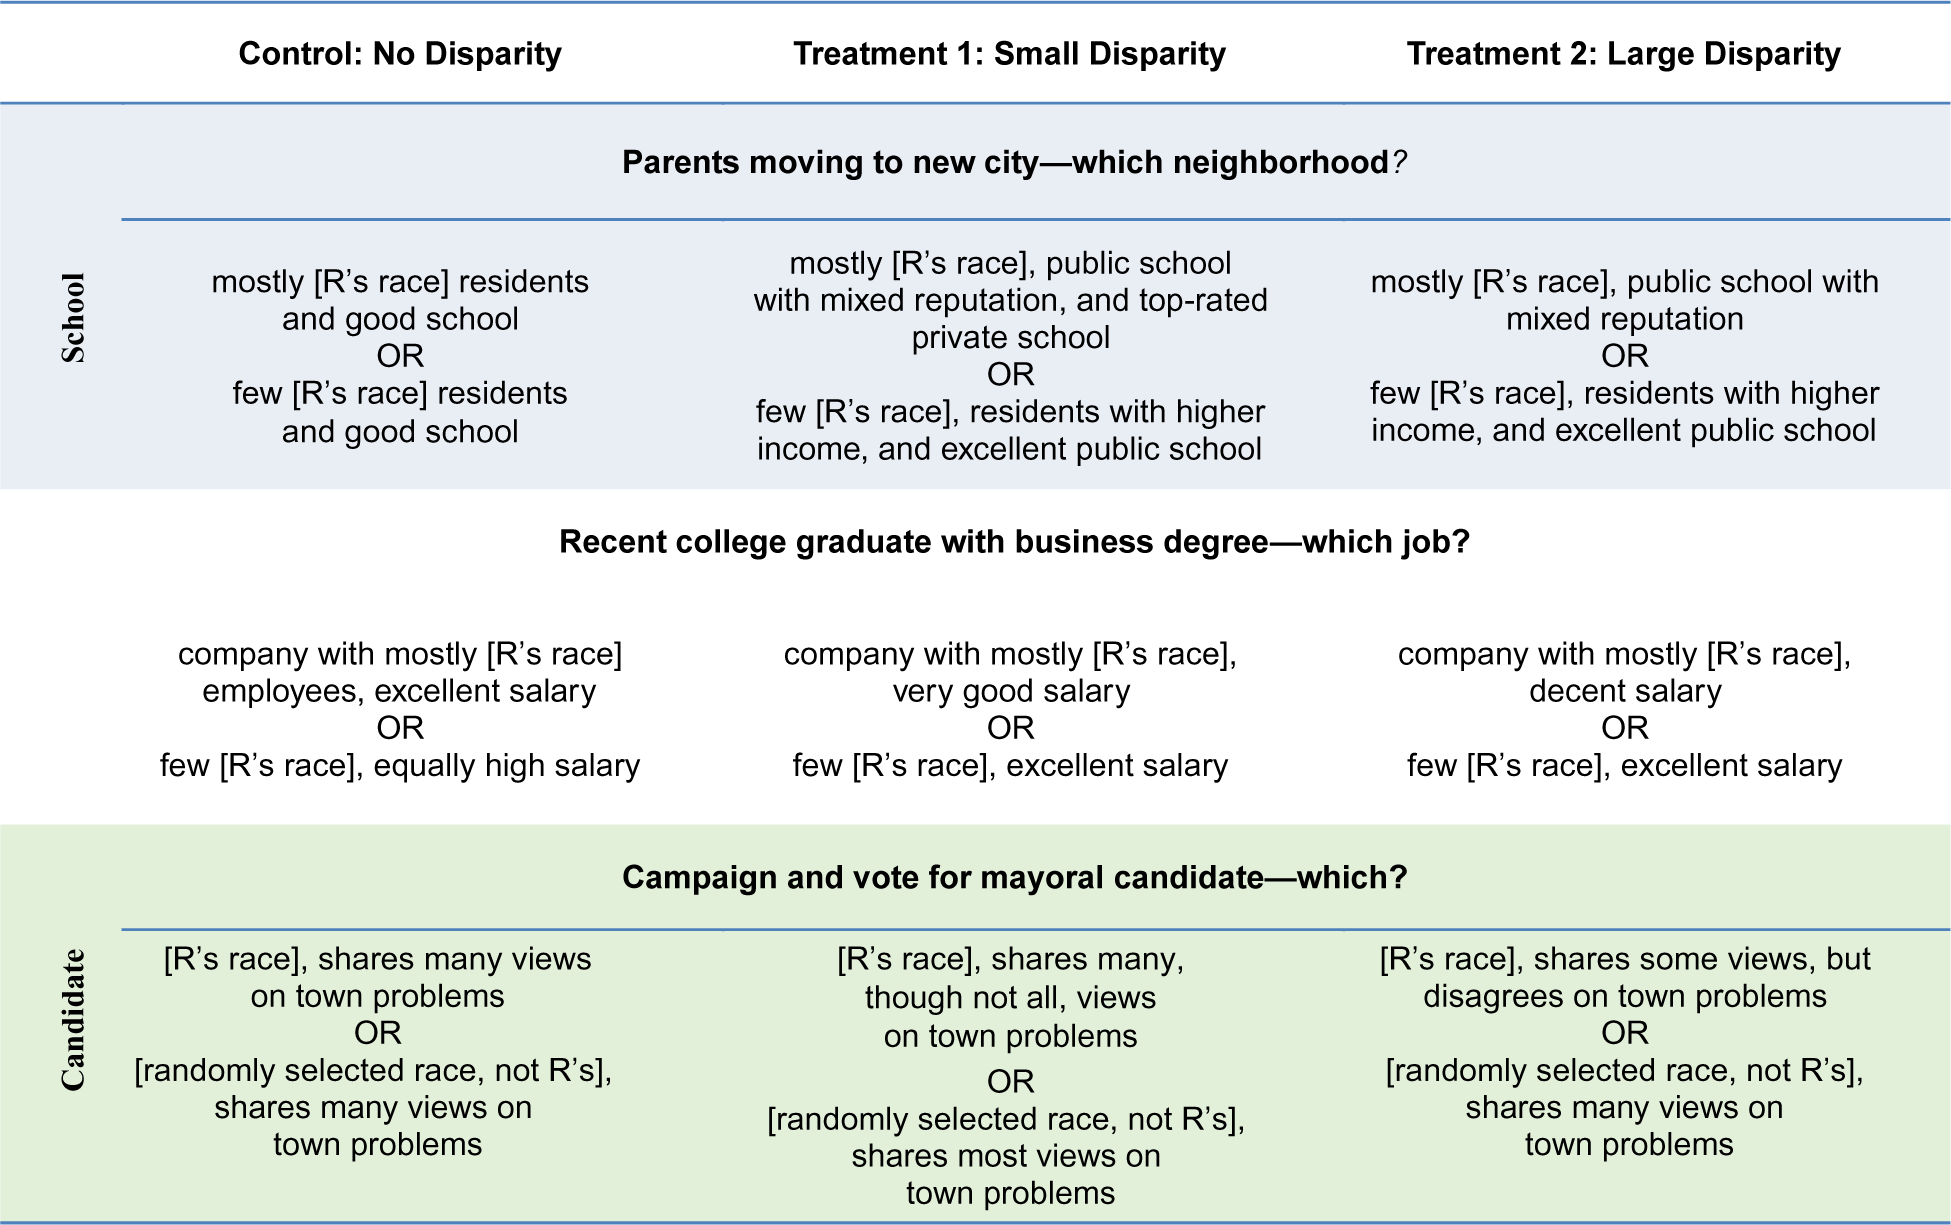
Because each vignette was randomly assigned, a respondent might receive any combination of Control, Small Disparity, and Large Disparity comparisons between the two options across the three vignettes. Online appendix 2 shows the number of responses for each racial or ethnic group in each domain and experimental group.
After picking an option in a given vignette, respondents saw an open text box asking “Why would you make that choice?” This invitation received almost two thousand responses across the three domains; we analyze them later in order to suggest explanatory mechanisms.
Because of a limited sample size, we dichotomize respondents between higher-educated (some college or more) and lower-educated (high school or less). Subsample proportions and sizes are in online appendix 3. The CCES sample includes a disproportionate share of higher-educated Blacks and Latinos, which makes the unweighted sample unrepresentative of the full American population.Footnote 9
Views on Racial and Social Policies: 2012 and 2016 ANES
Do higher- and lower-educated Americans diverge in their support for government social provision in 2012, as whites have for decades and people of color are beginning to do? To answer this question, we conduct an ordinary least squares regression analysis, in which the dependent variable is an index of responses to five questions: whether federal spending should be increased, decreased, or kept about the same on 1) child care, 2) aid to the poor, and 3) welfare, and also whether the government should 4) provide more services, increasing spending to do so, and 5) guarantee jobs and a good standard of living to everyone. We average responses to these questions and transform the resulting scale onto a 0–1 interval, as we do for all other variables in the regression analyses. The index hangs together well (the Cronbach’s alpha of the scale is 0.81; distribution of the scale is in online appendix 4). Whites score lowest (mean = 0.44), Blacks highest (mean = 0.67), and Latinos in the middle (0.57), where higher values correspond to greater levels of support.
The independent variable is education level, with four categories: less than a high school degree (236 whites, 151 Blacks, 193 Latinos); high school graduation (836 whites, 253 Blacks, 282 Latinos); some college (1,107 whites, 386 Blacks, 332 Latinos); and at least college graduation (1,286 whites, 218 Blacks, 190 Latinos). We code education as a series of indicator variables in order to detect possible non-linearities; those who have not graduated from high school are the omitted (baseline) category in the regression analysis.Footnote 10
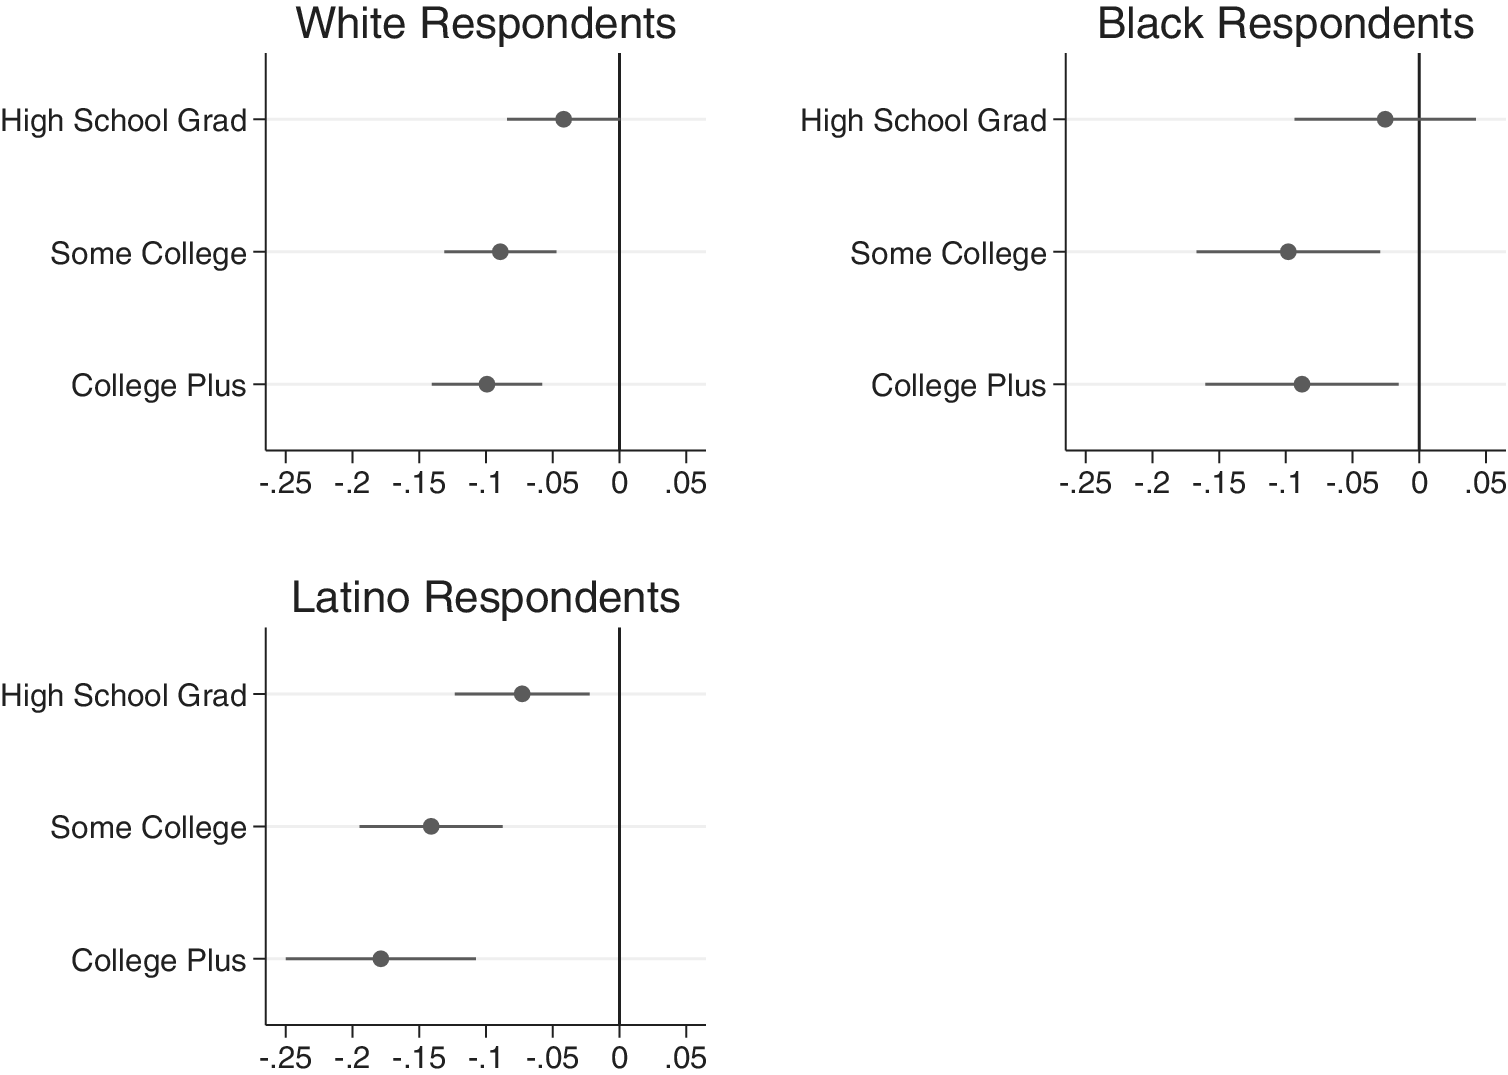
Since our purpose is to assess whether there is an educational divide in policy preferences, not to identify the causal impact of education on these preferences, the analysis in figure 3 includes no control variables. That said, online appendix 5 presents the regression table on which the figure is based, as well as coefficient estimates from a model with and without control variables of partisanship, linked fate, and demographics. As the appendix shows, the results are substantively equivalent with control variables included and regardless of whether only the face-to-face sample or the Internet sample is used.
Level of education and support for government social provision, ANES 2012
Notes: This graph plots unstandardized ordinary least squares coefficient estimates with 95% confidence intervals. Values represent the relationship between education and support for government social provision (see the question wording in online appendix 1). The omitted category is “less than a high school education.” N=3463 whites; 1006 Blacks; 996 Latinos.
Source: 2012 ANES
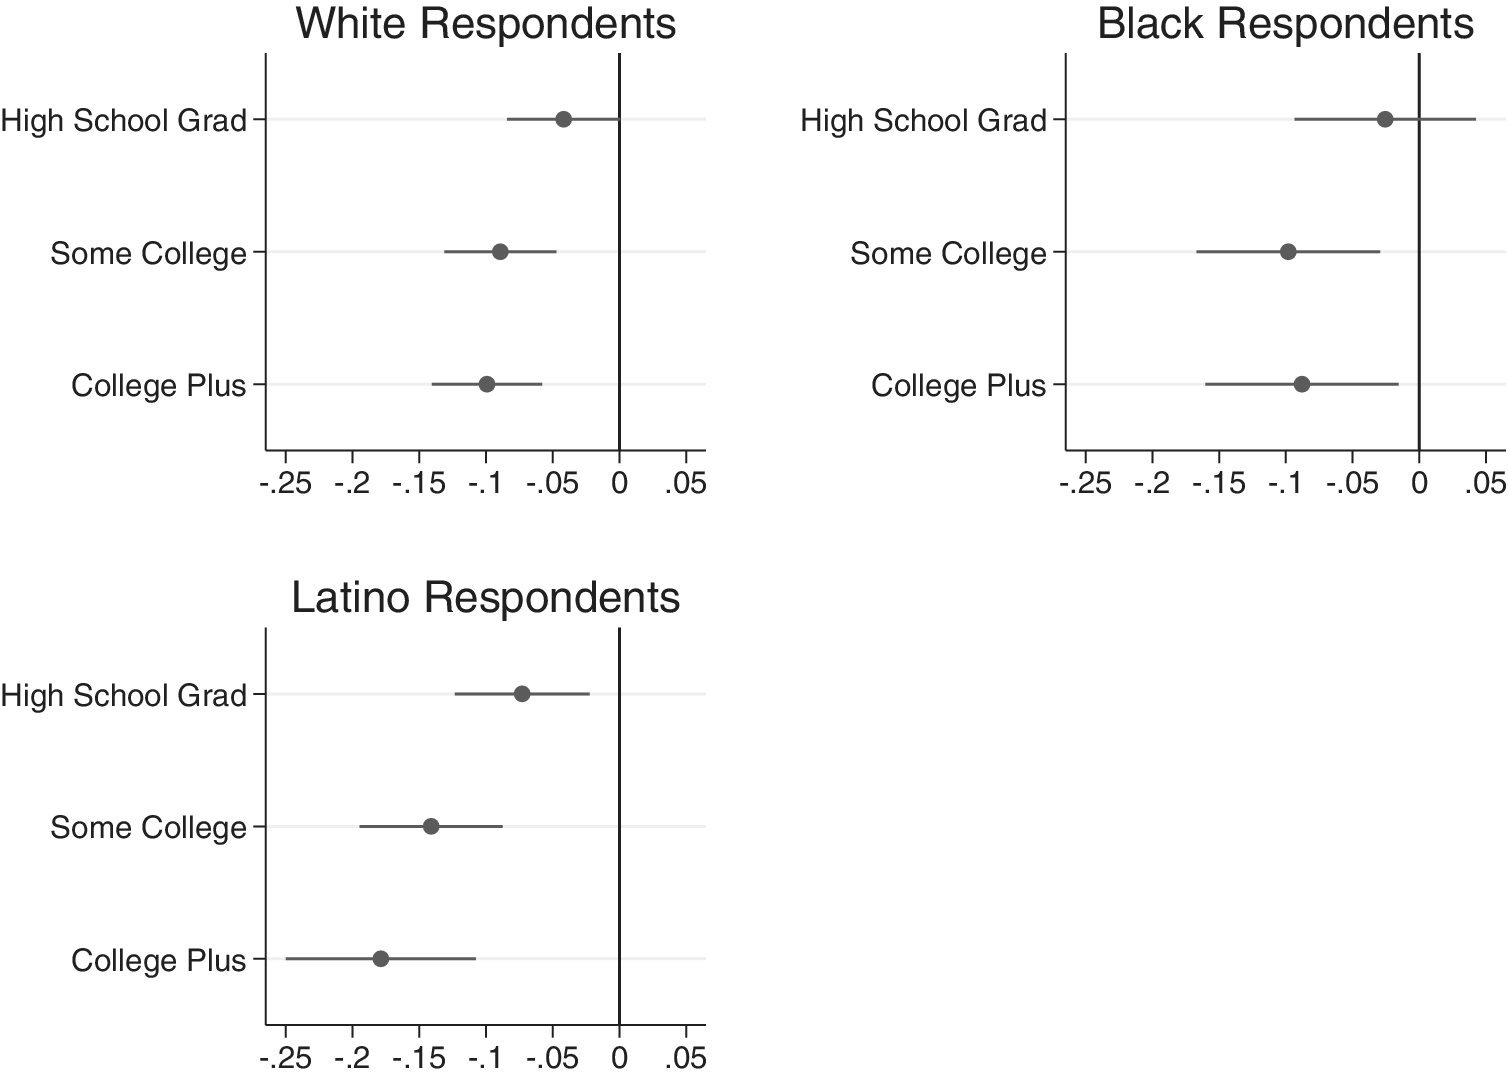
Figure 3 shows statistically significant and substantively meaningful educational differences in opinion about government social provision. Among whites, Blacks, and Latinos alike, higher-educated individuals on average are less supportive of government intervention than lower-educated individuals. The magnitude of these associations can be interpreted from the figure, since the dependent variable is coded from 0 to 1. For example, college-educated respondents score lower than do those without a high school education by between 9% and 18% of the social provision opinion scale. Even with controls included (refer to online appendix 5), the association between education and opinion about social policy provision endures. Analyses with income used in place of education yield similar results (refer to online appendix 6).
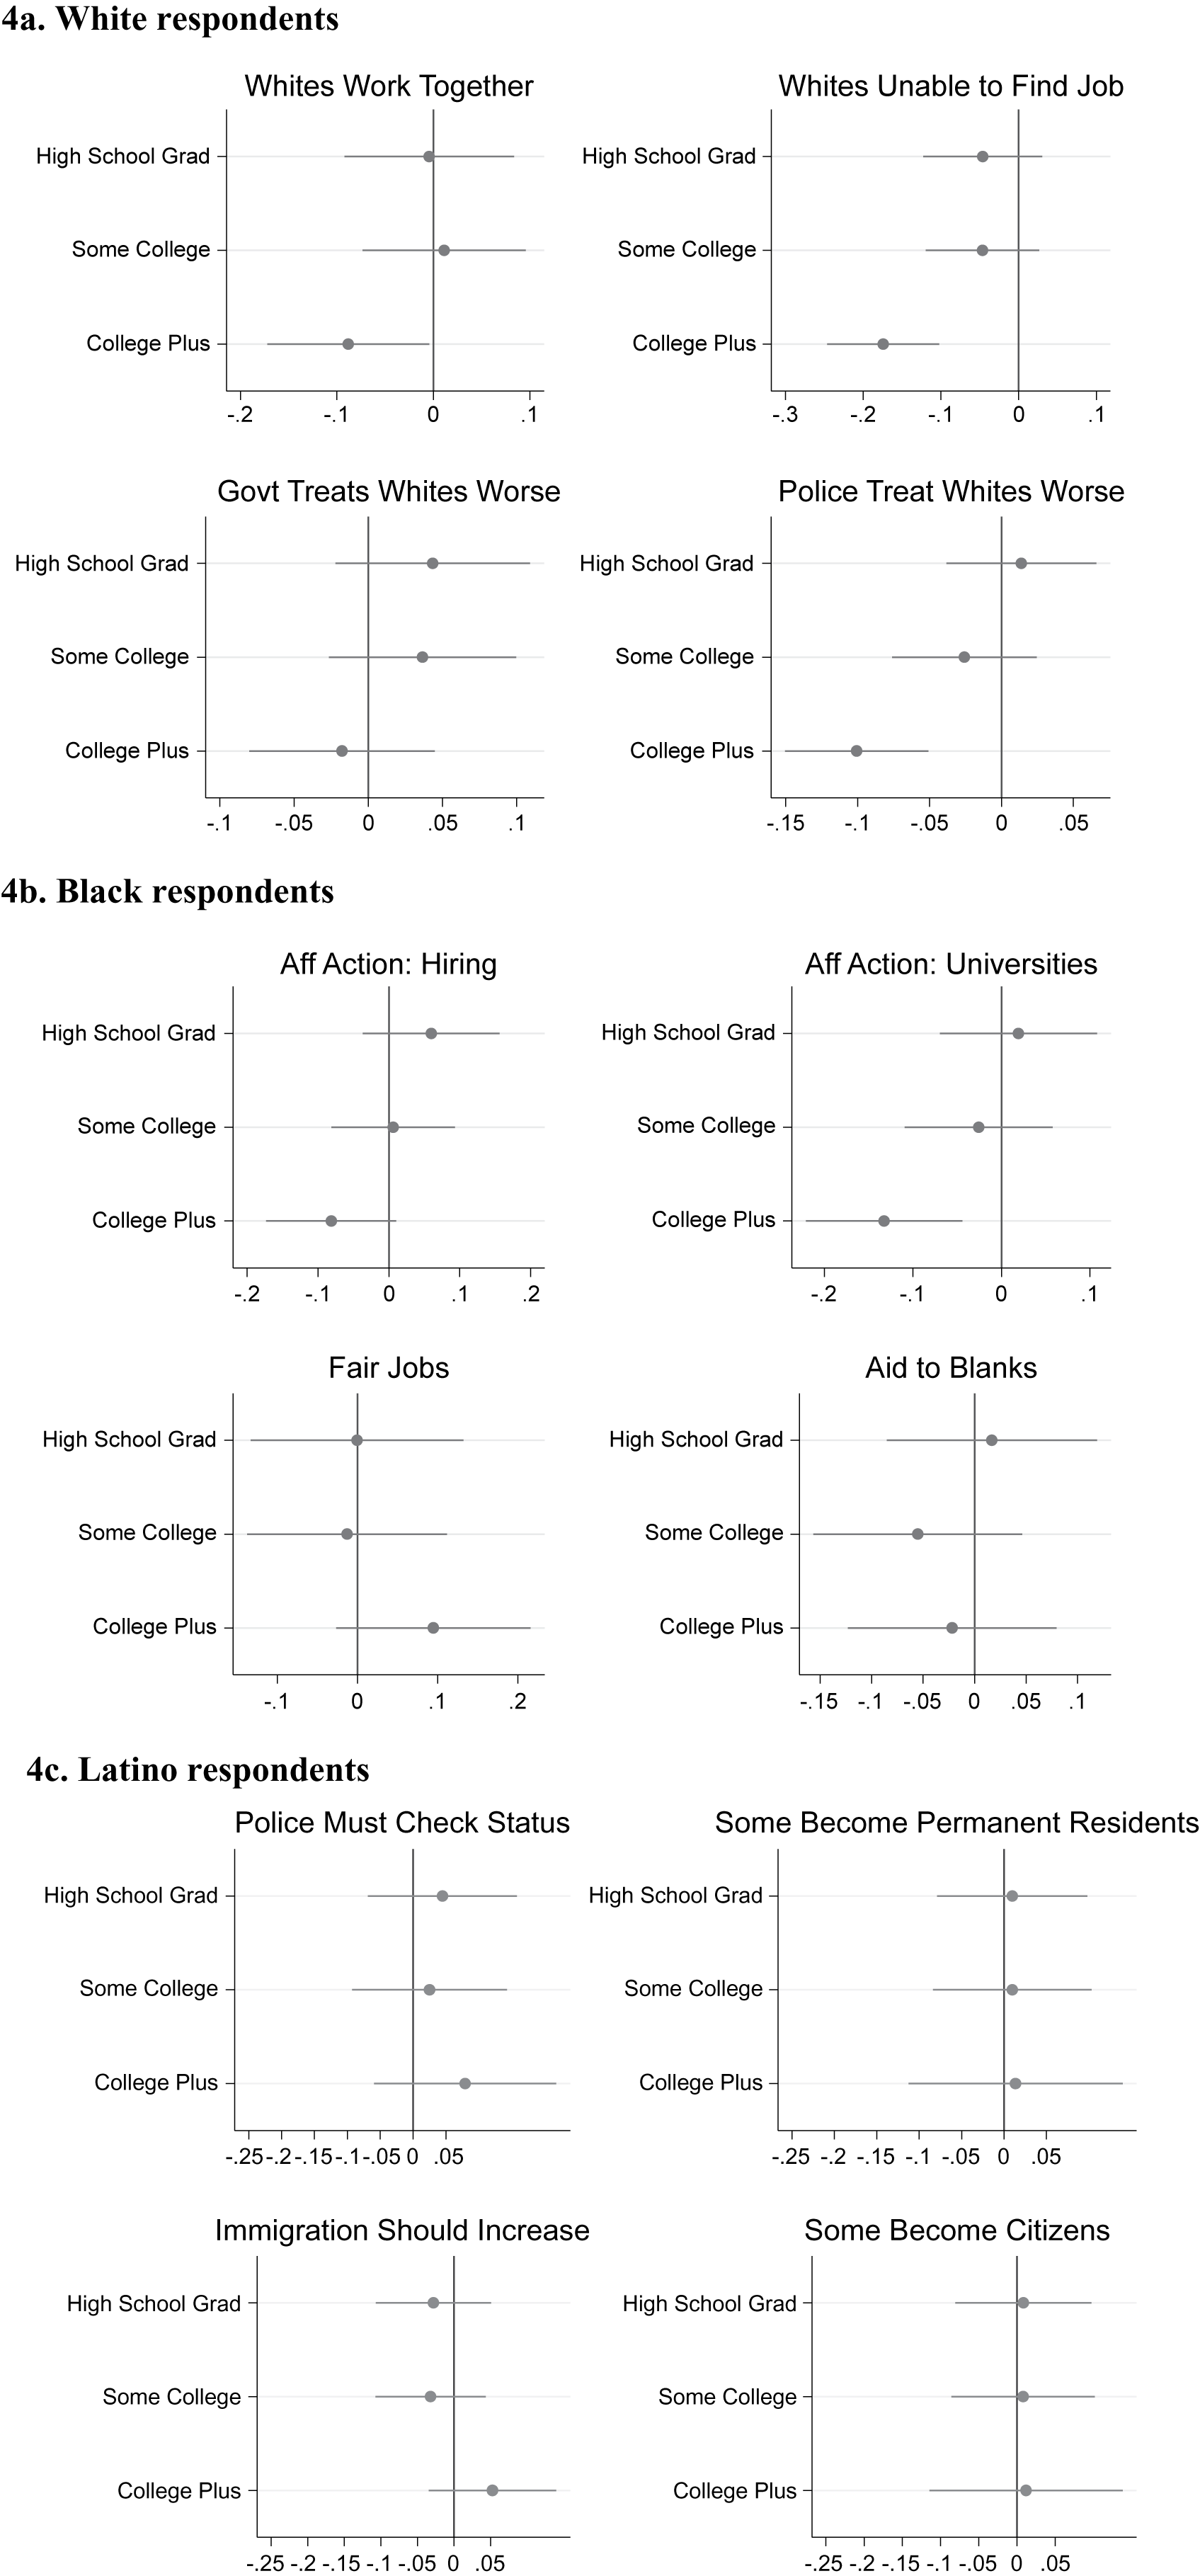
This pattern on social policy liberalism contrasts starkly with opinion about explicitly race-conscious policies. We conduct similar analyses to those presented in the previous figure, except the dependent variable now includes survey questions about race-based government intervention. Figure 4 presents the results.
Level of education and opinion about group-specific issues, ANES 2012 and 2016
Notes: The graphs in figures 4a, 4b, and 4c plot unstandardized ordinary least squares coefficient estimates with 95% confidence intervals. Values represent the relationship between education and opinion about issues specifically mentioning white people in figure 4a, Black people in figure 4b, and immigrants in figure 4c. (See the question wording in online appendix 1). The omitted category is “less than a high school education.”
Source: 2016 ANES for whites, and 2012 ANES for Blacks and Latinos.
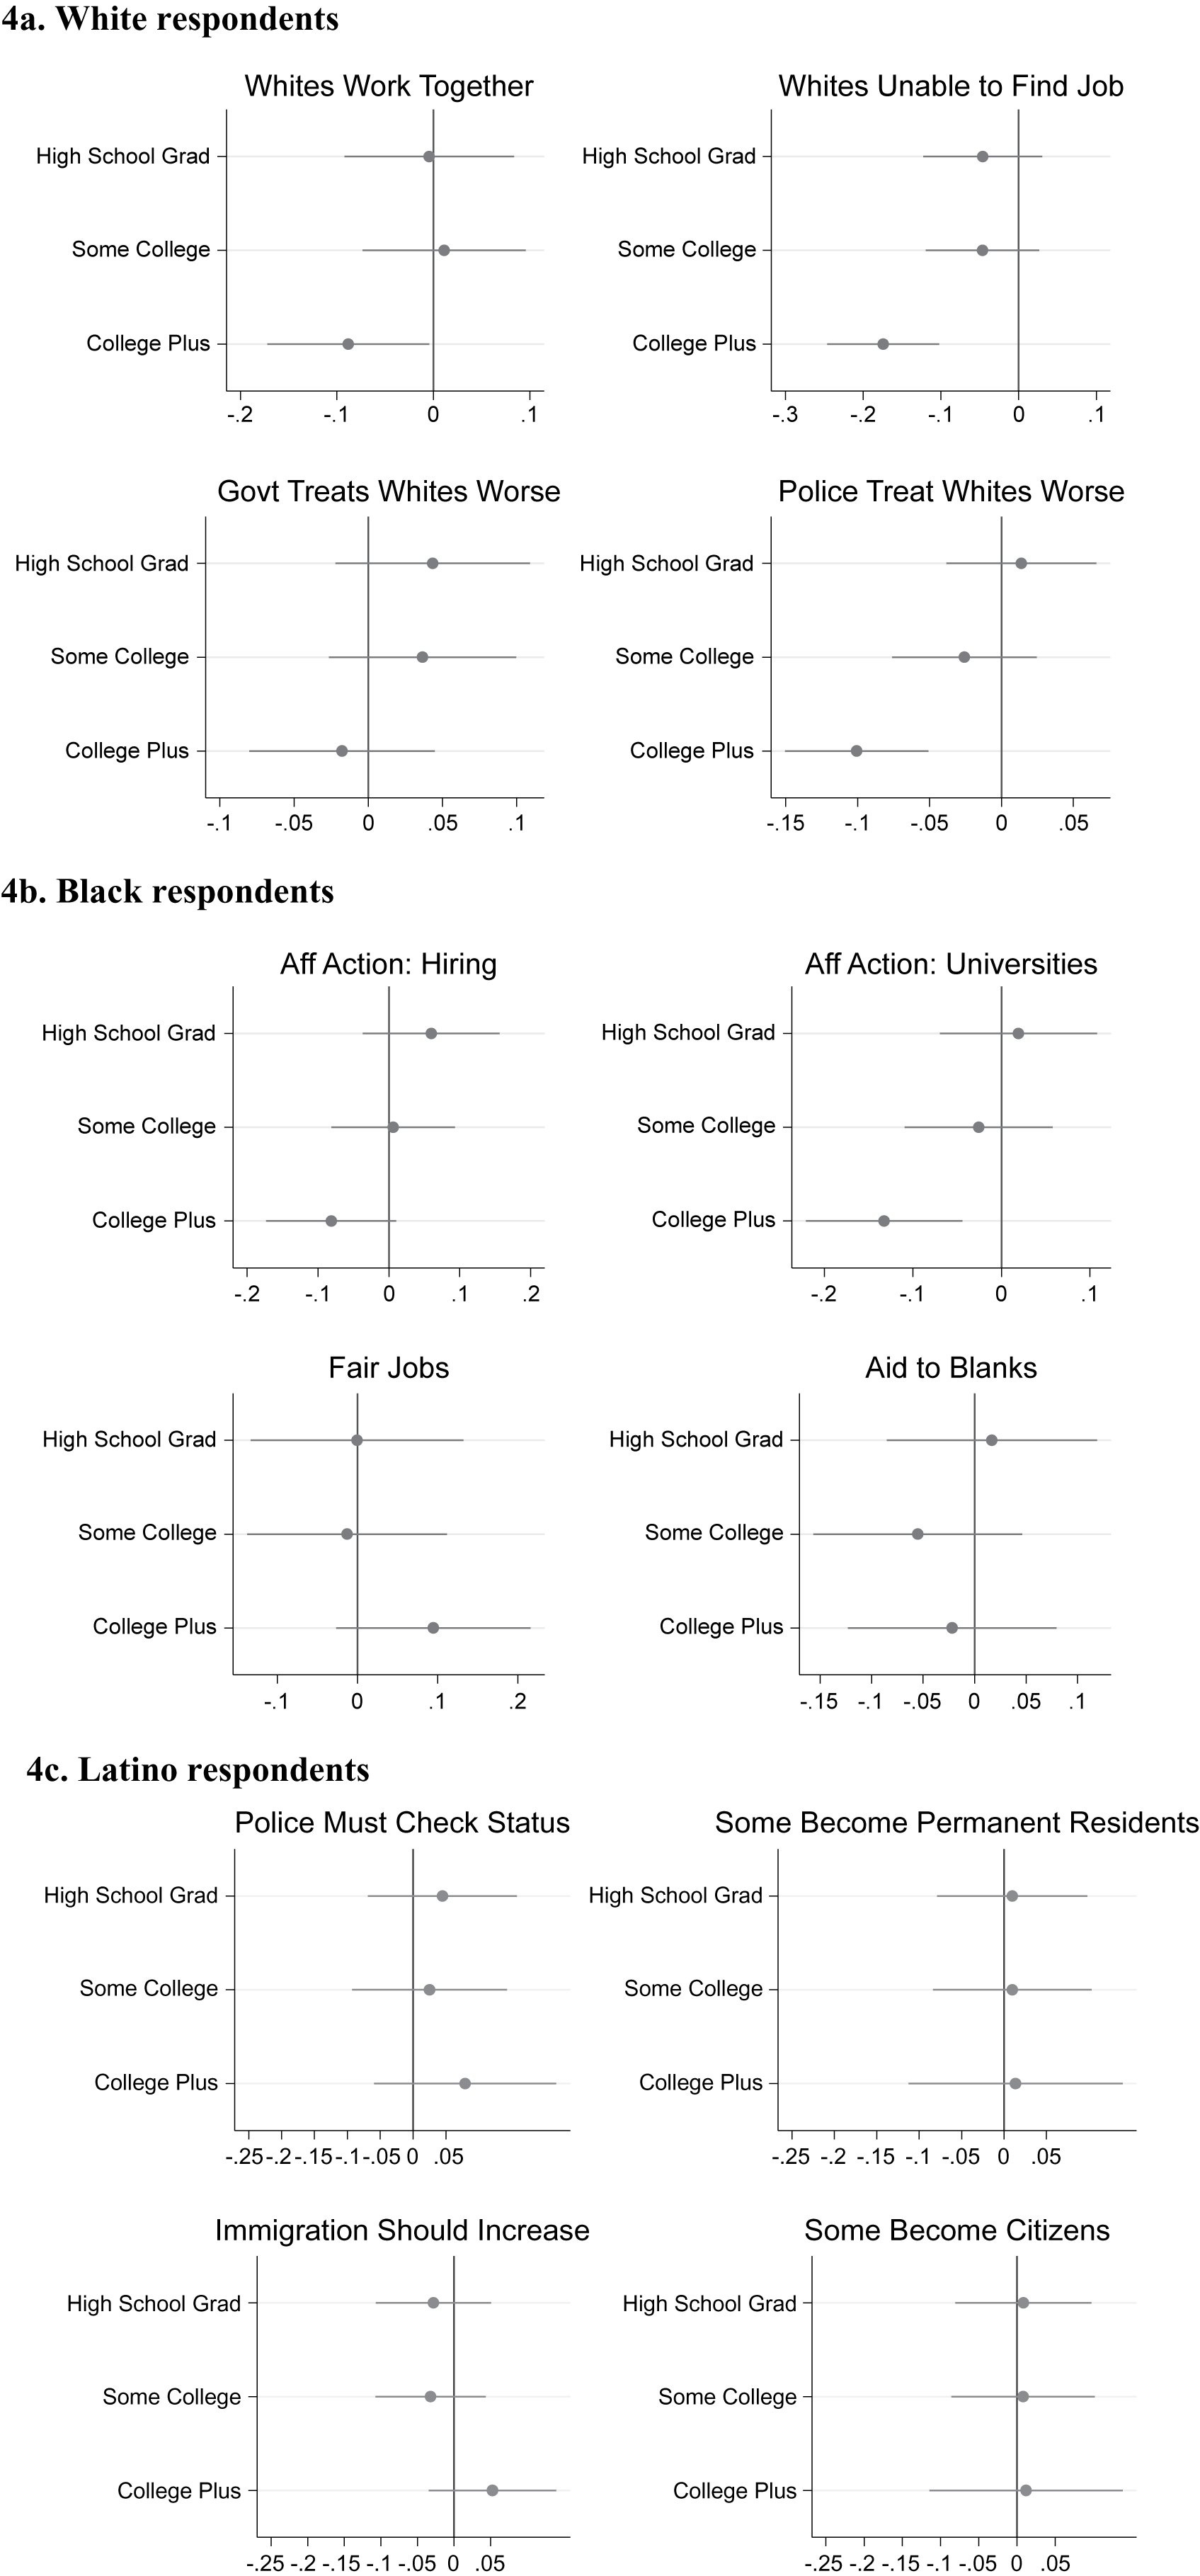
For white respondents (figure 4a), we analyze four questions from the 2016 ANES: the importance of whites working together to change laws unfair to whites; the likelihood that whites can’t find jobs because employers hire minorities instead; whether the federal government, and separately whether the police, treats whites worse than Blacks. While these do not measure support for race-based policy intervention on behalf of whites, and arguably are tapping racial grievances and white hostility towards people of color, they are the closest ANES equivalents to the items we use for Blacks and Latinos (items that are more about policy correctives for racial inequality and discrimination). Education shows an important association with responses to these questions (figure 4a); white college graduates, on average, express less support than those without a high school degree for the perceptions that whites should work together, that whites are unable to find jobs because of minorities, and that police treat Blacks better than they treat whites.
For Black respondents (figure 4b), we examine four questions from the 2012 ANES: support for affirmative action in 1) hiring, and 2) university admissions; 3) government enforcement of anti-discrimination legislation in hiring; and 4) increased government aid to Blacks. The relationship between education and opinion about these policies among Blacks is generally null (figure 4b). The single exception is that college-educated Black respondents, on average, support affirmative action in university admissions less than those without a high school education.
The story is the same for Latino respondents as for Blacks (figure 4c), although the approach is a bit different. Given the absence of questions that specify Latinos, we rely on questions in the 2012 ANES about immigration. The match is not perfect, since most Latinos are not immigrants and many immigrants are not Latino—but it is plausible, given that immigration has become racialized politically and that many native-born Latinos have immigrant family and friends (Zepeda-Millán Reference Zepeda-Millán2017). The four questions ask whether 1) state laws should require police to check the immigration status of people they suspect to be undocumented; 2) immigrants who enter the country illegally should be able to become permanent residents under certain conditions; 3) whether immigration levels should rise, stay the same, or fall; and 4) whether unauthorized immigrants should be allowed to stay in the United States and eventually become citizens. Once again, we see null relationships between level of education and attitudes—this time with no exceptions.
In sum, although respondents do not differ by level of education in support for group-specific policies, more highly educated Black, white, and Hispanic Americans are all less liberal with regard to social policies or class-based redistribution than are their lower-educated racial counterparts. That hints at, but cannot speak directly to, a more individualistic or conservative orientation among more educated Americans, even among people of color. We turn now to examining that hint more directly.
What Do People Choose? 2014 CCES
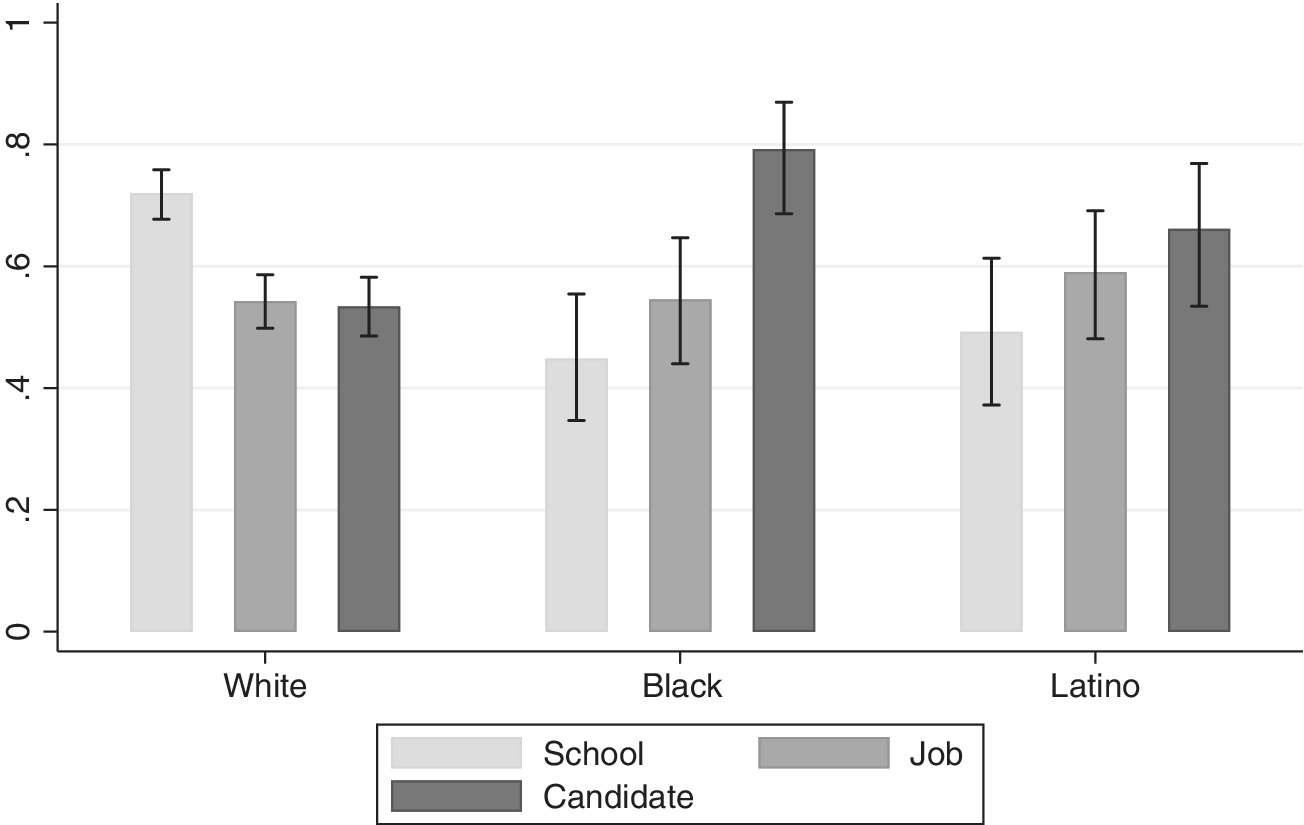
Control Condition: We begin that examination with the distributions of responses to each proffered choice in the CCES survey experiment, by group and domain. Figure 5 shows the distribution of views in the Control condition; the bars indicate the proportion of respondents opting for an environment of their racial or ethnic group in each domain when the only difference between the options is the density of own-group members. A majority of CCES respondents prefer group connection when all else is equal. In seven of the nine sets of responses (three groups * three domains for each), half or more choose a predominantly same-race community, a job with co-workers of their group, or a candidate of the same group as themselves. As one respondent observed, “birds of a feather. If I can work with people like myself why should I go through the aggravation of adapting to cultural conditions not of my preference.” Averaging across domains in the Control condition, whites prefer “birds of a feather” 60% of the time, Blacks 59%, and Latinos 58% of the time.
Proportion choosing own-group option in the Control condition, by racial or ethnic group and domain, CCES 2014
Note: N in each domain= ~470 whites; ~90 Blacks; ~80 Latino [Ns vary slightly by domain]. Results are unweighted.
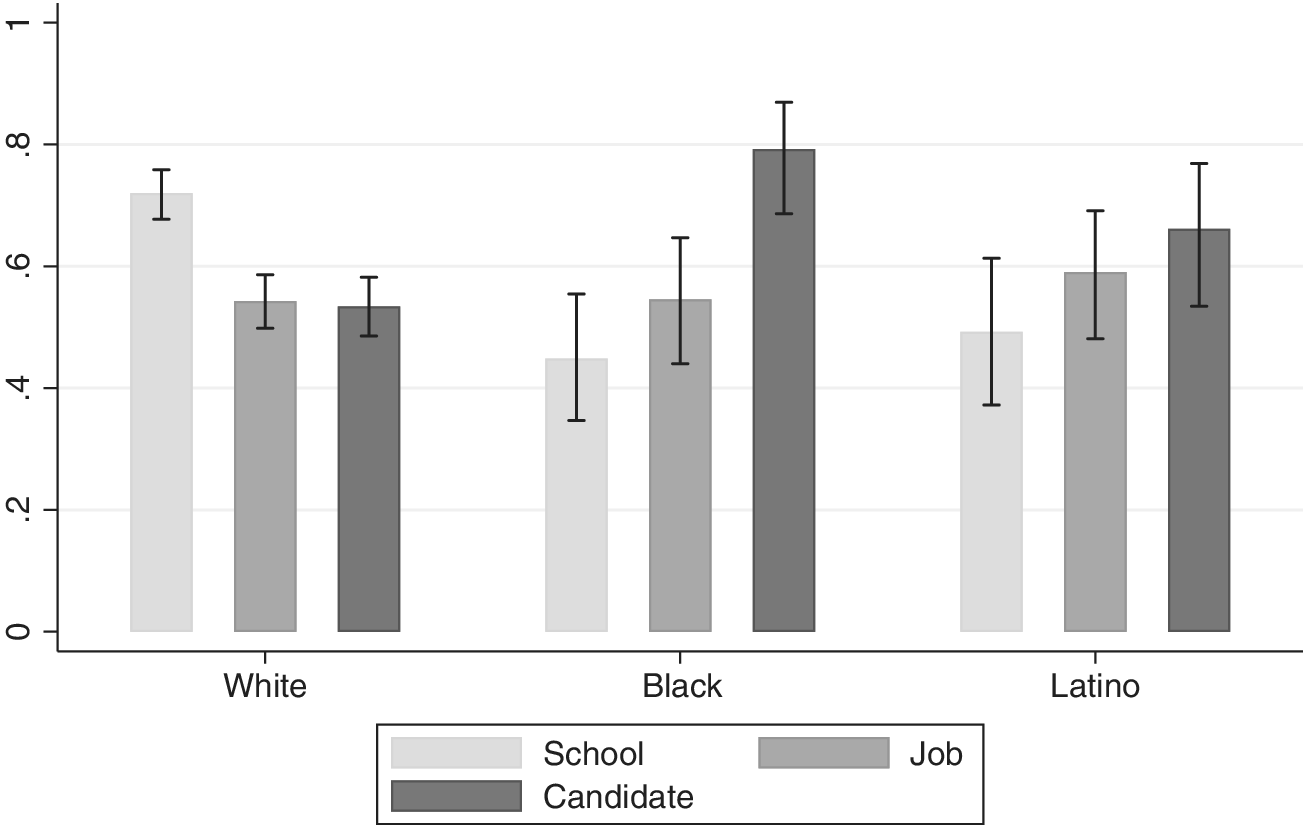
However, the magnitude of that preference varies by domain and respondent’s group. Blacks and Latinos are least likely (43% and 48%), and whites most likely (over 70%), to choose their own group when selecting a neighborhood and school. Conversely, more Blacks and Latinos desire descriptive representation in politics (80% and 65%) than do whites (50%). The groups differ little in job preferences.
Domains: Before moving on to examining our core theoretical concern, variations by level of education, we note the importance of studying this issue across domains of life that are consequential for both group hierarchy and individual life trajectory. Unlike much past work, our survey explores differences across arenas of life that people must navigate daily, that cumulate in racial group positions, and that are rooted in the political economy and history of racial subjugation and protection.
Employment is arguably the most instrumental. People care about their job’s content and their own success, and they value connections with fellow employees—but on balance, people work mostly for income. A 2013 survey of unemployed job seekers over age 50, for example, asked the main reason for seeking employment. Forty percent needed income; 18% wanted a job after being laid off, and another 7% sought a better salary. Six percent or fewer gave non-instrumental reasons (Associated Press-NORC Center for Public Affairs Research 2013; see also ibid. 2012). Given work’s primarily instrumental value, it is unsurprising that most respondents of all three groups choose the higher salary option, even if it entails less group connection during the workday.
Furthermore, Blacks and Latinos have historically struggled against job segregation—being confined to the domestic and physically strenuous jobs characterized as Black or brown has typically meant low wages and mobility, poor work conditions, and subservient relations with employers (Glenn Reference Glenn1992; Nadasen Reference Nadasen2016). Thus, the goal for these Americans is not to stay in a “Black” or “brown” workplace but just the opposite—moving away from a shared racial environment can be understood as advancing the group as well as the self.
In contrast, after identifying a partner and place of worship, choosing one’s neighborhood and children’s school may be more emotionally, morally, and materially important than any other personal selection. As well as instrumental calculations, this choice involves normative, historical, and symbolic considerations that differ by group. Blacks and Latinos have struggled for decades to be able to attend desegregated schools and move into integrated neighborhoods. In addition to the insult of segregation, predominantly white schools on average have more resources, and thus higher test scores, better graduation rates, and less safety deprivation (Hochschild and Scovronick Reference Hochschild and Scovronick2004; Shedd Reference Shedd2015). Similarly, mostly white neighborhoods have on average more resources, with corresponding benefits and amenities.
Thus, for people of color, an environment dominated by their ingroup may be associated with being kept out of white neighborhoods through exclusionary practices, informal discrimination, and white flight. That implies restricted mobility for their children, low property values, high safety deprivation, and low quality public goods. For whites, in contrast, an environment dominated by their ingroup may be associated with the opposite—mobility and resources, high property values, security, public goods, racial exclusion—as well as continued racial comfort. Given this assymetry, it makes sense that in the Control condition, almost three-fourths of whites choose group homogeneity in the neighborhood and school domain, while only about half of Blacks and Latinos do so.
Respondents sometimes make this logic explicit. A white respondent explains her preference for a predominantly white environment on the grounds that “it is natural to choose a neighborhood where you feel you have more in common with others. There are different cultural elements between races,” while a Black respondent who also chooses a predominantly white environment does so “because I believe in giving every child the best opportunity to succeed and improve their future.”
Finally, electoral politics has the fewest direct individual consequences, since links between candidate support and personal gratification depend on the actions of many others; political activism is typically framed as a contribution to the public good rather than a personal benefit. But electoral politics still, of course, has strong racial and ethnic inflections. The decades-long struggle for the right to vote, and then to attain genuine representation—“Black faces in high places”—resonates symbolically and substantively. Thus, it stands to reason that Blacks and Latinos are especially committed to group connection in the Control condition for political candidates; unlike in the jobs and neighborhood domains, minorities’ ability to attain political power and policy congruence may well be through links to their racial ingroup.
Whites, in contrast, have not had to struggle for descriptive and substantive representation since the 1830s for men and 1919 for women. Given the preponderance of white elected officials, most white voters still have the luxury of being able to think in ostensibly non-racial terms about the “best” candidate to fulfill their policy preferences. So most whites need not express strong commitment to descriptive representation in the Control condition for the political domain—and about half do not.
Once again, respondents manifest these analytic points; as white respondents put it, “we elect people to represent us not for their skin color,” or “the race or ethnicity of a candidate is unrelated to their suitability for the office they seek.” Many non-whites concur, but others say: “the Black candidate is assumed to understand/relate to what my concerns and issues are” or “it would make sense to choose the Hispanic or Latina/o because it’s more like to have shared experiences and struggles based on race and ethnicity.”
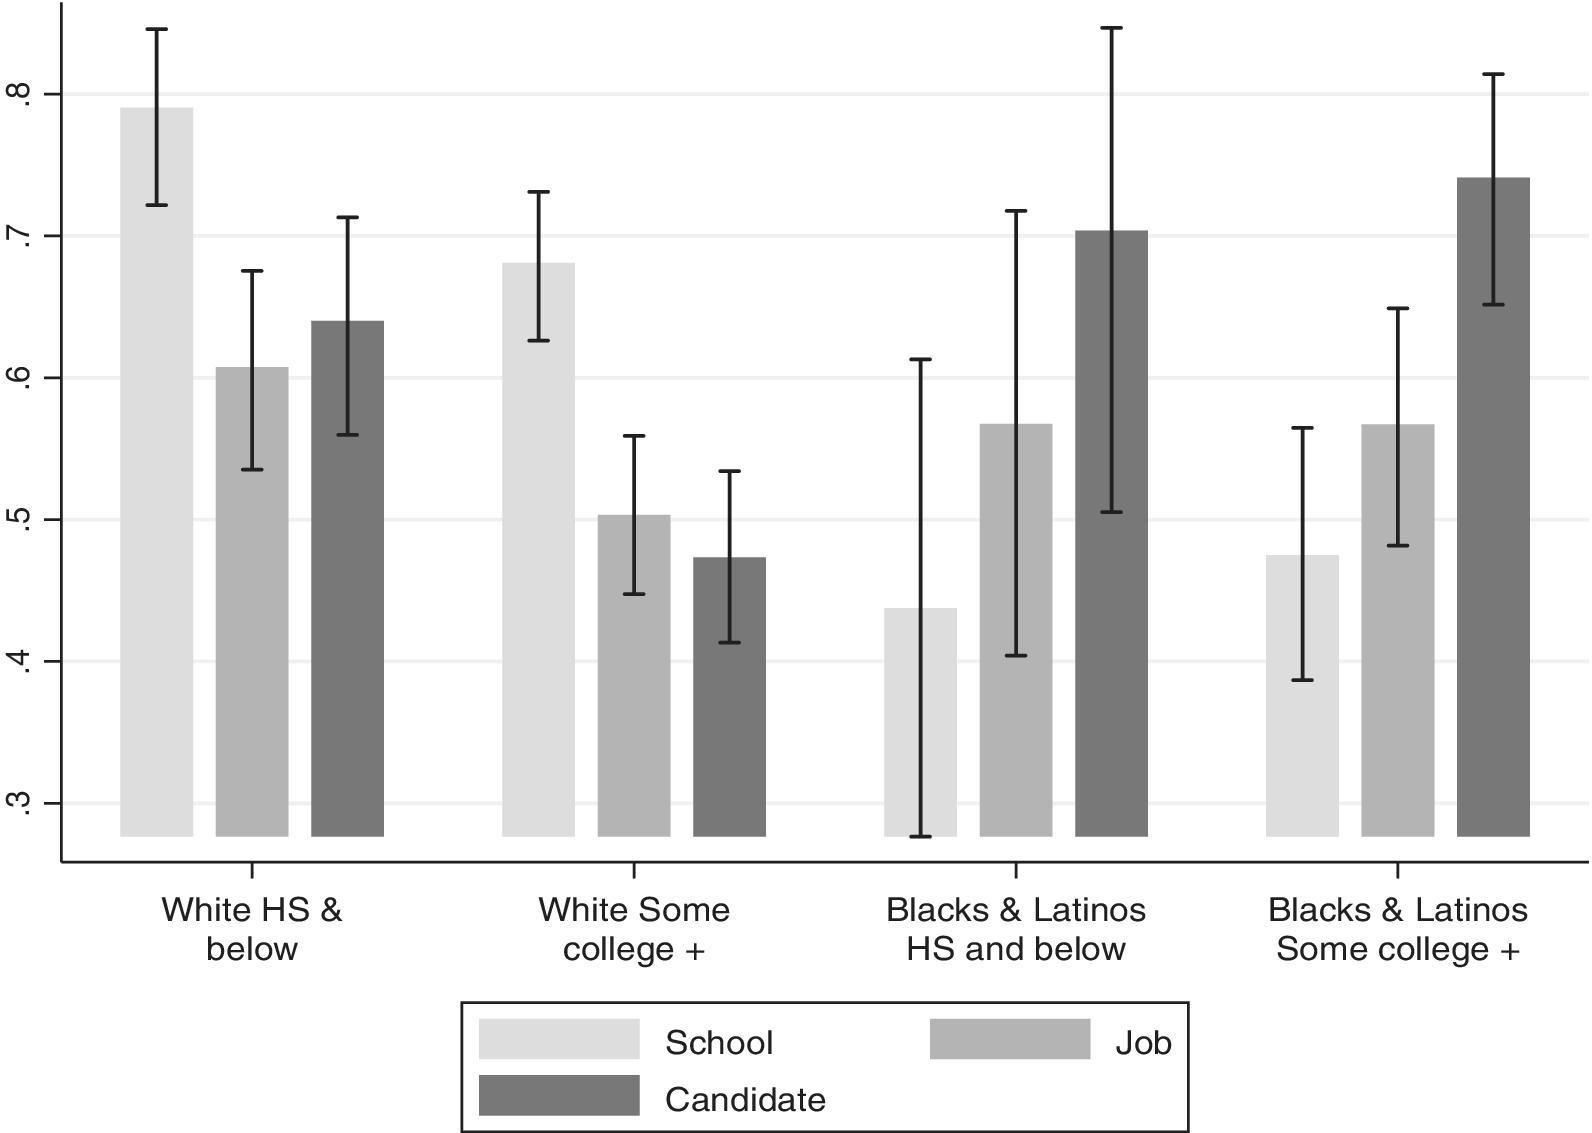
Variation by Educational Level: We turn now to variation in choices in each domain by educational status within each group. Still in the Control condition, the right side of figure 6 shows that higher-educated and lower-educated Blacks and Latinos (combined)Footnote 11 choose almost identically. Preferences for remaining with their group varies by domain, but not across levels of education within a domain. Thus, other things being equal, roughly 55% of both higher- and lower-educated people of color prefer group connection in jobs, roughly 70% make the analogous choice in electoral politics, and under half choose a neighborhood with a shared group environment.
Proportion choosing own-group option in the control condition, by racial or ethnic group, level of education, and domain, CCES 2014
Notes: N in each domain= ~170 whites; ~30 Blacks and Latinos, with high school and less; ~300 whites; ~120 Blacks and Latinos, with some college or more [Ns vary slightly by domain]. Results are unweighted.
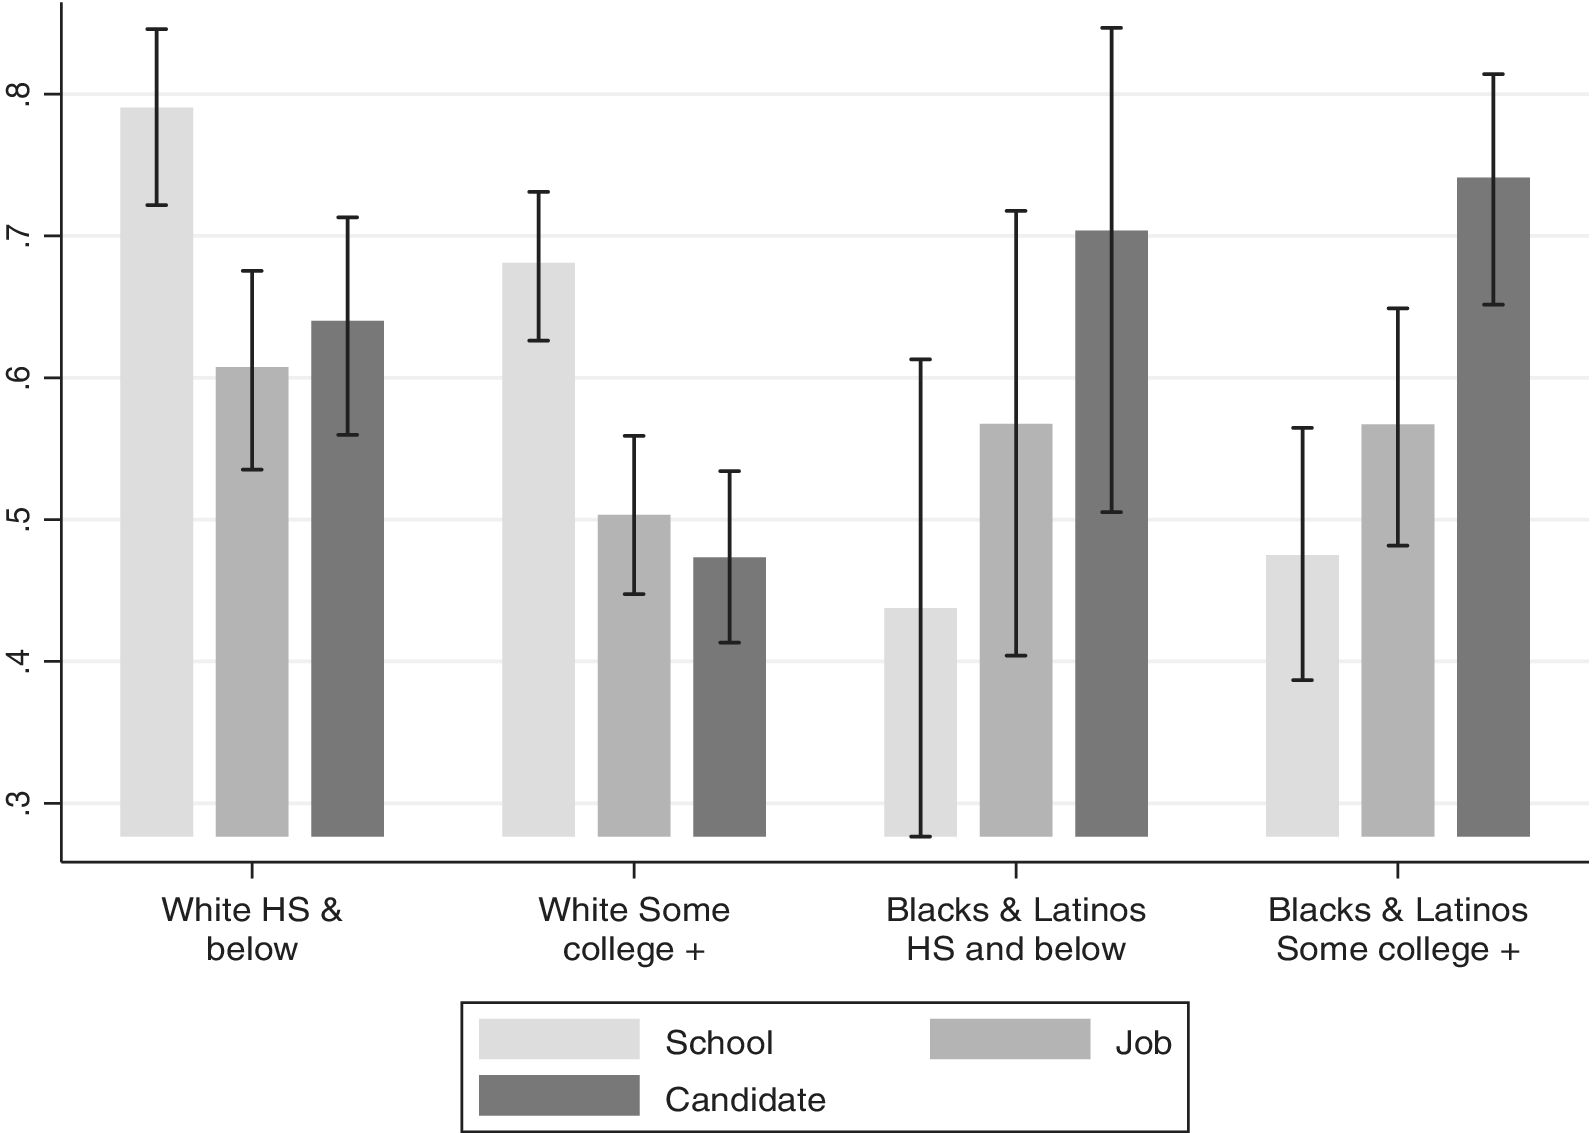
As the left side of figure 6 shows, however, the pattern differs among whites, revealing a large and unanticipated difference in the Control condition. In all three domains, whites with less formal education are more likely to opt for their group than are whites with more formal education. Almost four-fifths with little schooling choose a mostly white neighborhood, compared with abouat two-thirds of those with more schooling. The comparable figures are 60% to 50% for jobs, and 64% to 47% for candidates. Higher-educated whites are distinctive in eschewing group connection in two of the three domains in the Control codition (Blacks and Latinos with both high and lesser levels of education also choose other race contexts, in one domain only—that of the neighborhood). While not a treatment effect, this result is noteworthy, suggesting that for high-status whites, other-race environments do not imply racial discomfort or are compelling for other reasons—or perhaps more educated whites perceive more pressure to provide a socially-desirable response even on an anonymous survey.
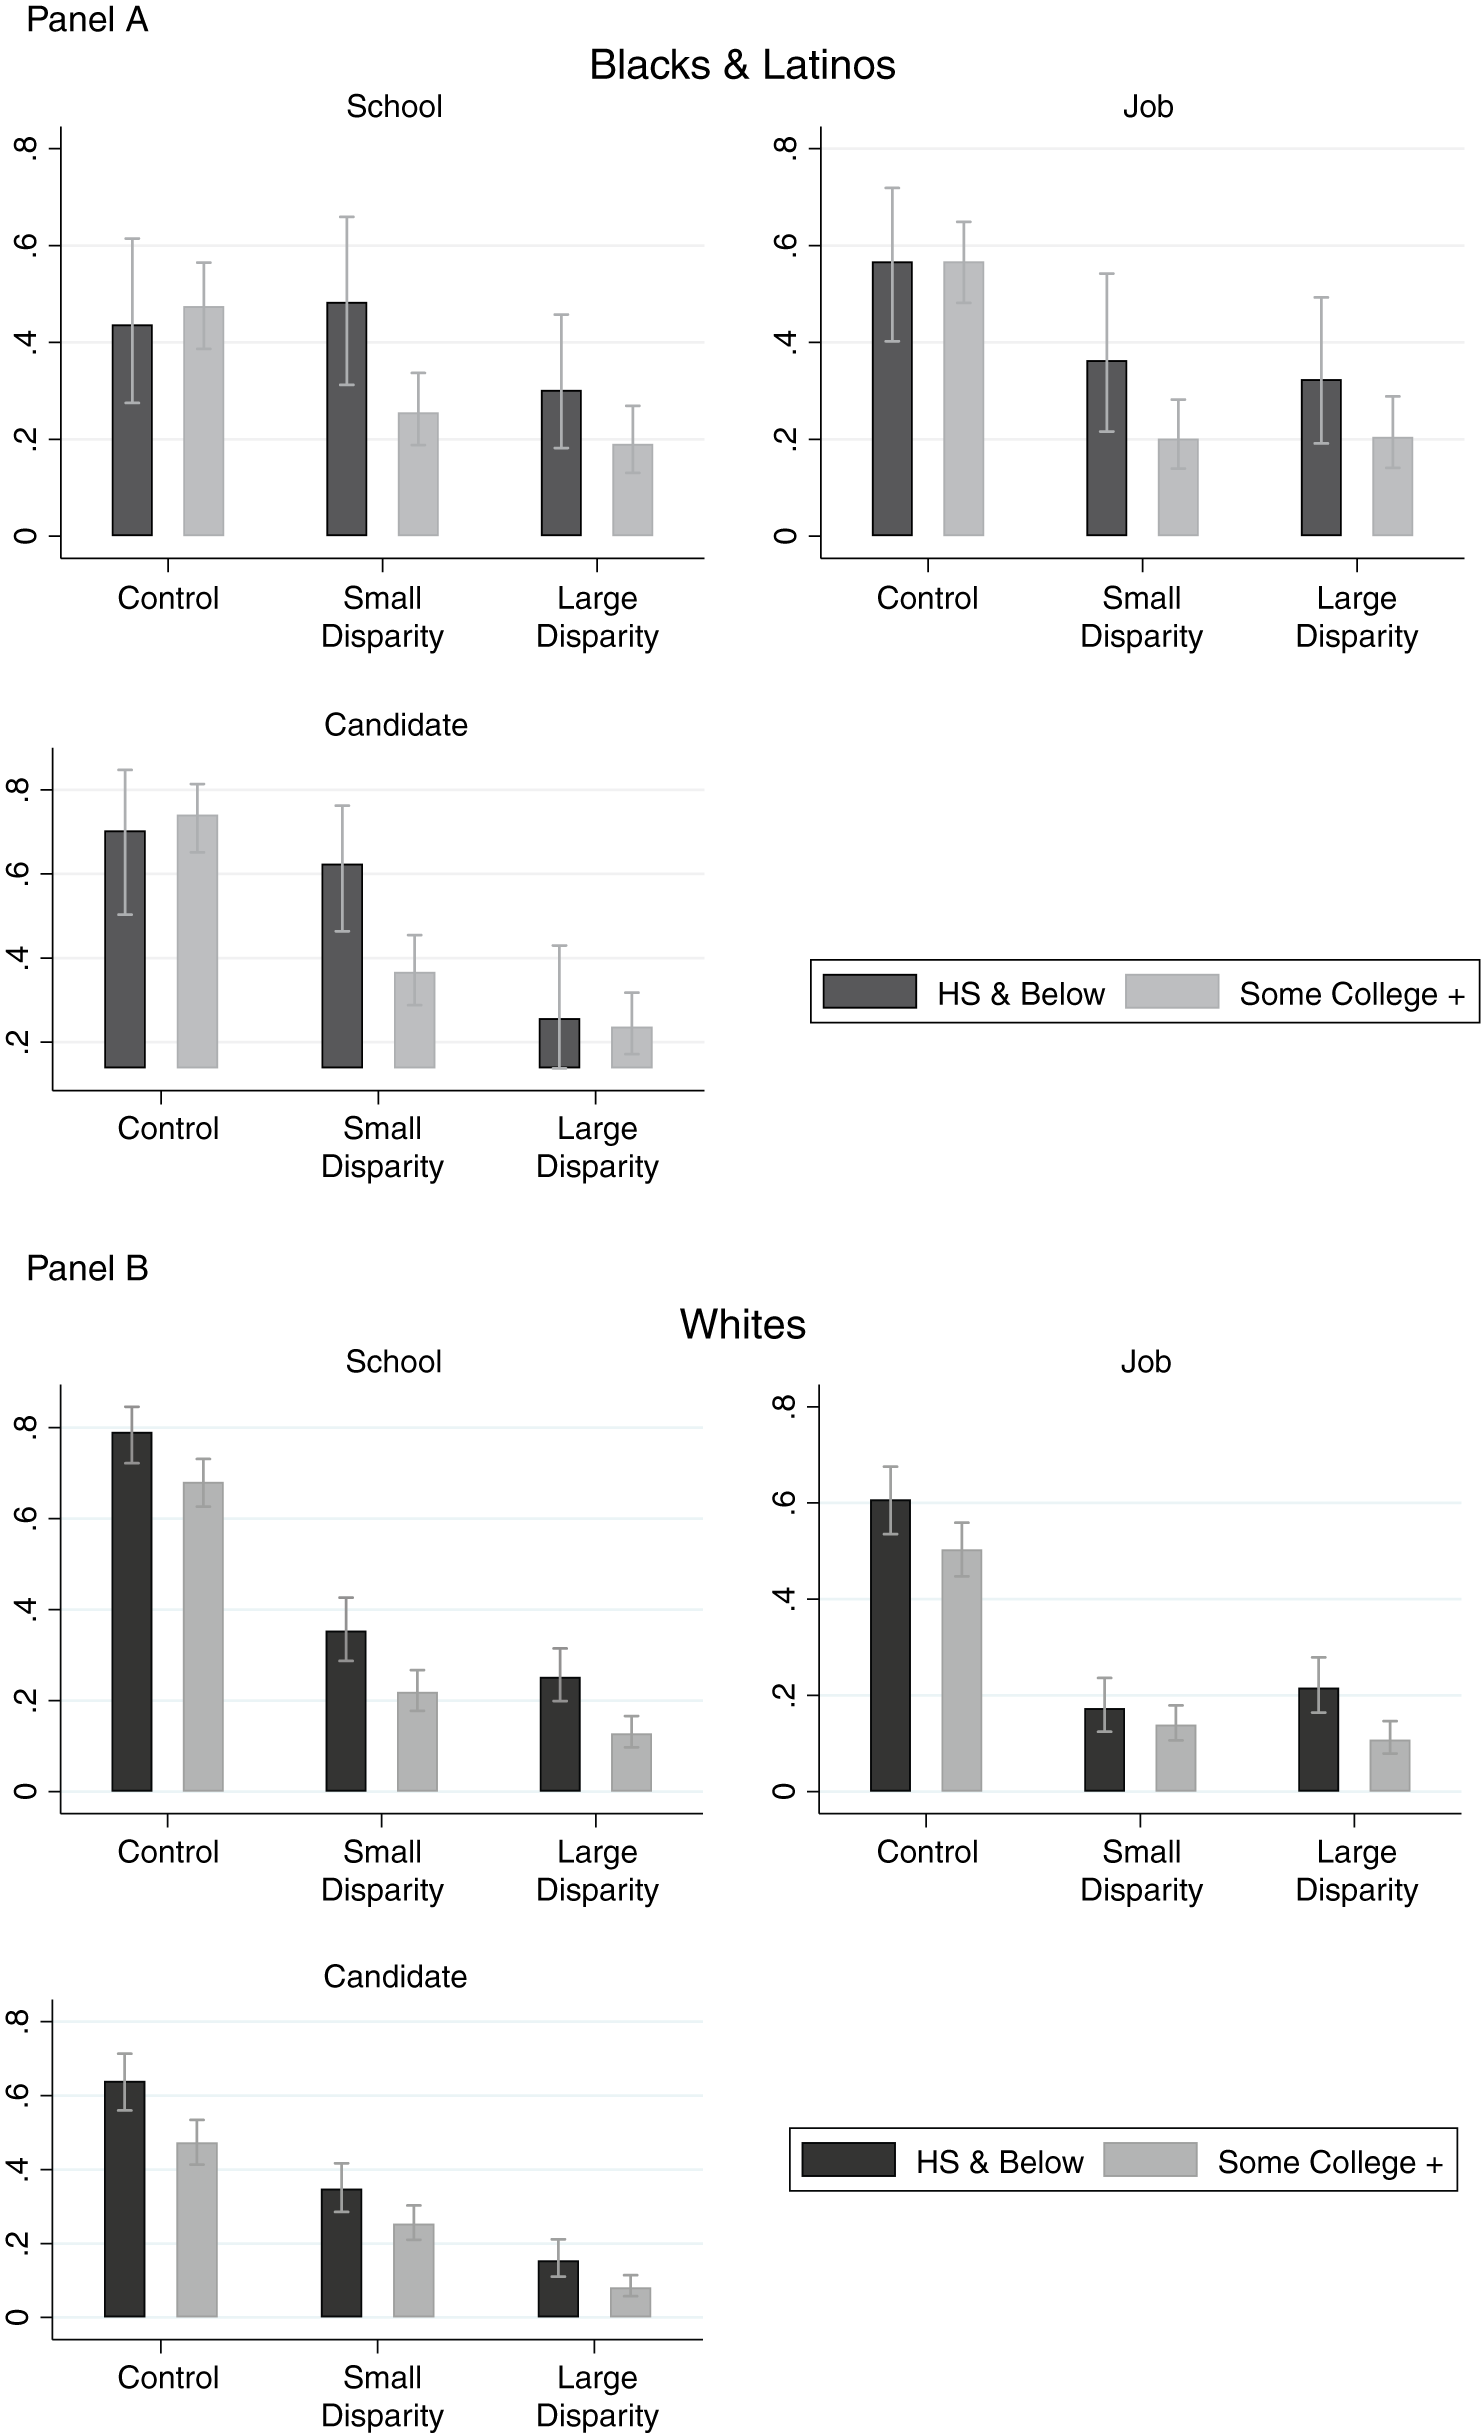
We can now finally move to our central expectation: in all three groups, the higher-educated are more likely than the lower-educated to choose a higher quality school, job, or representative even if it means forgoing a racially shared environment. Figure 7, panels A and B, shows the results. The bars labeled “Control” in each panel show the same results as in figure 6; they are included so that they can be compared with the “Disparities” bars for each domain in figure 7.
Proportion choosing own-group option across treatments by race, education, and domain, CCES 2014
Notes: N=1567 whites; 485 Blacks and Latinos, combined. Results are unweighted.
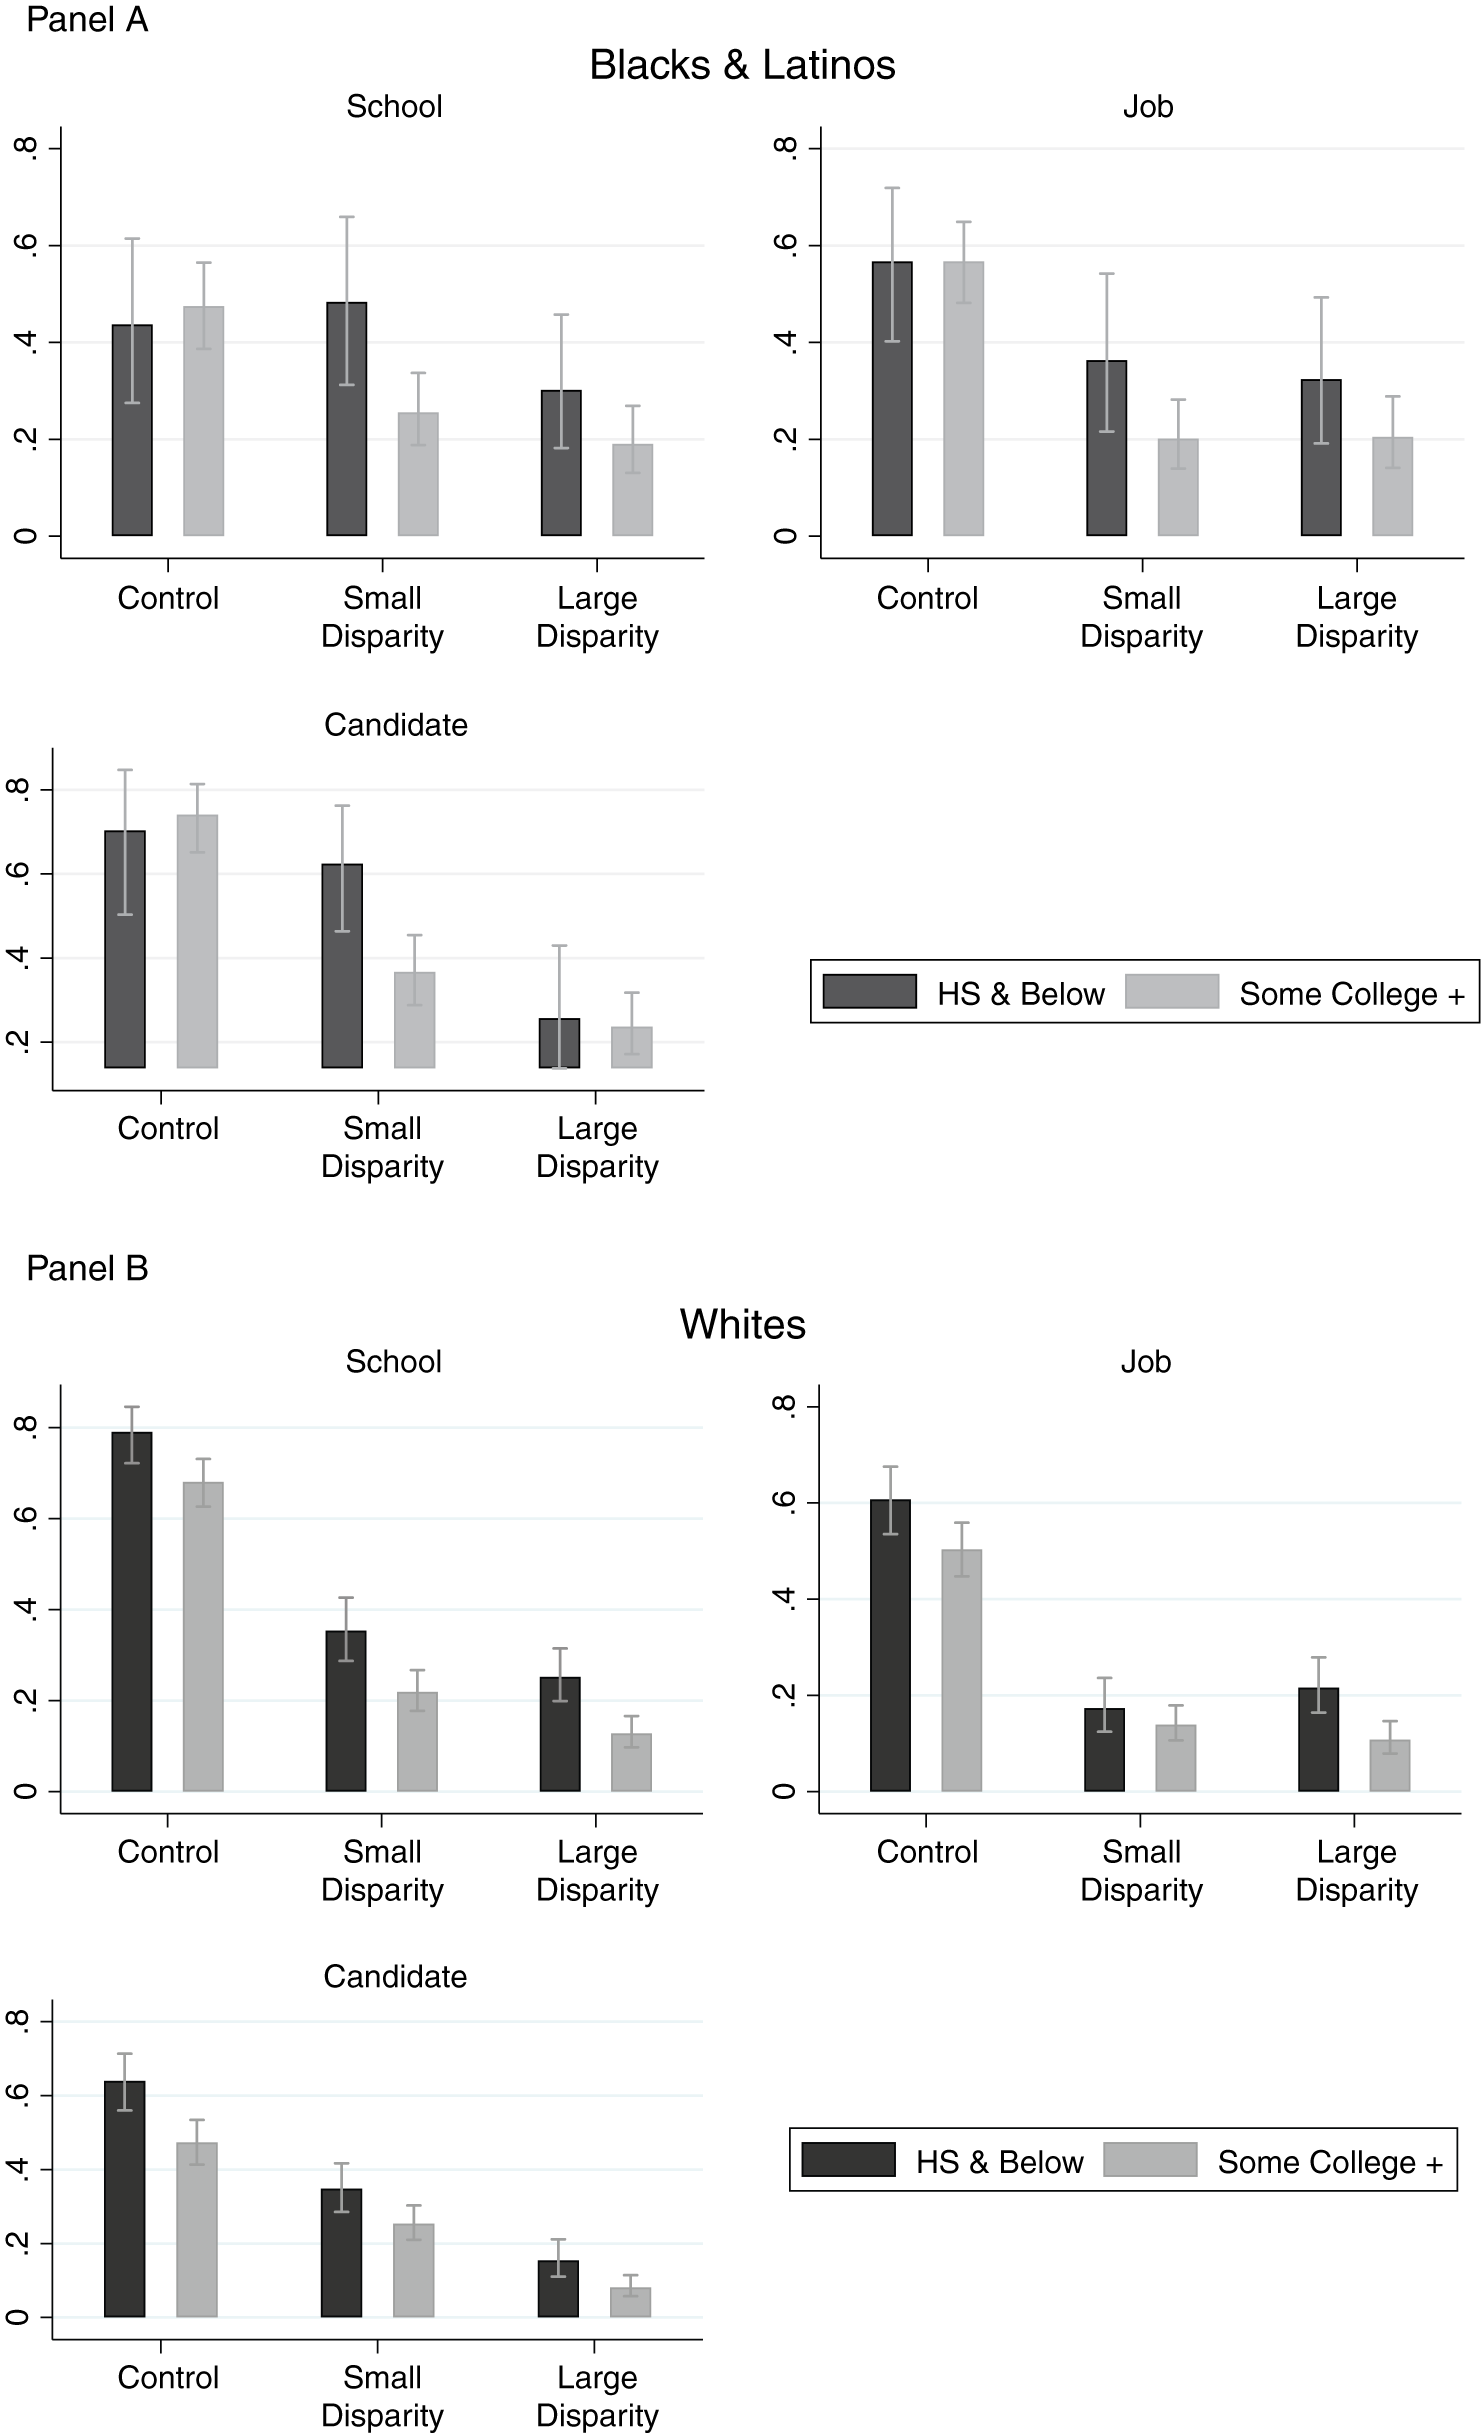
Among both whites and nonwhites, the proportions selecting a same-race context declines from the Control to the Small Disparity condition and (usually) declines further to the Large Disparity condition.Footnote 12 The decline can be considerable, reaching a 55 percentage point drop from the Control to the Large Disparity treatment in the school domain among higher-educated whites, or a 50 percentage point drop in the candidate domain from the Control to the Large Disparity condition among higher-educated Black and Latino respondents.
More theoretically important, however, is the fact that the likelihood of opting out of a shared group environment is greater among the higher-educated than among the lower-educated. That is, in almost all cases, a larger share of higher- than lower-educated respondents choose the neighborhood, job, or candidate that promotes individual success or policy preferences but forgoes ingroup connection.
Furthermore, this differentiation is more pronounced among respondents of color than among whites. As the Control bars in all three segments of figure 7, panel A, remind us, in the Control condition (with no differences in school quality, salary, or candidate positions) respondents of color show almost no intra-group differences in preference for group connection in any domain. In contrast, the Disparity treatments generate a large difference in all three domains between those with more and less schooling. Among lower-educated Blacks and Latinos, the decline in choosing a shared racial context from Control to Small Disparity is 21 percentage points for jobs and 7 percentage points for the candidate—along with, surprisingly, a 4 percentage point increase for schools. For the more highly educated, the corresponding changes in choosing group connection from Control to Small Disparity are larger and consistent, with declines of 37, 37, and 22 percentage points for jobs, candidates, and schools, respectively. The decline in proportion choosing a same-race environment from Control to Small Disparity is statistically significant in all three domains among respondents of color with more education, but is statistically insignificant for those with less education.
The same pattern—greater decline among higher- than lower-educated Black and Latino respondents in opting for same-race contexts—also obtains in the move from Control to the Large Disparity condition. The drop in choosing a same race context from the Control to the Large Disparity condition is 14, 25, and 44 percentage points among lower-educated respondents of color in the neighborhood, job, and politics domains respectively. Among their more educated peers, the corresponding decline is 29, 36, and 50 percentage points, respectively. This time, the decline in support from Control to Large Disparity is statistically significant among the lower educated as well as among the higher educated in the neighborhood and politics domains, though not in the job domain.
Thus, we observe two dynamics among respondents of color. First, the magnitude of movement from Control to Small or Large Disparity treatments varies by domain and by level of formal education. It takes a Large Disparity between the quality of schools and the policy congruence of candidates for the lower-educated to be enticed into choosing a different racial context. But it only takes a Small Disparity to induce highly-educated Blacks and Latinos to choose outside their racial group in all three domains. Second, and partly as a consequence, movement is actually greater from a Small to Large Disparity than from Control to Small Disparity in all three domains among the lower-educated. Only when facing a substantial cost to remaining with their group do they choose the other-race context in a similar proportion to their more educated counterparts.
The patterns of choice differ for whites. As the Control columns in all three panels of figure 7, panel B, show, higher-educated whites are less likely than lower-educated whites to choose a same-race environment when all else is held equal. As a consequence, the shift from Control to the Small or Large Disparity conditions is not relatively greater among the higher- than the lower-educated white respondents. That is, while the share of higher-educated whites choosing a same-race context is always smaller in the Disparity conditions than is the share of lower-educated whites making the same choice (and is statistically significantly different from the Control condition), movement away from group connection is not proportionally greater among the higher- than among the lower-educated. Unlike with people of color, Whites’ level of education is not differentially associated with their responses to our weak or strong inducements to choose individual benefit.Footnote 13
Explanations and Mechanisms
There are two ways to examine why highly-educated Blacks and Latinos become less likely to choose group connection more readily and completely than do their counterparts with less formal schooling. One can examine associations with other items in the survey. Or one can ask them why they made a given choice. We did both. CCES data do not permit a definitive test of explanations or mechanisms, but in the context of analyses in prior scholarship, they enable well-grounded conjectures.
Possibly people of color with different levels of education hold different ideologies that affect choices. Most research has found lower-status Blacks and Latinos more likely than higher-status counterparts to embrace Black or Chicano nationalism, and therefore to prefer “cultural, social, economic, and political separation from white America” (Dawson Reference Dawson2001, 87; see also Beltran Reference Beltran2010; Brown and Shaw Reference Brown and Shaw2002).Footnote 14 In parallel fashion, higher-status Blacks are more likely to be individualistic than nationalist (Harris and McKenzie Reference Harris and McKenzie2015). Thus one can envision a causal link between political conservatism or group nationalism and choices with regard to schools, jobs and candidates. As Black CCES respondents put it, on the one hand, “vote my own race”, and on the other hand, “a lot of concentrated Blacks, mean trouble.”
However, the 2014 CCES offers little support for the political ideology explanation, for two reasons. First, higher-educated respondents of color are more likely to identify as liberal (38%) than are their lower-educated counterparts (29%),Footnote 15 even though the former are also more likely to opt for a non-same-race context. In addition, including a control for political ideology does not change the education patterns we show in figure 7, panel A; ideological leanings do not moderate Blacks’ and Latinos’ chosen strategies.
Second, although the CCES did not include measures of racial nationalism, we did ask respondents whether they have more in common with their racial group regardless of social class, or their social class regardless of race. In all three domains, people of color who claim more in common with their race are less likely to choose a context with fewer of their group but better circumstances than are those who say they have more in common with their class. For example, in the Small Disparity condition, only 25% of Blacks and Latinos (combined) who identify with their class would choose group connection in the neighborhood domain, compared with 40% of those with more in common with their race. Patterns are similar in the other two domains: 20% (more in common with class) versus 35% (more in common with race) would choose a same-race workplace, and 40% (more in common with class) versus 53% (more in common with race) would choose descriptive representation over policy agreement. That is what one would expect if the measure taps into a sense of group solidarity, as it apparently does.
However, perceiving a lot in common with one’s group does not explain why lower-educated Blacks and Latinos are more likely to choose group connection over individual benefit—because higher-educated CCES respondents of color are more likely to choose “more in common with other Blacks/Latinos” (29%) than are lower-educated respondents (22%). These results support Zoltan Hajnal’s observation that “class gains may increase the salience of race because economic success often means working in a predominantly white world and experiencing discrimination more regularly” (Hajnal Reference Hajnal2007; see also Cose Reference Cose1993; Hochschild Reference Hochschild1995). Or as one college-educated Hispanic respondent explained her choice of descriptive representation over policy congruence, “[I want] to provide support to a Latino/Hispanic that can possibly make a difference and prove to other races we truly are ALL EQUAL.” Given those patterns, one would plausibly infer from the results of the “more in common” question that higher-educated people of color choose group connection over personalized interests when disparities are introduced—but they do not. In sum, neither conventionally defined ideological differences nor a measure of racial closeness explains the pattern of CCES choices.
A second pathway to understanding the CCES results is systematic analysis of respondent’s own reasoning. Out of a theoretically possible 6,753 responses (2,251 respondents * 3 vignettes each), we received 1,874 interpretable answers to the question of why they made a given choice when presented with a domain and level of disparity. Since respondents tend to comment on all three domains or on none, we received comments on each domain from roughly 520 whites, 80 Blacks, and 90 Latinos.Footnote 16
Statistical tests or even numerical counts of these comments would be a category mistake, since the commenters are self-selected. Instead, exploring how individuals in various race-class positions puzzle through the vignettes suggests a plausible mechanism for their choices. Three research assistants not otherwise connected with the project, with reconciliation by a fourth, coded responses into eleven substantive themes that we condensed into several broad categories. One cluster invokes norms, emotions, or ideology:
-
• “I work with diverse groups a lot. [It is] actually refreshing.”
-
• “I look for values and race has no place in making this decision.”
-
• “The Black candidate is assumed to understand/relate to what my concerns and issues are.”
-
• “I am 100% for restricting ALL government jobs to Natural born Americans. No one who themselves or their parents should ever be permitted to serve in government until the generation has arrived where ALL loyalties to any other government or fore[fathers are gone]”
A larger cluster of explanations is more instrumental, invoking financial ambition, the priority of safety, or policy or political goals:
-
• “There are a lot of other factors that go into this decision, but all things being equal, go for the money.”
-
• “I’m going to vote for the person that agrees with me. I’m not wasting time voting someone into office just because they are Black that’s insane.”
-
• “Get your children in best neighborhood your money can buy even if it may pane your wallet.”
-
• “I have no problem working in a mostly-non-Black environment as long as I am paid well and treated fairly, and there is opportunity for advancement/promotion and no glass ceiling.”Footnote 17
Within the set of instrumental choices lies a further important distinction. If respondents of color expect the racially mixed environment to be difficult or frustrating, or to put them at risk of discrimination, choosing a same-race context has more appeal:
-
• “Unfortunately, I feel I would get further [a]head in that situation [of remaining within the group in the job domain].”
-
• “Going to a so called good school doesn’t help if you are getting discriminated against I would not go to a bad school either.”
-
• “Given that they [the people in the vignette] are Hispanic or Latina/o, they are less likely to experience discrimination in that neighborhood [comprised mostly of other Hispanics], and may have shared experiences with those in their neighborhood as well.”
In contrast, if respondents of color feel confident in negotiating a complex and potentially fraught other-race environment, the pull of greater gains in the two Disparity conditions is strong. Several draw on their experience of living or working in a predominantly white environmentFootnote 18 to explain their choice of this strategy to maximize individual benefit:
-
• “To gain the experience of other races besides his own. At several jobs, I was the only Black staffer and I learned a lot about other cultures.”
-
• “I don’t care either way if I’m with other Hispanics or not- I can adapt to anything.”
Others make less personal references, but similarly assert that the vignette subject could thrive in an environment that offers gain, even if it also entails risk:
-
• “I would want my child to have to best possible advantage in life and I believe that comes from having an excellent education.”
-
• “He is straight out of college. This is huge. Race isn’t as important as his experience. Business majors are thinking about the bottom line. If anything, the company with the larger salary offer might have more pull in the industry, allowing him [to advance].”
-
• “This choice [for remaining in a group environment] is based on fear and intimidation. I would hope David is brave enough to get payed his worth.”
These comments point to personal efficacy as a promising explanation for the choice of individual or group-based strategies to pursue one’s goals. The intersectionality framework provides an underlying theory for efficacy’s role in explaining the CCES results. If raised in substantially segregated environments, Blacks and Latinos with interacting class and race disadvantages have not only few resources but also little experience to bolster a sense of control in a potentially unfamiliar neighborhood, job, or political campaign. Connection with their group, in contrast, offers strength as well as safety. Conversely, Blacks and Latinos who do not face intersecting class marginality are better positioned to anticipate control of the balance of risks and gains in a racially mixed environment. They typically have had more extended experience outside their group, and more practice in using resources to achieve goals in a heterogenous setting (Lacy Reference Lacy2007; Pattillo Reference Pattillo2013; Robinson Reference Robinson2011; Vallejo Reference Vallejo2013), even if difficult or painful (Landry and Marsh Reference Landry and Marsh2011; McGowen Reference McGowen2017). As Michael Hughes and David Demo summarize with regard to Black Americans, “the experience of effective performance is the most important factor in the development of a sense of personal efficacy. Because the social contexts that are particularly conducive to efficacious activity are institutional in nature—part of the macrostructure of society—indicators of an individual’s location in that macrostructure (specifically, social class and work) should be strong predictors of personal efficacy.” They find, as predicted, that “measures of socioeconomic status are the most important predictors of [Blacks’] personal efficacy relative to other variables” (Hughes and Demo Reference Hughes and Demo1989, 138, 146. See also Harris and McKenzie Reference Harris and McKenzie2015; Hochschild Reference Hochschild1995).
Unfortunately, the CCES survey does not enable further analysis of the role of efficacy in explaining individualized or group-connected strategies for pursuing one’s goals. Like the question of why whites’ views vary across educational levels even in the experiment’s Control condition, exploring it awaits further research.
Conclusion
Inequality shapes lives. Compared with the poor in their own group, the well-off are increasingly likely to live longer, be insulated from the criminal justice system, start and finish college, hold professional jobs, attain U.S. citizenship, evade chronic illnesses and obesity, live in communities with amenities, avoid victimization, vote and participate in electoral campaigns, and engage with elected officials responsive to their priorities. Inequality is also self-reinforcing, through childhood opportunities, education, marriage, residential location, jobs, and a host of other dynamics. The well-off are less likely to be infected with, and die from, COVID-19.
Americans are increasingly unequal both across and within racial and ethnic groups. Structural explanations for inequality and its consequences are compelling—but individual choices can strengthen or weaken it, as ANES and CCES analyses show. Compared with low status counterparts, high status respondents are less supportive of downwardly redistributive social policies, and more likely to pursue individual strategies that offer success. Those choices make sense for themselves and their families. But they risk promoting a metaphorical and literal move away from the worst-off Americans, in a way that can deepen class rifts in policy support and worsen disparities in lived experiences. If that happens, well-off individuals will live among one another in communities conducive to safety, health, learning, political influence, and success, while poor individuals and communities will face growing isolation and deteriorating bridges to other Americans (Stewart Reference Stewart2015).
The fact that middle-class Blacks and Latinos have considerable capacity to choose and use their preferred strategies is a considerable achievement for Americans’ civil and individual rights.Footnote 19 That they tend to pursue individual goals while maintaining commitment to policies that promote Black and Latino well being and group fortunes, as we found in the ANES, points to the distinctive amalgam of group-centric and personal preferences that is generally unfamiliar to whites. But that victory comes at a cost, if the worst off “confront the denial of access not only to dominant resources and structures, but also to many of the indigenous resources and institutions needed for survival” (Cohen Reference Cohen1999, 75). Whether Americans can both promote people’s freedom to pursue individual goals and prevent deterioration of the position of the badly-off is a crucial question—and the goal of Najya’s parents, who, unlike most of their friends, enrolled her in a predominantly Black, poorly resourced, neighborhood school.
Supplemental Materials
To view supplementary material for this article, please visit http://dx.doi.org/10.1017/S153759272000482X.
Appendix 1. Details about the ANES Time Series
Appendix 2. Responses in each domain, by experimental condition and race or ethnicity, CCES 2014
Appendix 3. Subsamples for highly- and less-educated respondents, by race or ethnicity, CCES 2014
Appendix 4. Distribution of support for government social provision index (2012 ANES)
Appendix 5. Regression models on which Figure 3 is based, and alternative specifications
Appendix 6. Replication of ANES analyses using income instead of education as the measure of status
Appendix 7. Analyses separating Blacks and Latino respondents, CCES 2014
Appendix 8. Replication of CCES analyses using family income instead of education as the measure of status
Acknowledgements
The authors thank Stephen Ansolabehere and Brian Schaffner, Principal Investigators, for including our module on the 2014 CCES, and the YouGov staff for helping us turn our complicated idea into a manageable survey experiment. We thank participants in the annual meetings of the International, Midwest, and Southern political science associations, as well as participants in seminars at Harvard University, Northeastern University, University of Oxford, Johns Hopkins University, and Columbia University for both encouraging and challenging us. Both are essential components of genuine colleagueship. We also thank Angela Bautista-Chavez, Sarah James, Gabriel Karger, Mara Roth, and Shanna Weitz of Harvard University, as well as Libby Dimenstein, Jiahui Hui, and Michael Zanger-Tishler of Yale University, for exemplary research assistance.