Introduction
The past several decades have seen an ageing population and a shift in the United States of America (USA) and elsewhere from institutional to home and community-based settings for individuals with long-term care needs. As a result, there has been an increase in the number of individuals with disabilities, especially older adults, living in the community, despite a decline in the overall incidence of disability in the US population (Martin, Schoeni and Andreski Reference Martin, Schoeni and Andreski2010). Yet, research on the living arrangements of older adults with disabilities is scarce. In particular, there is a dearth of research that combines information on household composition (who one lives with) and housing characteristics (e.g. structure type, ownership, crowding), despite the fact that such information is of key importance to demographers, policy makers and service providers. This paper seeks to address that gap by describing the frequency of disability by type of living arrangement for older adults and by identifying some of the characteristics of living arrangements most strongly associated with having a disability.
The relationship between disability and living arrangements is bidirectional. While disability may predict living arrangements, such as in the case of individuals leaving their homes to rent smaller or more accessible living spaces, these same arrangements, including one's household composition and housing type, can influence the disablement process (Mor et al. Reference Mor, Murphy, Masterson-Allen, Willey, Razmpour, Jackson, Greer and Katz1989). Living arrangements may reflect one's current disability status, e.g. living in a nursing home because of an inability to live independently (Latham Reference Latham2011). Living arrangements may also shape future disability through the resources that they provide (or not). For instance, an older adult with mobility impairments may successfully live independently in a single-storey home with an accessible entrance and bathroom, but may find those same impairments to be disabling in a less-accommodating setting. Similarly, household composition can have significant effects on older adults' health and wellbeing, e.g. older adults living alone or with family members other than their spouse exhibit more depressive symptoms and worse psychological wellbeing than older adults living with their spouses (Henning-Smith Reference Henning-Smith2014). The majority of older adults want to age-in-place (Keenan Reference Keenan2010), but not all living arrangements will provide them with appropriate settings to accommodate disabilities. Still, other older adults may be living in settings that do not support their functional needs, but without the means to move. Before we can develop a full understanding of these processes, it is necessary to have a baseline understanding of the current living arrangements of older adults with and without disabilities.
Policy changes in the USA over the past several decades, including those following the Olmstead Act (1999), the Americans with Disabilities Act (1990) and the 1991 implementation of Medicaid waiver and community-based long-term services and supports programmes, have impacted living arrangements for older adults with disabilities by decreasing the use of institutional long-term care and increasing access to home and community-based services for people with disabilities. Further, life expectancy has gone up, largely due to medical and public health gains over the past several centuries, resulting in more people living longer into old age, even with disabilities. This has resulted in a greater number of older adults with functional impairments living in the community (as opposed to nursing homes). Today, the vast majority of care received by community-dwelling older adults with disabilities is provided by unpaid family members (Kaye, Harrington and LaPlante Reference Kaye, Harrington and LaPlante2010), often within the same household, rather than by formal care-giving systems, making the home context that much more important for older adults who might otherwise have difficulty living independently (Seidel et al. Reference Seidel, Richardson, Crilly, Matthews, Clarkson and Brayne2010; Vlachantoni et al. Reference Vlachantoni, Shaw, Evandrou and Falkingham2015). Home and community environments are not created equally, however, and one's context can have a profound impact on one's disablement process, mental health and quality of life, and risk of relocation. Yet, there is limited research on the demography of living arrangements for individuals with disabilities (Altman and Blackwell Reference Altman and Blackwell2014).
Household composition
Who one lives with will influence patterns of everyday social interactions, as well as immediately available resources (social and otherwise). As a result, health and disability should be examined within the household context (Glaser, Murphy and Grundy Reference Glaser, Murphy and Grundy1997). While living with a spouse or partner remains the most common arrangement for adults aged 65 and older in the USA (The Federal Interagency Forum on Aging-related Statistics 2010), throughout the 20th century, there was an increase in the proportion of older adults, especially older widows, living alone (Ruggles Reference Ruggles2007). The last few decades saw particular increases in households comprised of people living alone and non-family households (Teachman, Tedrow and Crowder Reference Teachman, Tedrow and Crowder2000). In a recent paper on the prevalence of disability in US households using the National Health Interview Survey, older adults living alone made up more than 40 per cent of all households containing someone age 65 and older with a disability (Altman and Blackwell Reference Altman and Blackwell2014).
Living alone, especially for older adults who are socially isolated and lack access to appropriate resources, can lead to poor health outcomes. These include functional decline (Mor et al. Reference Mor, Murphy, Masterson-Allen, Willey, Razmpour, Jackson, Greer and Katz1989), onset of activities of daily living (ADL) limitations (Shih et al. Reference Shih, Song, Chang and Dunlop2005), onset of mobility disability (Avlund et al. Reference Avlund, Damsgaard, Sakari-Rantala, Laukkanen and Schroll2002), increased risk of poor mental health outcomes (Mui Reference Mui1999; Sun et al. Reference Sun, Lucas, Meng and Zhang2011) and increased risk of mortality (Klinenberg Reference Klinenberg2003, 2012). These outcomes are not universal, however, and differ by gender, with men living alone being at greater risk of mortality (Gurley et al. Reference Gurley, Lum, Sande, Lo and Katz1996; Klinenberg Reference Klinenberg2003), and age, with mortality rates sharply increasing with age for older adults living alone (Gurley et al. Reference Gurley, Lum, Sande, Lo and Katz1996). In fact, some research has found that, for women, especially women in good health at baseline, living alone is associated with better outcomes than living with a spouse or others (Li Reference Li2005; Pizzetti, Manfredini and Lucchetti Reference Pizzetti, Manfredini and Lucchetti2005).
It may be that, for those who experience diminished health from living alone, the cause is as much insufficient resources as it is social isolation. Older adults living alone are more likely to live in poverty than their counterparts living with a spouse (The Federal Interagency Forum on Aging-related Statistics 2010). Living alone is a risk factor for nursing home admission (Greene and Ondrich Reference Greene and Ondrich1990), indicating a gap in access to home and community-based services and support for this population and a particular risk for those living alone with disabilities that make living independently difficult. This is partly attributable to the fact that older adults living alone with disabilities do not have ready access to family and other in-home support systems that can provide care, resulting in higher unmet need (LaPlante, Harrington and Kang Reference LaPlante, Harrington and Kang2002).
Older adults who live with others, usually family and sometimes including a spouse, are a less well-understood population, despite the increase in multigenerational households in the past three decades (Taylor et al. Reference Taylor, Passel, Fry, Morin, Wang, Velasco and Dockterman2010). While such situations might include an older adult moving in with adult children to receive care, it is just as common for adult children to move in with their parents to receive help, as in the case of an adult child's divorce, widowhood, single parenthood or long-term disability (Smits, Van Gaalen and Mulder Reference Smits, Van Gaalen and Mulder2010). Co-residence, especially between adult children and their ageing parents, is most likely when one or both parties have fewer economic resources (Smits et al. Reference Smits, Van Gaalen and Mulder2010). Some research indicates that older adults living with others have the lowest functional status of any household composition (Waite and Hughes Reference Waite and Hughes1999). Further, older adults living in multigenerational households are particularly vulnerable to poor health outcomes, including diminished mental health and loneliness, especially when compared with older adults living with a spouse only (Greenfield and Russell Reference Greenfield and Russell2011). Yet, older adults living with others comprise a diverse and understudied population (Altman and Blackwell Reference Altman and Blackwell2014), and for some sub-groups, such as parents who have strong emotional ties with their co-resident adult children, outcomes are better than for older adults living with a spouse only (Silverstein, Cong and Li Reference Silverstein, Cong and Li2006). This living arrangement requires particular examination by age and disability status, however. For example, it would be a very different situation for a healthy 65-year-old to have an adult child move back home than for a 90-year-old with functional limitations to move into her child's home.
Housing type and household physical environment
Housing type and physical environment play a large role in an older adults' ability to age-in-place successfully. Housing policy should be considered an integral component of the disablement process, in which one's social context influences one's development and experience of disability and subsequent receipt of care (Oldman Reference Oldman2002). Home-ownership is one important characteristic of housing policy that is closely tied to disability. Research finds that home-owners move less than renters (Dietz Reference Dietz2003), are less likely to be admitted to a nursing home (Rouwendal and Thomese Reference Rouwendal and Thomese2013) and have a higher likelihood of exiting a nursing home once admitted (Greene and Ondrich Reference Greene and Ondrich1990). However, not everyone in the USA has had an equal opportunity to buy a home (Satter Reference Satter2009). Those families who were able to buy houses decades ago may have since been able to pass housing or accumulated wealth down through generations. Other families, systematically denied access to decent, affordable housing have had far fewer opportunities to develop lasting bonds (financial and emotional) with a home (Satter Reference Satter2009).
Approximately 80 per cent of adults age 65 and older in the USA are home-owners and housing equity constitutes the main source of wealth for the majority of older adults (Research Institute for Housing America 2013). Of the 20 per cent of older adults who rent, nearly half of them (44%) spend more than a third of their income on rent, making it difficult for this population to accrue wealth to pay for long-term services and supports, should they develop a disability. Yet, functional limitations are nearly twice as common among renters as among home-owners (Research Institute for Housing America 2013). Renting is associated with an increased risk of mortality and disability, even after adjusting for socio-economic status, age and health (Avlund, Damsgaard and Osler Reference Avlund, Damsgaard and Osler2004). This may be explained by higher transience and less place attachment among renters (Brown, Perkins and Brown Reference Brown, Perkins and Brown2003).
The type of housing structure also matters. Living in a single-family, detached home is a very different experience than living in a large, urban apartment building or a mobile home or other temporary structure. A home or apartment building with many levels, stairs and narrow hallways may make it increasingly difficult for someone with mobility impairments to navigate their own environment and to manage specific daily tasks, such as cooking and housework (Seidel et al. Reference Seidel, Richardson, Crilly, Matthews, Clarkson and Brayne2010). Further, the accessibility of one's home environment will determine whether or not it is possible for others with functional impairments to visit, affecting access to social resources. Whether or not one has adaptations (such as hand rails) to assist in the case of disability is also associated with whether or not one will need outside support to remain at home (Vlachantoni et al. Reference Vlachantoni, Shaw, Evandrou and Falkingham2015). Currently, the majority of home modifications in the USA are paid for privately (Eriksen, Greenhalgh-Stanley and Engelhardt Reference Eriksen, Greenhalgh-Stanley and Engelhardt2015) and often making such modifications involves taking out a loan or second mortgage. There are limited public programmes in the USA for funding environmental modifications, including through state and local Area Agencies on Aging, the Medicaid Home and Community-Based Services (HCBS) programme, and Housing and Urban Development-administered Community Development Block Grants or HOME Investment Partnerships Program (HOME) block grants (Pynoos and Nishita Reference Pynoos and Nishita2003). Differential access to such programmes may result in wide variation in the ability of older adults with disabilities to age-in-place successfully. Still, there is limited research on the relationship between housing type and characteristics and disability.
There is a trend towards increasing disability and functional limitations over time, which causes the magnitude of accessibility issues within the home to increase (Iwarsson and Wilson Reference Iwarsson and Wilson2006). Housing quality, even perceived dissatisfaction with housing quality, is associated with later cognitive decline (James and Sweany Reference James and Sweany2010). Therefore, while there has been a push towards supporting ageing-in-place, those home-owners with the greatest need for home modifications may also have the most limited resources for keeping up an ageing home because of constrained finances. In other words, individuals with fewer socio-economic resources may have more constraints on the types of modifications they can make (Renaut et al. Reference Renaut, Ogg, Petite and Chamahian2015) and they may also be living in the poorest quality housing stock. Housing type may interact with household composition. For example, living with a spouse or others may help to distribute some of the cost of home modifications, while older adults living alone may face more barriers to home maintenance and adaptations.
While there is persuasive research on the relationship between housing characteristics and functional limitations for older adults, there is a need for research that integrates household composition and housing characteristics to better understand patterns of living arrangements and disability for older adults. This paper aims to produce a more detailed understanding of the living arrangements of older adults with disabilities in the USA than is currently available. Such information will be useful both as a baseline for evaluating demographic trends in disability over time and for allocating limited state and federal resources towards providing care for a growing population of older adults.
Data and methods
Data for this study come from the 2012 Integrated Public Use Microdata Series, a harmonised version of the American Community Survey (ACS) (Ruggles et al. Reference Ruggles, Alexander, Genadek, Goeken, Schroeder and Sobek2010). The ACS is an annual cross-sectional survey of the US population, administered by the US Census Bureau. It surveys people of all ages and includes institutional settings, although it does not distinguish between types of institutions. Households are selected for inclusion and one household respondent answers questions for all members of the household. Variables are available at both the person and household level and sampling weights provide nationally representative estimates. The data make it possible to identify persons within households and to ascribe household characteristics to the individual level. The ACS includes measures of disability and various measures of housing type and household composition, as well as information on demographic characteristics (N = 537,548 respondents aged 65 and older in 2012). Age is top-coded at 95 by the US Census Bureau. In order to assess living arrangements of community-dwelling older adults with disabilities, I excluded all respondents living in institutional settings, which include correctional institutions, nursing homes and mental institutions (6% of adults 65 and older in 2012). For the final analytic sample, I used all individuals aged 65 and over who were not living in institutional settings (final N = 504,371; weighted population size = 41,616,981). The included individuals were not necessarily the household respondent.
Measures
Questions on disability were added to the ACS in 1990 and have been revised since then to bring the ACS disability measures into concordance with other commonly used measures (US Census Bureau 2012). Currently, the ACS includes six measures of disability, each of which is asked of one household respondent for all members of the household. The measures and associated questions are: cognitive (‘Because of a physical, mental, or emotional condition, does this person have serious difficulty concentrating, remembering, or making decisions?’); ambulatory (‘Does this person have serious difficulty walking or climbing stairs?’); independent living (‘Because of a physical, mental, or emotional condition, does this person have difficulty doing errands alone, such as visiting a doctor's office or shopping?’); self-care (‘Does this person have difficulty dressing or bathing?’); vision (‘Is this person blind or does he/she have serious difficulty seeing, even when wearing glasses?’); and hearing (‘Is this person deaf or does he/she have serious difficulty hearing?’). The self-care measure assesses limitations in ADLs and the independent living measure assesses limitations in instrumental ADLs (IADLs), both commonly used measures to assess disability among older adults (Freedman, Martin and Schoeni Reference Freedman, Martin and Schoeni2002). In the data, vision and hearing are combined into one measure, resulting in a possible range of disabling conditions from 0 to 5. For the purposes of bivariate comparisons, I constructed a binary measure of disability with ‘1’ indicating disability in one or more of the above categories; ‘0’ otherwise. In multivariate models, I treat disability as a scale from 0 to 5.
I constructed measures of household composition and housing characteristics to understand how both related to disability in older adults. Previous studies typically defined household composition with either three (with spouse, alone, and with others; Administration on Aging 2012) or four (with spouse only, alone, with spouse and others, and with others; Lau and Kirby Reference Lau and Kirby2009) categories. However, the large sample size and detailed measures of household relationships in ACS allowed for a more nuanced study of household composition. Thus, I constructed a five-category variable: lives with spouse only, lives alone, lives with a spouse and others (including children), lives with children (but no spouse) and lives with others (no children or spouse). Children included biological, step and adopted children, of any age or marital status. Typically, the children in this sample are adult children.
Following literature on meaningful housing characteristics (Research Institute for Housing America 2013), I constructed variables for several housing characteristics. First, I used a measure of type of housing structure: single-family home, mobile home or other portable structure (e.g. van, tent, boat or motorhome), unit in a small apartment building (two to nine units), unit in a mid-size apartment building (ten to 49 units) or unit in a large apartment building (50 or more units). The majority of mid-size and large apartment buildings in the sample were located in urban areas. Ownership status is coded as ‘1’ if the respondent lives in a home that is owned (either outright, or is paying off a mortgage) and ‘0’ if the respondent lives in a rented home. To assess crowded housing, a common measure of housing quality (Gentry et al. Reference Gentry, Grzywacz, Quandt, Davis and Arcury2007), I used a measure of ratio of rooms to people living in the household (rooms divided by people). In the cases of individuals living with a spouse, I assumed that spouses shared a room. From this, I constructed a binary measure of crowded housing, where ‘1’ indicates more than one person/couple per room (Eggers Reference Eggers2007). Finally, I constructed a variable that is ratio of monthly housing costs to total household income (monthly rent for renters and a composite variable of monthly mortgage, taxes, insurance and utilities for owners), categorised at less than 30 per cent, 30–50 per cent and more than 50 per cent. Thirty per cent is considered a cut-off for housing cost burden (US Department of Housing and Urban Development 2014).
I used a standard set of covariates to adjust for individual demographic characteristics in all models. These included gender, age (categorical: 65–74, 75–84, 85 and over); educational attainment (less than high school, high school degree, some college, college degree or more); ratio of household income to the federal poverty threshold (<100%, 100–199%, 200–399% and 400% or higher); and race/ethnicity (non-Hispanic White, Hispanic, non-Hispanic Black, non-Hispanic Asian/Hawaiian/Pacific Islander, non-Hispanic other).
Analyses
I first tested differences in demographic characteristics and living arrangements with chi-squared tests of differences in categories by disability status. Next, I analysed prevalence of disability by household composition and housing type in order to detect the living arrangements where disability is most commonly found. I used ordered logistic regression models to assess the odds of disability on a scale of 0–5, with ‘0’ indicating no disability and ‘5’ indicating that someone has all five types of disability. (In sensitivity analyses, I also ran logistic regression models with disability as a binary variable, equal to ‘1’ if an individual had any disabilities. I found that the associations between disability and living arrangements and socio-demographic characteristics were largely the same between types of models.) First, I controlled only for living arrangement characteristics and then added in the full set of demographic covariates, plus a fixed effect for state of residence. (Disability rates varied significantly by state.) Finally, because both living arrangements and the prevalence of disability vary significantly by age and gender, I ran models including interaction terms between type of living arrangement and age, and between type of living arrangement and gender. These interaction terms were significant, so I conducted sub-group analyses on the odds of disability by gender and age, generating odds ratios of disability by living arrangement separately by gender and age category. For all analyses, I used the ‘svy’ family of commands in Stata v.13, employing sampling weights to provide nationally representative estimates and to account for the complex sampling design.
Results
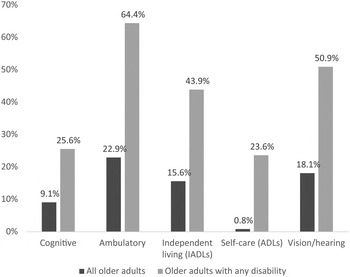
Thirty-six per cent of older adults had a disability in 2012. Among individuals with any disability, the mean number of disabling conditions was just over two (2.08), whereas the mean number of disabling conditions for the full population was 0.74. Figure 1 displays the frequency of each disabling condition for the full population of older adults and for older adults with at least one disability. In both cases, the most common condition was an ambulatory disability (23% of all older adults and 64% of older adults with any disability had an ambulatory disability.) The least common disabling condition was limitations in self-care (ADLs), with less than 1 per cent of the full population of older adults having these limitations. Still, nearly one-quarter of older adults with any disability had a limitation in self-care activities.
Prevalence of disabling conditions among all older adults and among older adults with a disability.

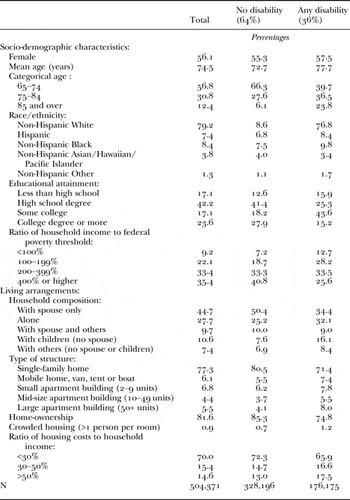
Table 1 displays sample characteristics by disability status. Individuals with disabilities were more likely to be female, older, non-White, have less than a high school degree and to live in poverty, compared with individuals without disabilities. In addition to variation by socio-demographic characteristics, there were significant differences by disability status in living arrangement. Individuals with disabilities were less likely to live with a spouse and were more likely to live alone, with children or with others. Individuals with disabilities were less likely to live in single-family homes and were more likely to live in temporary structures (e.g. mobile home, boat, tent or van) or apartment buildings. Home-ownership rates were lower among individuals with disabilities, while individuals without disabilities were less likely to spend more than 30 per cent of their income on housing costs and to live in crowded housing.
Sample characteristics by disability status

Source: American Community Survey, 2012.
Significance levels: Chi-squared differences by disability status significant at p < 0.01 for all variables.
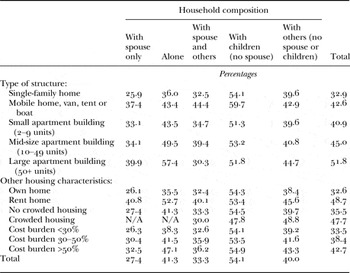
To understand better the intersection of household composition and housing characteristics by disability status, Table 2 shows disability frequency by household composition and housing characteristics. Overall, the lowest frequency of disability by type of structure was for individuals living in a single-family home (33%) and by household composition was for individuals living with a spouse only (27%). Older adults living in owner-occupied homes had a disability rate of 33 per cent, compared with 49 per cent of older adults living in rented homes. Disability was more prevalent in crowded housing, compared with non-crowded housing (48% versus 36%) and disability went up with each level of housing cost burden (34, 38 and 43%, respectively). Looking at combinations of household composition and housing type, the lowest frequency of disability was among older adults living with a spouse (only) in a single-family home (26%). The highest frequency of disability was among older adults living with children (without a spouse) in a temporary structure, such as a mobile home, boat, tent or van (60%), followed by those living alone in a large apartment building (57%). Disability frequency was higher in all household compositions for older adults who lived in rented homes, with the exception of older adults living with children, where the prevalence of disability was nearly identical among owners (54%) and renters (53%).
Frequency of disability by household composition and housing characteristics

Notes: N = 504,371. Percentages represent the frequency of disability by combination of household composition and housing characteristics. N/A: not applicable.
Source: American Community Survey, 2012.
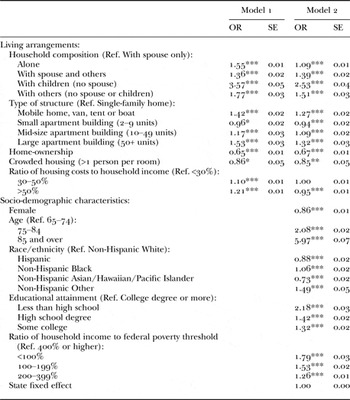
Table 3 presents odds ratios of having disability from ordered logistic regression models estimating disability on a scale from 0 to 5. Model 1 adjusted for living arrangement and finds that living alone, with a spouse and others, with children, and with non-spousal others were all associated with higher odds of disability, compared with living with a spouse only. Living in a temporary structure or mid-size or large apartment building and having a higher housing cost burden were associated with higher odds of disability, while living in a small apartment building, owning one's home and having crowded housing were associated with lower odds of disability. Model 2 adjusted for socio-demographic characteristics. The association of living arrangements with disability remained relatively consistent in direction, size and significance. The only exception was having higher housing cost burden, which became associated with lower odds of disability for cost burden of 50 per cent or higher. The latter finding was influenced by the inclusion of household income, which was significant at p < 0.001 for all three levels, relative to the reference group (federal poverty threshold 400% or higher). In sensitivity analyses (not shown), including only household income in Model 2 resulted in lower odds of disability for higher cost burden. While being female and Hispanic were both associated with higher frequencies of disability in bivariate models, they both had lower odds of disability in the multivariate model. This can be attributed to the impact of adjusting for age and poverty status, respectively. When tested in separate models (not shown), both age and poverty status had independent effects on reversing the direction of effect for gender and ethnicity, with poverty having the strongest impact.
Odds ratio (OR), p value and standard errors (SE) of disability

Notes: N = 504,371. Odds ratios generated from ordered logistic regression models estimating disability on a 0–5 scale. Ref.: reference category.
Source: American Community Survey, 2012.
Significance levels: *p < 0.05, **p < 0.01, ***p < 0.001.
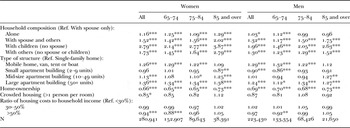
Interaction terms between gender and living arrangements and age and living arrangements were significant in models predicting disability (full results available upon request). Therefore, I ran sub-group analyses by age and gender. Table 4 shows the odds ratios of disability by living arrangements separately by gender and age category, generated from fully adjusted ordered logistic regression models. The odds of disability for women living alone was elevated for all age groups, compared with women living with a spouse only. For men living alone, the odds of disability were highest in the 65–74 age group, compared with individuals aged 75 and older, where they were not significantly different from men living with a spouse only. For men and women in all age groups, living with children (without a spouse) was associated with the highest odds of disability and the size of this association was greatest among older adults aged 85 and over. Across all age groups, the odds of disability for individuals living with anyone other than a spouse only was higher for women than for men, yet odds increased by age at similar rates. For women and men younger than 85, living in a temporary structure was associated with higher odds of disability, compared with living in a single-family home. For both men and women, living in a large apartment building was significantly associated with higher rates of disability for all three age groups, whereas the association was less consistent for small and mid-size apartment buildings. For both men and women across all age groups, living in an owner-occupied house (versus renting) was associated with lower odds of disability.
Sub-group ordered logistic regression results with odds ratios of disability

Notes: Results presented as odds ratios generated from fully adjusted ordered logistic regression models. Ref.: reference category.
Source: American Community Survey, 2012.
Significance levels: *p < 0.05, **p < 0.01, ***p < 0.001.
Discussion
I found that 36 per cent of older adults had a disability in 2012, as defined by having one or more of the six disabilities asked about in the ACS, consistent with other estimates of disability among older adults using the ACS (Brault Reference Brault2008; Erickson, Lee and von Schrader Reference Erickson, Lee and von Schrader2012). On a bivariate level, individuals with disabilities were less likely to live with a spouse and were more likely to live alone, with children or with others than their counterparts without disabilities. They were also more likely to live in apartment buildings and temporary structures, to live in rented homes, to have crowded housing and to have higher housing cost burden than older adults without disabilities. Comparing various combinations of housing type and household composition, disability was most commonly found among older adults living with their children in single-family homes or temporary structures and among older adults living alone in large apartment buildings. Because the ACS is unable to specifically identify assisted living facilities, the latter may be a facet of older adults with disabilities moving into larger, supportive apartment buildings for the services they provide. Still, some of these large apartment buildings may offer lower-quality and less-supportive housing than other types of housing. Future research should attempt to understand better differences in quality, accessibility and appropriateness within types of houses. Disability was least common among older adults living with a spouse only in single-family homes or mid-size apartment units. This may be largely related to age; married older adults tend to be younger and have fewer disabilities. As individuals age and develop functional limitations, they may move to other types of structures (provided they have the means to do so). Disability was less common among older adults who lived in owned homes for all household compositions except living with children, when disability was slightly more common in rented homes.
Multivariate analyses revealed significant differences in the odds of disability by living arrangement, even after adjusting for socio-demographic characteristics such as gender, age and socio-economic status. Living alone, with children or with others was associated with higher odds of disability, compared with living with a spouse only. Living in a temporary structure or large apartment building was also associated with higher odds of disability, while living in a small or mid-size apartment building was associated with lower odds of disability, compared with living in a single-family home. The relationships between disability and household composition remained relatively consistent in sub-group analyses by gender and age category. However, the odds of disability by household composition and housing type were higher for women than men in all age sub-groups. In particular, living alone was associated with higher odds of disability for women in all age groups, whereas it was only associated with disability for men younger than 75. This provides an indication that women with disabilities are more likely to live alone at older ages than men.
As the older adult population is growing and as more older adults continue to live in the community than ever before, a more nuanced picture of the living arrangements of those with disabilities becomes critical. This is especially important in the wake of policy changes that have encouraged the movement of people out of institutions and into home and community-based settings (Altman and Blackwell Reference Altman and Blackwell2014). State and federal agencies need more detail on where, and with whom, community-dwelling older adults with disabilities live in order to assess demand for long-term services and supports effectively (Altman and Blackwell Reference Altman and Blackwell2014). Further, it is important to understand how disability status varies by both household composition and housing characteristics, as they are intricately tied, but rarely studied in conjunction.
State policies targeting community-dwelling older adults with the goal of keeping them out of institutions need to be grounded in solid demographic evidence about the target population. Particular concern should be paid to the 6 per cent of older adults in this study (representing an estimated nearly 2,350,000 Americans aged 65 and older) who live in temporary structures, such as mobile homes, boats, vans and tents. Disability was more common in these structures than in many of the other structures studied. Yet, it is likely that such temporary structures were not built to accommodate disability and may lead to increased risk of further impairment. Future research should investigate the quality of each type of structure and heterogeneity within them, especially by socio-economic status of the older adults living within them.
The results of this paper should be considered in light of certain limitations. First, the cross-sectional nature of the data only allows for descriptive analyses and cannot address the endogeneity inherent in the relationship between living arrangements and disability. Many people may be living in their current arrangement because of disability, in order to receive care from co-resident care-givers or supportive housing units. However, we should not assume that all the individuals in this study moved because of a disability. Many of them, instead, may be stuck in unsupportive housing situations, unable to move despite a desire to do so, because of constrained resources. Such constrained housing might lead to further diminished mental and physical health (Strohschein Reference Strohschein2012). Further, the disability measures included in the ACS are broad and those measuring IADL limitations may reflect more than just health, including language barriers, difficulty with transportation or unfamiliarity with one's neighbourhood environment. Still, the ACS disability measures are commonly used (Brault Reference Brault2008; Erickson, Lee and von Schrader Reference Erickson, Lee and von Schrader2012) and allow for comparison with other studies.
The housing measures in this paper are also limited by what the ACS collects. Future research should make use of other data sources, including the Health and Retirement Study or the National Health and Aging Trends Study to add more nuances to the housing measures, including safety features and home modification measures. It would be particularly useful to add measures of housing quality and of metropolitan status and neighbourhood environment to understand better the physical environment of different types of housing structures. Finally, while the ACS distinguishes between institutional and non-institutional settings, it does not clearly identify assisted living facilities. Future research should attempt to understand better the differences between types of apartment buildings and how disability prevalence varies by type. However, definitions of assisted living facilities vary widely in their structure and services offered (Kane, Chan and Kane Reference Kane, Chan and Kane2007), so such research is not as simple as identifying whether older adults live in such facilities or not.
Additional directions for future research include in-depth analysis of differences by state. Age structure and disability prevalence vary by state, so we can expect that living arrangements of individuals with disabilities will vary, too. Smith et al. (Reference Smith, Rayer, Smith, Wang and Zeng2012) examined this, but did not go into detail on household composition or housing characteristics. Further, there is room for investigation among particular sub-populations, such as the Medicaid-eligible population, to see what role Medicaid HCBS play in living arrangements for older adults with disabilities. Finally, there is a need for high-quality qualitative research in this area, as there is a dearth of research asking older adults themselves about their housing preferences (Wagner, Shubair and Michalos Reference Wagner, Shubair and Michalos2010).
Future studies of the demography of disability should consider both the physical and social elements of people's living arrangements (Harrison Reference Harrison2004). Disability is not uniformly experienced and is impacted by various elements of one's social and physical surroundings. In future years, the need for accessible and supportive housing will continue to grow as the population ages, and policy makers, developers and planners should pay particular attention to designing homes that will accommodate multiple types of disability (Smith et al. Reference Smith, Rayer, Smith, Wang and Zeng2012), as well as homes that can house multiple household compositions. This paper demonstrates that older adults live in a wide variety of settings, yet most senior housing (e.g. assisted living) is designed for one or two individuals. Given the changing household and family structure in the USA and the increase in multigenerational household structures (Taylor et al. Reference Taylor, Passel, Fry, Morin, Wang, Velasco and Dockterman2010), especially as cultural norms change with shifting demographics and immigration trends, it may be less appropriate to focus solely on building supportive housing units where older adults must live alone or with a spouse only. Still, the simultaneous growth of individuals of all ages living alone (Klinenberg Reference Klinenberg2012) makes it important to grow the stock of affordable and easily manageable housing for individuals living alone, especially with disabilities.
Currently, there is a lack of accessible housing to accommodate individuals with disabilities (Smith et al. Reference Smith, Rayer, Smith, Wang and Zeng2012). While this should be of concern for individuals living in inappropriate housing now, it should also serve as a call for new home building and remodelling to be universally accessible (Pynoos, Caraviello and Cicero Reference Pynoos, Caraviello and Cicero2009) and to take multiple family and household compositions into account. In order to support older adults in ageing-in-place and to increase the chances that they live in supportive environments, policy makers and planners should take all types of housing and living arrangements into consideration, not just focus on the development of exclusively senior living facilities. This paper provides a baseline from which to understand the various arrangements in which older adults with disabilities live and to see where needs might be greatest. This information will be vital for tracking future trends in living arrangements and disability, and offers a more detailed understanding of the demography of disability in US households than is currently available.
Acknowledgements
The author would like to thank Donna McAlpine, Tetyana Shippee, Rosalie Kane, Phyllis Moen, Ben Capistrant and Bryan Dowd for their feedback on earlier versions of the paper. This paper was supported by the Interdisciplinary Doctoral Fellowship from the University of Minnesota and the Minnesota Population Center (NIH Grant Number R24HD041023), funded through grants from the Eunice Kennedy Shriver National Institute for Child Health and Human Development. All findings and opinions in this paper are the responsibility of the author and not of the University of Minnesota or the Minnesota Population Center. This paper uses publicly available, de-identified data. It was exempted from review by the University of Minnesota Institutional Review Board. The author conceptualised the study, carried out all background research and analysis, interpreted the findings and wrote the paper. There are no conflicts of interest to report.