

Introduction
Why do men hold less green views compared to women? This question has attracted the attention of researchers for more than 30 years. Compared to men, women are more environmentally oriented (Blocker and Eckberg Reference Blocker and Eckberg1997; Langsæther and Knutsen Reference Langsæther and Knutsen2024; McCright and Xiao Reference McCright and Xiao2014), worry more about climate (Knight and Givens Reference Knight and Givens2021; McCright et al. Reference McCright, Marquart-Pyatt, Shwom, Brechin and Allen2016; McCright and Xiao Reference McCright and Xiao2014; Poortinga et al. Reference Poortinga, Whitmarsh, Steg, Böhm and Fisher2019), and engage more in eco- and climate-friendly behavior (Brough et al. Reference Brough, James, Ma, Isaac and Gal2016; Casado-Díaz et al. Reference Casado-Díaz, Sancho-Esper, Rodriguez-Sanchez and Sellers-Rubio2020; Hunter, Hatch, and Johnson Reference Hunter, Hatch and Johnson2004; Kennedy and Kmec Reference Kennedy and Kmec2018). Women also more often vote for Green parties (Dolezal Reference Dolezal2010; Knutsen Reference Knutsen2001; Knutsen and Langsæther Reference Knutsen, Langsæther and Knutsen2018; Langsæther Reference Langsæther2023; Schumacher Reference Schumacher2014), and parties with a pro-environmental political platform (Shorrocks Reference Shorrocks2021). However, the reasons behind this empirical regularity are still being discussed.
Bush and Clayton (Reference Bush and Clayton2023) argue that men are less concerned about climate change, compared to women, because men perceive the economic cost of climate mitigation as greater. However, they also find that in addition to the economic cost, men also experience a greater psychological cost of climate mitigation and adjusting to societal change. But where does this greater psychological cost originate? What psychological social barrier stands in the way of boys and men adopting climate change concerns?
When it comes to the gender gap in environmental concerns, the research is more varied. An early explanation is that women are more worried about the environment because they are less risk-tolerant (Bord and O’Connor Reference Bord and O’Connor1997). There is also research finding that men, especially white men, are more accepting of risk in general and therefore also environmental risks (Marshall et al. Reference Marshall, Picou, Formichella and Nicholls2006). Another proposed explanation for the gap in environmental concern is that women are more other-oriented and socially responsible (Zelezny, Chua, and Aldrich Reference Zelezny, Chua and Aldrich2000), more altruistic (Dietz, Kalof, and Stern Reference Dietz, Kalof and Stern2002), and are more empathic and less oriented toward social dominance (Milfont and Sibley Reference Milfont and Sibley2016). Others have found that the personality traits conscientiousness, agreeableness, and neuroticism mediate the gender gap in pro-environmental attitudes (Desrochers et al. Reference Desrochers, Albert, Milfont, Kelly and Arnocky2019). However, less research has been dedicated to explaining why more women than men vote for the Green and pro-environmental parties. This is despite women being overrepresented among green voters, a trend that has been stable over time (Zinober Reference Zinober2026).
What is the source of the Green Gender Gap? I theorize that the Green Gender Gap is rooted in early-life gender socialization. Gender socialization teaches children the roles and expectations associated with women and men (Bem Reference Bem1981; Stockard Reference Stockard2006; West and Zimmerman Reference West and Zimmerman1987), shaping value priorities that later inform political attitudes and behavior (Schwartz, Caprara, and Vecchione Reference Schwartz, Caprara and Vecchione2010). To test this notion, I investigate the Green Gender Gap among adolescents. A key motivation for focusing on this age group is to assess whether the gender gap emerges before individuals leave their childhood households. Studying adolescents allows me to capture attitudes at a stage when gendered influences are still primarily shaped by the family and immediate social environment. It also helps disentangle the role of early-life socialization from later experiences. The empirical investigations in this article rely on two complementary studies. In the first study, I use the Norwegian Youth Survey (UngData), which in recent years has included a question on worry about climate change. I found that girls are more worried about climate change than boys, regardless of their school grade. The findings show that the gender gap in climate change concern is already observable at age 13, the earliest age at which data are available. Whether the gap emerges before this point cannot be determined in this study. In the second study, I use the Norwegian School Election Survey, which measures political attitudes and behaviors among Norwegian pupils aged 15 to 18. I find that more girls are concerned with environmental issues and prioritize environmental protection over industrial development and oil production. The gap is already present among first-year students who have just started upper secondary school at age 15 to 16. This finding indicates that the gender gap in environmental views results from the experiences teenagers have had before starting high school. I also find that girls are more likely to vote for the Green Party in mock school elections, and that girls become increasingly supportive of green parties as they progress from the first to the third year of high school.
In contrast, there is no increased mobilization among boys as they get older. In the final years of upper secondary school, teenagers are in the early stages of forming party preferences that may carry into their adult voting behavior. By the time they leave school, they are voting for the first time and beginning to develop initial political orientations (Dinas Reference Dinas2014; Rekker et al. Reference Rekker, Keijsers, Branje and Meeus2015). The findings suggest that political gender socialization plays a key role in creating the Green Gender Gap.
The gender gap in pro-environmental attitudes emerges while most girls and boys still live at home, and well before structural gender-sorting mechanisms such as educational tracking or career choices come into play. The data document when the gap becomes observable, even if they cannot show precisely when or how it is formed. Moreover, the gap exists under conditions of high institutional gender equality: in the Norwegian context, there is limited scope for structural forces alone to produce it, which strengthens the case that it is shaped by informal socialization processes operating within these formally equal structures. Taken together, the timing, context, and persistence of the gap point to early-life political socialization as a central source. Later-life gender differences related to occupation, education, and income may still contribute to gendered views on climate and the environment. However, this study shows that the Green Gender Gap already exists prior to the onset of such gendered experiences.
I conclude by arguing that the Green Gender Gap in adolescence is most likely to be found in affluent contexts where climate and environmental issues are coded in similar gendered ways to those observed in Western democracies. I further discuss avenues for future research, particularly the need to investigate directly the mechanisms implied by the findings in this article.
Early-Life Gender Socialization and Political Learning
From the day we are born, most people are assigned a social gender based on their biological sex. With this assignment comes specific gendered socialization, which differs for women and men (West and Zimmerman Reference West and Zimmerman1987). Gender socialization teaches children the roles and expectations associated with their assigned gender and how they are supposed to fulfill these roles (Bem Reference Bem1981; Stockard Reference Stockard2006). The way individuals are shaped by early-life socialization and gender norms creates a gender gap in personal values (Schwartz and Rubel Reference Schwartz and Rubel2005), which again affects behaviors and political views (Schwartz, Caprara, and Vecchione Reference Schwartz, Caprara and Vecchione2010). Moreover, studies show that gender socialization begins to affect individual behavior from a very early age (Williams and Best Reference Williams and Best1990).
But why might early-life gender socialization influence people’s views on climate and environmental issues? Previous research has shown that the experiences children and adolescents have while growing up shape their relationship with nature (Chawla and Derr Reference Chawla, Derr and Clayton2012). For example, informal play and exploration of nature (Broom Reference Broom2017), as well as interactions with socializing agents such as family and peers (Casaló and Escario Reference Casaló and Escario2016; Collado, Evans, and Sorrel Reference Collado, Evans and Sorrel2017), have all been found to play a role. In many Western contexts, girls are encouraged to be mindful of others’ needs, take on caring roles, show compassion, and value interdependence and cooperation (Dietz, Kalof, and Stern Reference Dietz, Kalof and Stern2002; Zelezny, Chua, and Aldrich Reference Zelezny, Chua and Aldrich2000). This orientation is linked to a heightened sense of empathy, which can extend beyond humans to animals and the environment (Milfont and Sibley Reference Milfont and Sibley2016).
In parallel, many boys are socialized into ideals of toughness, competitiveness, rationality, independence, and dominance both over people and nature (Connell and Messerschmidt Reference Connell and Messerschmidt2005; Mahalik et al. Reference Mahalik, Locke, Ludlow, Diemer, Ryan, Gottfried and Freitas2003). This form of socialization fosters a social dominance orientation and preference for group-based hierarchies and the maintenance of existing social orders. Social dominance is culturally coded as masculine and more strongly reinforced in the gender socialization of boys (Pratto et al. Reference Pratto, Sidanius, Stallworth and Malle1994; Wilson and Liu Reference Wilson and Liu2003). Social dominance orientation has been linked to climate change denial, as acknowledging and addressing anthropogenic climate change would require societal transformations that may threaten established hierarchical structures (Jylhä and Akrami Reference Jylhä and Akrami2015). At the same time, empirical research has found that social dominance orientation mediates the gender gap in climate change denial among the adult population (Jylhä et al. Reference Jylhä, Cantal, Akrami and Milfont2016).
A similar logic can be applied when considering the relationship between social dominance orientation and environmental concern. The desire to protect animals and nature conflicts with a hierarchical worldview that positions humans above the natural world and regards the exploitation of animals and the environment as part of the natural order (Dhont, Hodson, and Leite Reference Dhont, Hodson and Leite2016; Milfont et al. Reference Milfont, Richter, Sibley, Wilson and Fischer2013). Again, empirical research supports this notion: social dominance orientation mediates the gender gap in environmentalism (Milfont and Sibley Reference Milfont and Sibley2016).
Beyond the psychological mechanisms discussed above, gendered political socialization adds another important dimension to this argument. Girls and boys not only internalize different personal values and traits, but they also learn to relate to the political world in different ways. Bos et al. (Reference Bos, Greenlee, Holman, Oxley and Lay2022) show that gender socialization and political socialization intersect in ways that shape children’s political identities from an early age. As children grow up, they come to perceive politics as a male-dominated domain, and with age, girls increasingly see political leadership as incompatible with their own gender identity, expressing lower levels of political interest and ambition than boys (Bos et al. Reference Bos, Greenlee, Holman, Oxley and Lay2022; Stoker and Bass Reference Stoker, Bass, Edwards, Jacobs and Shapiro2011). There is also evidence that the formal educational environment reproduces, rather than corrects, the gender gap in political confidence. In their research, Matthieu et al. (Reference Matthieu, Erzeel and Caluwaerts2024) and García-Albacete and Hoskins (Reference García-Albacete and Hoskins2025) find that equal curricular exposure in citizenship education raises boys’ internal political efficacy, but not girls’.
In this article, I extend this logic and argue that if children learn which forms of political participation are gender-appropriate, gendered political socialization should also teach children which political attitudes are appropriate for their gender. Recent research findings support this argument. In their study utilizing German and Swiss household data, Van Ditmars (Reference Van Ditmars2023) finds that the transmission of left-right ideology from parents to children is a gendered process. For men, the intergenerational transmission is equally strong on both the left and right of the political spectrum. However, women are less likely than men to adopt the ideological position of right-leaning parents. This results in left-leaning parents having a general advantage when it comes to having their political views reproduced by their daughters. Children are not simply absorbing whatever ideology their parents hold, but filtering political cues through gendered expectations about what orientations are appropriate for women and men.
There are some empirical findings supporting the notion that gendered political socialization might be contributing to girls and boys adopting different positions on climate and the environment. Using data from 16 European countries, Casaló and Escario (Reference Casaló and Escario2016) show that parents are more successful in transmitting their environmental concerns to daughters compared to sons. Collado, Evans, and Sorrel (Reference Collado, Evans and Sorrel2017) also find that both parents and best friends shape children’s pro-environmental attitudes, and that girls are more sensitive than boys to both. The green gender gap may therefore be reinforced across multiple socialization channels, with girls and boys differing not only in what psychological traits they develop but in how responsive they are to social cues about environmentalism.
Why would climate and environmental issues be more accessible to girls than to boys? Previous research finds that there is a cognitive association between caring for the environment and femininity among both women and men (Anshelm and Hultman Reference Anshelm and Hultman2014; Brough et al. Reference Brough, James, Ma, Isaac and Gal2016; Remsö, Bäck, and Aurora Renström Reference Remsö, Bäck and Renström2024; Swim et al. Reference Swim, Vescio, Dahl and Zawadzki2018). At the same time, the visibility of young female leaders in climate and environmental activism, for example, Greta Thunberg (Bessant, Collin, and Watts Reference Bessant, Collin and Watts2023), may also reinforce this association. Making environmentalism appear not only feminine in the abstract but also concretely associated with girls and young women. Status theory teaches us that, compared to femininity, masculinity is harder to obtain, easier to lose, and provides greater status in our society. Masculine individuals are, therefore, more concerned with protecting their masculinity from possible threats (Vandello and Bosson Reference Vandello and Bosson2013). One such protection strategy is to ensure that you are not perceived as feminine and distance yourself from things associated with femininity (White and Dahl Reference White and Dahl2006). Masculine individuals may therefore shy away from green ideology precisely because of its association with femininity. Critically, this association does not need to be consciously articulated to shape behavior, as gender socialization operates through implicit as well as explicit processes (Bem Reference Bem1981; Williams and Best Reference Williams and Best1990). Therefore, boys might learn to reject green ideas as a way of securing their status as masculine individuals, particularly when they observe older masculine figures doing the same. The Green Gender Gap is therefore not only a product of girls being drawn toward environmental concern, but also of boys being actively directed away from it.
Another possible explanation for why girls may be more supportive of green parties than boys lies in the broader ideological profile of green parties in Europe. In addition to advocating climate action and environmental protection, green parties are typically associated with a broader left-libertarian profile that combines ecological politics with progressive sociocultural values, commitments to gender equality, and ideals of participatory or grassroots democracy (Burchell Reference Burchell2002; Rüdig and Sajuria Reference Rüdig and Sajuria2020). Green parties are thus positioned within a wider cosmopolitan-left political camp that stands in contrast to authoritarian-nationalist parties (Sloam and Henn Reference Sloam, Henn, Sloam and Henn2019). Because authoritarian parties often mobilize against gender equality and women’s rights (Norris and Inglehart Reference Norris and Inglehart2019), girls may be drawn to Green parties not only because of environmental concern, but also because Green support can function as a form of gendered political alignment with a party family that affirms rather than threatens their interests as young women. It is worth noting, however, that this mechanism is likely to be less central in the specific context examined in this article. Norwegian adolescents aged 13 to 18 have less experience with the threats from authoritarian parties in the way that adult women might. The presence of the Green Gender Gap among adolescents would therefore point more strongly toward early socialization processes rather than a reactive form of gendered political alignment. Even so, the two mechanisms are not mutually exclusive and may reinforce one another over the life course.
The theoretical framework developed above points to political gender socialization as a central driver of the Green Gender Gap, operating through psychological mechanisms, gendered political learning, and differential transmission within families and institutions. If these processes are at work, their observable implications should be visible before adolescents enter the labor market or diverge into separate educational and occupational trajectories. Specifically, we would expect girls to express greater environmental concern and stronger support for green politics than boys. These expectations are captured in the following two hypotheses that will be tested in this article:
H1: Norwegian girls hold more pro-environmental views and are more worried about climate change compared to boys.
H2: Among Norwegian high school students, more girls express support for the Green Party (Miljøpartiet De Grønne [MDG]) compared to boys.
It is important to note that the empirical analyses in this article do not directly test these mechanisms. Rather, the theoretical framework developed above provides the conceptual motivation for why gender socialization might produce gaps in environmental and green political attitudes. The analyses that follow document the presence, timing, and persistence of these gaps among Norwegian adolescents. Whether the mechanisms outlined here are responsible for producing them is a question for future research that includes direct measurement of these constructs.
The Norwegian Case
Norway is a valuable case for testing this hypothesis. The first reason is the availability of two unique surveys that measure the political attitudes and behaviors of adolescents. The Norwegian youth survey is conducted in multiple schools across the country, and the large number of respondents provides robust insights into the gender gap in climate change concern among the 13- to 18-year-old age group. While the Norwegian school election survey only begins when pupils are 15 years old, it offers a unique measure of political attitudes among adolescents. Many of the survey items are adopted from the national election survey, which allows for direct comparison between adolescents’ political attitudes and those of the adult population. Additionally, because the pupils participate in a mock election and are later asked how they voted, we can measure their party preferences before the age of 18. This potentially indicates what their preferences might be once they gain the right to vote.
At the same time, Norway is a relevant case for this analysis because of its high level of structural gender equality. Girls and boys attend the same schools, have access to the same extracurricular activities, and face no formal barriers to the same opportunities. However, informal norms, peer dynamics, and gendered cultural expectations continue to shape girls’ and boys’ experiences within these equal structures. If a robust gender gap in environmental and green political attitudes persists even where formal institutional conditions are equal, this supports the argument that the gap is produced by informal socialization processes rather than structural differences.
Norway is also one of the world’s largest oil and gas exporters, and the political discussion in the country has faced a tension between environmental protection and continued petroleum development. Climate and environmental issues, and especially the question of whether to open new areas for oil drilling, have been central to the political debate for decades. Both Labor and the Conservatives have historically supported continued oil and gas development, arguing that the petroleum industry is central to Norway’s economic model. The Progress Party has been openly hostile to climate regulation, often framing environmental policy as an economic burden (Egli et al. Reference Egli, Knecht, Sigurdsson and Sewerin2025). Although the Socialist Left and the Liberal Party (Venstre) have adopted more environmentally progressive positions, both are broader left-wing or centrist parties, and environmental issues compete with other priorities. Within the Norwegian party system, the Green Party (MDG) occupies a distinctive position as the only party whose core identity is defined explicitly and almost entirely by climate action and environmental protection. The Green Party established itself as a credible political actor after its 2013 electoral breakthrough, winning its first seat in Parliament after decades of relative party-system stability (Storli Reference Storli2015). This breakthrough was facilitated in part by the decline of the Socialist Left, which had previously been the clearest parliamentary voice for environmental concerns (Jupskås and Langsæther Reference Jupskås, Langsæther, Escalona, Keith and March2023). The party lost some of this credibility as a green party after eight years in government, during which it had to compromise on climate and environmental issues as part of the Labor-led coalition. This created political space for MDG to emerge as the green choice, explicitly opposing further expansion of the fossil fuel economy.
In few countries are the economic trade-offs of environmental protection as visible and politically salient as in Norway. The petroleum industry underpins the welfare state and enjoys broad cross-party legitimacy. Norway is, therefore, a relatively hard test for the socialization argument. If the Green Gender Gap persists even in a context where the costs of green politics are unusually concrete, it points to deeply gendered orientations that remain robust even where environmental protection is closely tied to perceived economic sacrifice. This suggests that the findings should also be observable in other contexts. Secondly, because Norway is an affluent country, it may also constitute a most likely case for observing the Green Gender Gap among adolescents. Previous research finds that the Green Gender Gap is larger in the Nordic countries (Zinober Reference Zinober2026). At the same time, Bush and Clayton (Reference Bush and Clayton2023) also find that the size of the gender gap in worry about climate change correlates with GDP. As a highly affluent and post-materialist society, Norway provides especially favorable conditions for environmental protection to become a salient political issue (Inglehart Reference Inglehart1977; Reference Inglehart1997).
Study 1: Climate Change Concern Among Adolescents
Data and Estimation
I use the Norwegian Youth Survey, or UngData. The data come from a national survey that measures a variety of aspects of adolescents’ everyday lives, like relationships with parents and friends, leisure activities, health issues, the local environment, well-being, and school issues. In the 2020, 2021, 2022, and 2023 waves of the survey, a question about worry about climate change was included. Teenagers from the first year of lower secondary school to the last year of high school were asked about how worried they were about climate change. There are more than 200,000 respondents in the dataset across this time period. The ages of the respondents vary from 12–13 years (8th grade in lower secondary school) to 18–19 years (3rd grade in upper secondary school). The survey item asked the respondents to answer how worried they are about climate change on a 4-point scale. (1) Not worried at all, (2) A little worried, (3) Somewhat worried, and (4) Very worried. The data include 11 regions. All models include fixed effects for region and year, meaning that the estimates rely on within-region variation over time. Standard errors are clustered at the regional level to account for within-region correlation. Given the small number of regions, these standard errors should be interpreted with caution. To estimate the models, I use two complementary approaches. Because the dependent variable is a four-point ordinal scale, I estimate both OLS and logistic regression models. In the OLS models, the scale is treated as continuous, providing easily interpretable coefficients. In the logistic models, each response category is treated as a binary outcome, allowing me to examine whether the gender gap is concentrated in particular parts of the distribution. The estimated model takes the following form:

Where Y represents the value of the dependent variable for individual i in region r in year y. G denotes gender, and D denotes school grade. F captures fixed effects for region and year, while e denotes the error term, and standard errors are clustered at the regional level.
Results
As can be seen in Figure 1, I find that the gender gap in climate change concern remains stable from Grade 8 of lower secondary school through to Grade 3 of upper secondary school. This means that girls are more worried about climate change than boys already at age 13. It is possible that this gender divergence occurs even earlier; however, data collection only begins in Grade 8.
Gender differences in climate change worry per grade.
Source: UngData.
Note: Predicted values from OLS models in which the outcome has been standardized prior to estimation (mean = 0, SD = 1), with region and year fixed effects. Standard errors are clustered at the regional level. Error bars show 95% confidence intervals (n = 230,277). Survey item: worry about climate change (1 = Not worried at all, 4 = Very worried).

Figure 1. Long description
The x-axis represents school levels from left to right: Grade 8 age 13, Grade 9 age 14, Grade 10 age 15, V G S 1 age 15 to 16, V G S 2 age 16 to 17, and V G S 3 age 17 to 18. The y-axis measures Worry about climate change as a standardized value ranging from negative 0.25 to 0.50. A legend on the right identifies two lines: a top yellow line for Girls and a bottom teal line for Boys.
* The Girls’ line starts at approximately 0.23 in Grade 8 and shows a steady linear increase across the grades, peaking at nearly 0.48 in V G S 3.
* The Boys’ line starts lower at approximately negative 0.16 in Grade 8, remains relatively flat or slightly declining through V G S 2 at negative 0.20, and then shows a sharp upward trend to approximately 0.01 in V G S 3.
* Vertical error bars representing 95 percent confidence intervals are present at each data point, showing no overlap between the two gender groups at any grade level.
From the second to the final year of upper secondary school, there is a significant increase in concern about climate change among both girls and boys. However, the increase is greater among boys, and the gender gap becomes smaller. Because Figures 1 and 2 are pooled across survey waves, this pattern reflects differences across grade levels rather than change over time. One possible explanation for this may be the change in the composition of the sample. Only pupils preparing for higher education complete the third year of upper secondary school. Pupils in vocational programs, learning a skilled trade, typically finish after Year 2 and either continue their studies through an apprenticeship or enter the workforce. The observed shift in climate change concern between the second and third years is most likely a result of vocational students no longer being included in the sample. This means that the sample in the final year is compositionally different from the sample in earlier years. Unfortunately, the survey does not provide the necessary background variables to investigate possible interaction effects between gender and study program. Figure 2 shows the predicted probabilities of selecting each of the four answer categories per grade. The estimates are based on logistic regression models assessing the predicted probabilities for girls and boys at each grade level. The findings reinforce the pattern shown in Figure 1. Boys are significantly more likely than girls to report that they are not at all worried about climate change across all age cohorts. There is no gender gap among those responding that they are “a little” worried, but more girls than boys respond that they are “quite” or “very” worried.
Gender differences in climate change concern per grade.
Source: UngData.
Note: Predicted probabilities from logistic regression models. Models include fixed effects for region and year. Standard errors are clustered at the regional level. Error bars show 95 percent confidence intervals (n = 230,277). Survey item: Worry about climate change (1 = Not worried at all, 4 = Very worried).

Figure 2. Long description
A multi-panel line graph with four panels arranged horizontally. The Y-axis for all panels is Worry about climate change, ranging from 0 percent to 50 percent. The X-axis for all panels lists educational levels: Grade 8, Grade 9, Grade 10, V G S 1, V G S 2, and V G S 3. Two lines are plotted in each panel: a teal line for Boys and a yellow line for Girls, both with vertical error bars.
* Panel 1 (1 Not at all worried): Boys show a slight upward trend from 24 percent to 28 percent before dropping to 21 percent at V G S 3. Girls remain consistently lower, around 10 percent, decreasing slightly to 7 percent.
* Panel 2 (2 A little worried): Both genders start high at nearly 50 percent in Grade 8 and show a gradual downward trend to approximately 42 percent by V G S 3, with the lines frequently overlapping.
* Panel 3 (3 Quite worried): Girls show a steady increase from 32 percent to 37 percent. Boys remain significantly lower and relatively flat, fluctuating between 21 percent and 26 percent.
* Panel 4 (4 Very worried): Both genders show a linear increase from Grade 8 to V G S 3. Girls increase from 10 percent to 17 percent, while boys increase from 5 percent to 10 percent, maintaining a consistent gap.
The standardized gender gap in climate concern among adolescents ranges from 0.21 in grade 8 to 0.28 in the final years of upper secondary school (Table A.8 in the appendix). This is virtually identical to the gap observed across all adult age cohorts in the Norwegian Citizen Panel, where standardized coefficients range from 0.19 to 0.25 (Table A.7 in the appendix). The gender gap in climate concern is therefore not an artifact of adult life experiences, but it is already formed by early adolescence and remains stable across the life course. This suggests that the Green Gender Gap in climate concern is not primarily a product of adult experiences but is already close to its adult magnitude by early adolescence, a finding consistent with the socialization argument I develop in this article.
Study 2: Support for Green Political Ideology Among Adolescents
Data and Estimation
The Norwegian school election is a national mock election in which Norwegian upper secondary school students vote for their preferred political party. It is held every second year, shortly before either the local or national election, and the participants are between 15 and 18 years old. Participation in the school election is not formally compulsory, but it is organized across Norwegian upper secondary schools as part of civic education and typically takes place during school hours. Election campaigns and debates are also held at the schools, and students are generally expected to participate as part of school activities. The results of the school election are reported and often discussed in the national media.
Following the school election, a nationally representative survey is conducted in which students are asked about their political views and what they voted for in the mock election. All schools that participate in the school election are offered the opportunity to take part in the survey, which is conducted in September, shortly after the first semester has started. The post-election survey is voluntary and administered anonymously during school hours in classrooms. This institutional setting reduces the risk of strong individual self-selection, although some participation bias cannot be entirely ruled out. In particular, more politically interested or engaged students may be more likely to participate, and students who are absent on the day of the survey are not included. There may also be some variation in participation across schools depending on how the survey is implemented locally.
Norwegian upper secondary school consists of three grades: First grade, second grade, and third grade. It is also divided into two types of study programs: those preparing for higher education (three years in school) and vocational programs, where students learn a skilled trade (two years in school). Private schools are uncommon, and most students attend the school located closest to their home.
The data series spans from 1995 to 2025, and the survey is administered in the autumn, shortly after the start of the semester. The research methods I employ are OLS regression and logistic regression, with fixed effects for region and election year, and clustered standard errors on region. The data include five regions, and all models include fixed effects for region and year. The estimates, therefore, rely on within-region variation over time. Standard errors are clustered at the regional level to account for within-region correlation. Given the small number of regions, these standard errors should be interpreted with caution.
To study gender gaps in climate and environmental issues among Norwegian teenagers, I investigate five dependent variables. The first variable is a measure of the salience of environmental issues. The survey item asks respondents to indicate how important environmental issues are when deciding which party to support, using a 1 to 5-point scale. When analyzing this dependent variable, I will also control for which party the student voted for in the mock school election, as the causal direction is difficult to establish. The second item asks respondents to consider environmental protection versus higher living standards, and to place themselves on a 1 to 10-point scale. Higher values indicate that environmental protection is prioritized over the standard of living. The third survey question asks respondents to rate, on a 1 to 5-point scale, how much they support industrial development to secure economic growth even at the expense of environmental protection. The fourth item again asks respondents to indicate, on a 1 to 5-point scale, how much they agree with the statement that there should be oil production outside Lofoten. Because the survey items are not measured consistently across the same waves, and several of them have only limited or no overlap, I do not construct a single index but instead analyze each outcome separately. Lastly, I also examine support for the Green Party (MDG) in the school mock elections, where 1 represents support for the Greens, and 0 represents support for another party.
In every model, I include two control variables: school grade (first, second, and third grade) and study program. Pupils can enroll in different programs in upper secondary school depending on what is offered at the school they attend. The study program variable is coded into four categories: (1) University track, which is three years; (2) Electro and Technology; (3) Healthcare, Administration, and Service; and (4) Design, Media, and Agriculture. The last three categories represent vocational studies, which typically last two years.
To probe heterogeneous gender gaps, I also interact the gender indicator with four moderators. These interaction analyses are exploratory and are included to examine whether the Green Gender Gap varies across a set of central background characteristics. The first is left-right self-placement, which is measured on a 0–10 scale, where lower scores indicate more left-leaning views and higher scores indicate more right-leaning views. The second moderator is political interest, measured on a 1 to 4 scale. The third is parents’ education level, coded 1 if at least one parent has a tertiary education (college or university), and 0 otherwise. Lastly, I examine whether the gender gap differs between students enrolled in university-track programs and those in vocational programs. To estimate the models, I use OLS and logistic regression, and the estimated model is as follows:

Where Y represents the value of the dependent variable for individual i in region r in year y. G denotes gender, and I represents the interaction terms. C refers to control variables, and F captures fixed effects for region and year. e denotes the error term, and standard errors are clustered at the regional level to account for within-region correlation.
Results
First, I examine the time trends. The survey item that has been included for the longest period asks: How important are environmental issues for your party choice? Since 1997, girls have placed greater emphasis on environmental issues than boys. The size of the gap varies somewhat from election to election; however, after the 2005 election, the trends ran in parallel and remained relatively stable. There is also a visible increase in the gender gap around 2019, which may reflect the broader wave of youth-led climate mobilization in Europe during this period, especially the Fridays for Future school strikes. This suggests that when climate and environmental issues become more salient, they may mobilize girls more strongly than boys. However, even in the post-COVID elections, when the salience of climate and environmental issues declined for both girls and boys, the gap remained robust and returned to a level more similar to earlier years. This indicates that the Green Gender Gap among adolescents is not only visible when climate issues are especially salient, but also remains stable across changing political contexts.
The first survey item measuring attitudes toward the environment was introduced in the Norwegian school election survey in 1995, and once again, we see that the gender gap is present in every survey wave where the item is included. Boys are more likely than girls to agree with the statement that we still need industrial development to secure economic growth, even at the expense of environmental protection. The findings presented in Figures 3 and 4 show that the gender gap in support for environmental issues among adolescents is not a modern phenomenon but has been present since at least the mid-1990s. The gender gap in environmental concern among adolescents has existed across every generation in Norway born after the late 1970s. One possible explanation for why the Green Gender Gap is visible from the beginning of the data series is the rise of environmentalism as a political and social issue from the 1970s onwards, which may have shaped attitudes early on and in gendered ways. This suggests that the roots of the Green Gender Gap may lie in longer-term processes of political socialization linked to the emergence of environmental issues as a salient political domain.
Gender differences in environmental issues importance for party choice.
Source: Norwegian school election survey.
Note: Predicted values from OLS models in which the outcome has been standardized prior to estimation (mean = 0, SD = 1). The model includes controls for school grade, study program, and party choice, as well as fixed effects for region and election year. Standard errors are clustered at the regional level. Error bars show 95 percent confidence intervals (n = 85,394). Survey item: Environmental protection is important for my party choice (1 = Strongly disagree, 5 = Strongly agree).

Figure 3. Long description
The Y axis is labeled Environmental issues important and ranges from negative 0.4 to 0.8. The X axis represents years from 1997 to 2025 in two year increments. Two lines with error bars represent the data.
* The Girls line (yellow) consistently remains above the Boys line throughout the entire period. It starts at approximately 0.2 in 1997, dips in 1999, then rises steadily to a peak of nearly 0.5 in 2007. After a slight decline and plateau between 2011 and 2015, it reaches its highest peak of 0.7 in 2019 before sharply declining toward 0 by 2025.
* The Boys line (teal) starts near 0 in 1997, drops to its lowest point of negative 0.2 in 1999, and then follows a similar trajectory to the girls. It peaks at 0.3 in 2007 and 2019. Following the 2019 peak, it drops significantly to its lowest end point of approximately negative 0.3 in 2025.
Both groups show a synchronized sharp increase leading to 2019 followed by a steep decline toward 2025.
Gender differences in believing that, to ensure economic growth, we still need industrial development, even if it conflicts with environmental protection.
Source: Norwegian school election survey.
Note: Predicted values from OLS models in which the outcome has been standardized prior to estimation (mean = 0, SD = 1). The model includes controls for school grade, study program, and party choice, as well as fixed effects for region and election year. Standard errors are clustered at the regional level. Error bars show 95 percent confidence intervals (n = 34,942). Survey item: Industrial development is more important than environmental protection (1 = Strongly disagree, 5 = Strongly agree).

Figure 4. Long description
The x-axis represents years with labels for 1995, 1997, 1999, 2001, 2009, and 2011. The y-axis is labeled Industry over environment and ranges from negative 0.4 to 0.2 in increments of 0.2. Two distinct lines are shown.
* The top line, colored teal, represents Boys. It starts at approximately 0.05 in 1995, dips slightly in 1997, peaks at 0.13 in 1999, drops to 0.05 in 2001, reaches its highest point at 0.18 in 2009, and ends at 0.12 in 2011.
* The bottom line, colored yellow, represents Girls. It starts at negative 0.37 in 1995, dips to negative 0.39 in 1997, rises to negative 0.29 in 1999, drops to negative 0.39 in 2001, rises to negative 0.16 in 2009, and ends at negative 0.17 in 2011.
Both lines feature vertical error bars at each data point. The teal line for boys remains consistently higher than the yellow line for girls across the entire time period, indicating a stronger preference for industrial development among boys compared to girls.
Lastly, there are two other survey items measuring environmentalism, where I also find a gender gap (see figure 5 and 6). Boys are more likely than girls to agree that there should be oil production in the environmentally vulnerable marine areas outside Lofoten. Similarly, more girls than boys believe that environmental protection is more important than securing a high standard of living. I have also investigated gender trends in support for the Green Party in the mock school election (see figure 7 and 8). The 2013 national election was the first in which the Green Party won a seat in Parliament, and since the 2017 national election, there has been a gender gap in support for the party. Again, in the post-COVID elections, support for the Green Party declined among both girls and boys; however, the trends remain parallel, and the gap persists. The gender gap in climate and environmental concern is present in, and stable across, all three grades (see appendix). This indicates that girls are already more concerned about the environment before they enter upper secondary school.
Gender differences in agreeing that there should be oil production outside Lofoten.
Source: Norwegian school election survey.
Note: The model includes controls for school grade, study program, and party choice, as well as fixed effects for region and election year. Standard errors are clustered at the regional level. Error bars show 95 percent confidence intervals (n = 14,448). Survey item: Support for oil production outside Lofoten (1 = Strongly disagree, 5 = Strongly agree).

Figure 5. Long description
The Y-axis is labeled Support for oil production with values ranging from -0.4 to 0.2. The X-axis represents the years 2013, 2015, and 2017. A legend at the bottom identifies two groups: Boys (green line with circular markers) and Girls (yellow line with circular markers).
* The Boys line starts at approximately 0.13 in 2013, shows a slight linear decrease to 0.07 in 2015, and ends at approximately 0.04 in 2017.
* The Girls line starts significantly lower at approximately -0.35 in 2013, rises slightly to -0.26 in 2015, and then drops to its lowest point at approximately -0.44 in 2017.
Both lines include vertical error bars at each data point representing 95 percent confidence intervals. The gap between the two groups remains wide throughout the period, with boys consistently showing higher support than girls.
Gender differences in believing environmental protection is more important than high living standards.
Source: Norwegian school election survey.
Note: The model includes controls for school grade, study program, and party choice, as well as fixed effects for region and election year. Standard errors are clustered at the regional level. Error bars show 95 percent confidence intervals (n = 25,810). Survey item: Environmental protection is more important than high living standards (0 = Fully disagree, 10 = Fully agree).

Figure 6. Long description
The X-axis represents election years: 2013, 2017, 2019, 2021, and 2025. The Y-axis, labeled Environment over living standards, ranges from negative 0.25 to 0.50 in increments of 0.25, with a zero baseline.
Two lines with data points and vertical error bars represent the groups:
* Girls (yellow line): Starts at approximately 0.21 in 2013, rises steadily to 0.41 in 2017, and reaches a peak of roughly 0.62 in 2019. It then declines to 0.40 in 2021 and drops sharply to near 0.04 in 2025.
* Boys (teal line): Starts near 0.03 in 2013, rises to 0.14 in 2017, and peaks at 0.28 in 2019. It falls back to 0.04 in 2021 and reaches its lowest point at negative 0.29 in 2025.
Both groups follow a similar bell-shaped trajectory peaking in 2019, but the yellow line for girls remains vertically higher than the teal line for boys at every data point, indicating a consistent gender gap in environmental priority.
Gender differences in the estimated probability of voting for the Green Party in the school election.
Source: Norwegian school election survey.
Note: Predicted probabilities from logistic regression model including controls for school grade and study program, and fixed effects for region and election year. Standard errors are clustered at the regional level. Error bars show 95 percent confidence intervals. The dependent variable is a binary indicator of voting for the Green Party (MDG) in the school mock election (n = 85,532).

Figure 7. Long description
The x-axis represents election years from 1995 to 2025. The y-axis represents the predicted probability of voting Green, ranging from 0 percent to 15 percent. Two lines are plotted: a teal line for Boys and a yellow line for Girls.
* From 1995 to 2011: Both lines remain flat and nearly identical, hovering just above 0 percent.
* 2013 to 2019: Both groups show a sharp increase. The yellow line for girls rises more steeply, peaking at approximately 14 percent in 2019, while the teal line for boys peaks lower at approximately 8.5 percent in 2019.
* 2021 to 2025: Both lines show a significant drop in 2021 to around 2.5 percent for boys and 5.5 percent for girls, followed by a slight divergence where girls’ probability increases toward 6 percent and boys’ remains steady near 3 percent.
Vertical error bars are present at each data point, indicating 95 percent confidence intervals, which become noticeably larger during the 2019 peak.
Gender differences in the estimated probability of voting for the Green Party in the school election per grade among non-vocational students.
Source: Norwegian school election survey (2013–2025).
Note: Predicted probabilities from logistic regression model including controls for school grade and study program, and fixed effects for region and election year. Standard errors are clustered at the regional level. Error bars show 95 percent confidence intervals. The dependent variable is a binary indicator of voting for the Green Party (MDG) in the school mock election (n = 26,456).

Figure 8. Long description
The x-axis represents school grade in three categories: 1st Year age 15 to 16, 2nd Year age 16 to 17, and 3rd Year age 17 to 18. The y-axis represents the predicted probability of voting Green, ranging from 3 percent to 7 percent.
Two lines with error bars represent the data:
* The top line, colored yellow for Girls, shows a linear increase in probability as grade level increases. It starts at approximately 5 percent in the 1st year, rises to nearly 6 percent in the 2nd year, and reaches over 6 percent in the 3rd year.
* The bottom line, colored green for Boys, remains almost perfectly horizontal and stable across all three years, hovering consistently at approximately 3.5 percent.
Vertical error bars indicate 95 percent confidence intervals for each data point. The gap between the two lines widens as the students get older, indicating an increasing gender difference in M D G support over time.
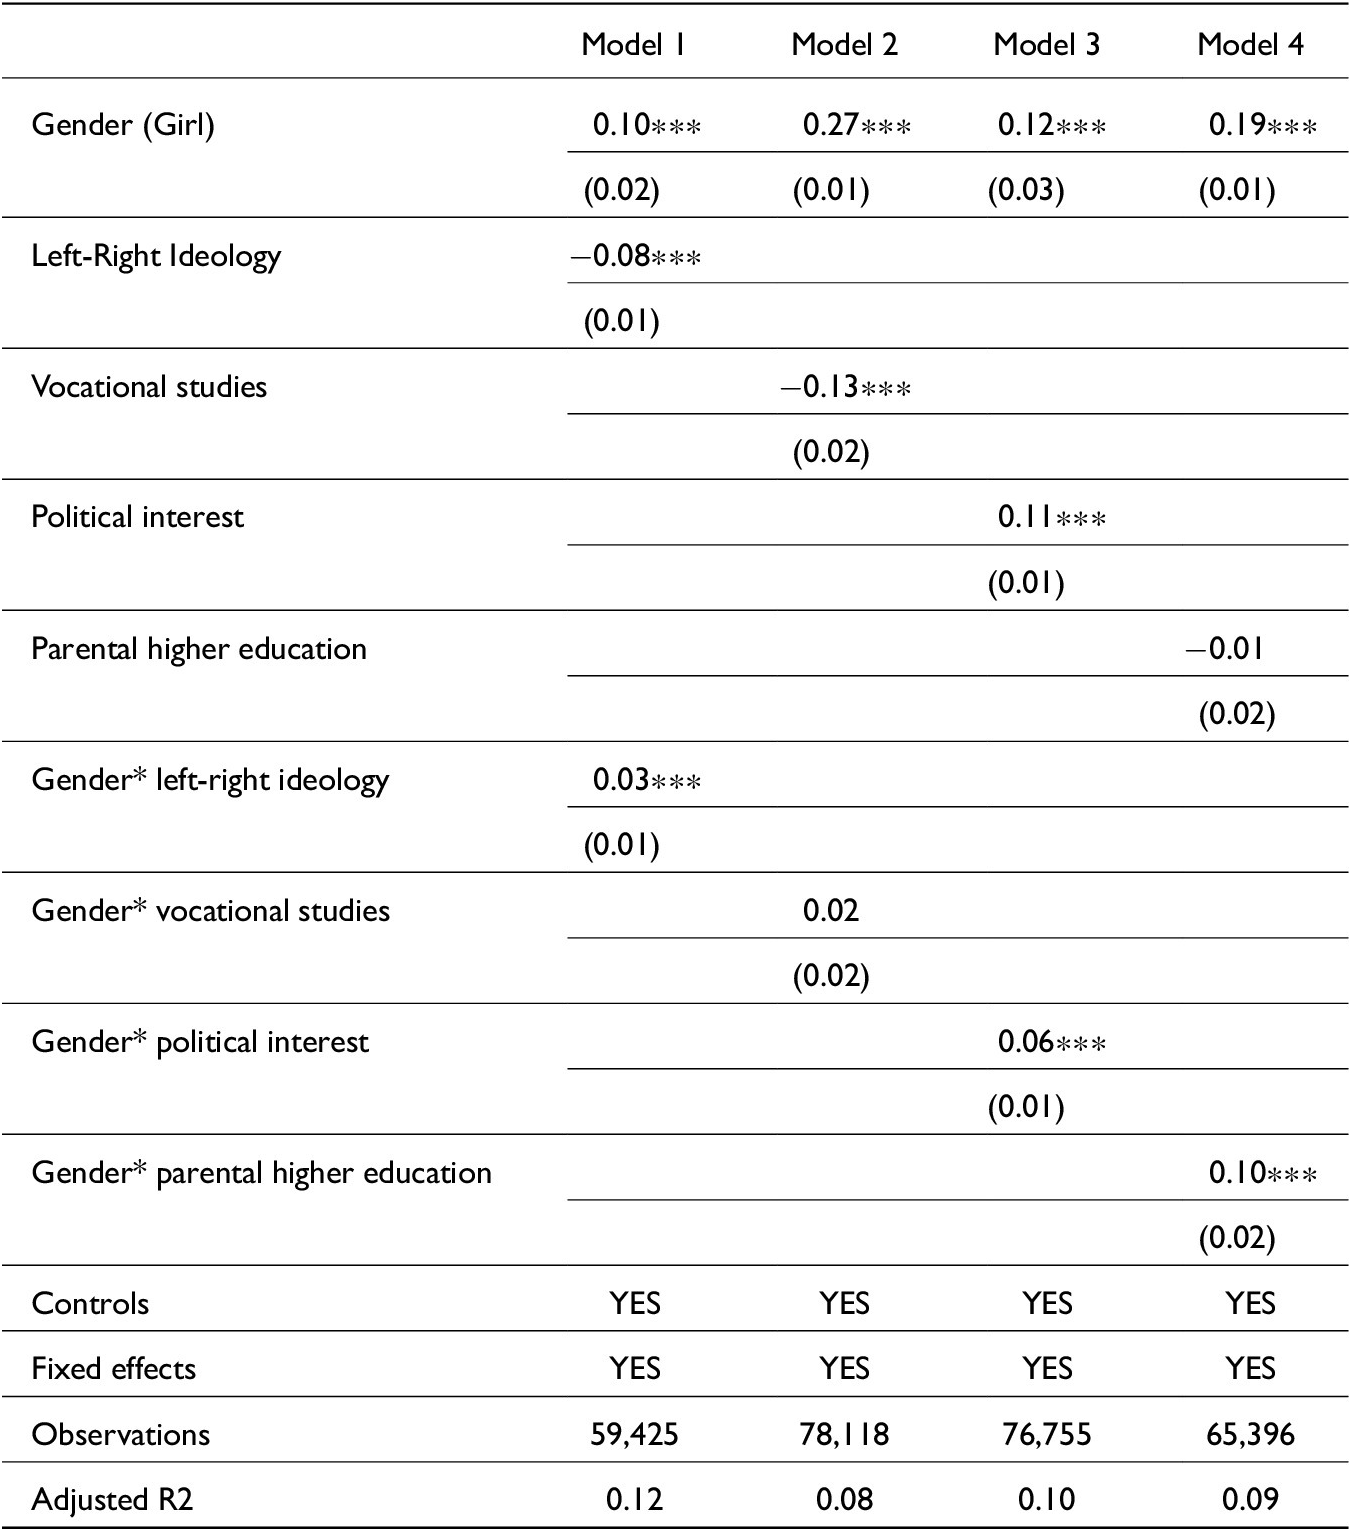
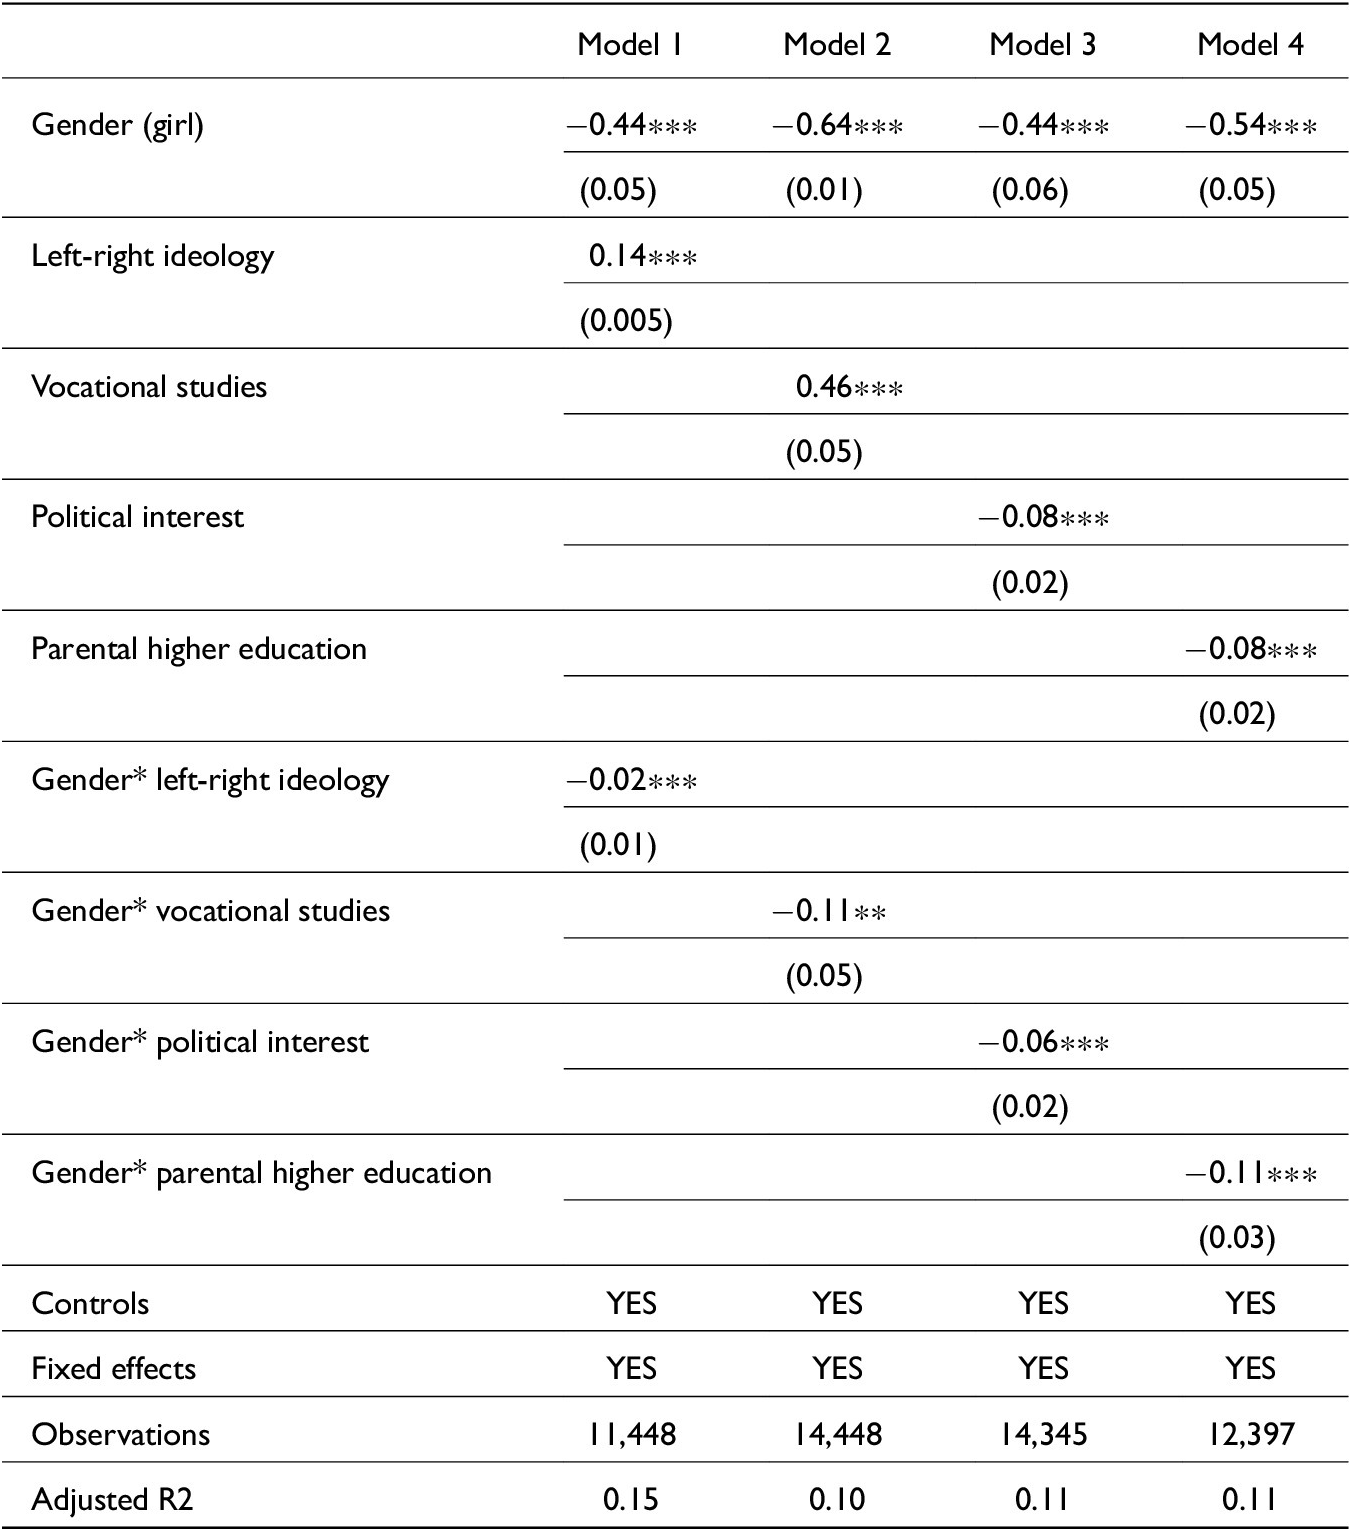
In the following section of the analysis, I explore whether there may be any heterogeneous gender effects across a set of central variables commonly investigated in political behavior research (see tables 1–4). However, none of the possible interactions fully mediates the green gender gap among adolescents. There are gender differences in political ideology, political interest, and enrollment in a vocational program. However, the gender gap remains present and statistically significant in all models. This finding echoes those results found in the adult population, where political left-right ideology, educational attainment, and occupational class do not mediate the green gender gap (Zinober Reference Zinober2026).
The first interaction I examine is left-right political ideology. Regarding the attitudinal variables, the results show that the gender gap is present across the ideological spectrum, indicating that girls hold more progressive views on climate and environmental issues than boys, both on the right and left, and that the gender gap is present across the traditional left-right divide. However, there is a small but consistent interaction effect, showing that the gender gap is largest on the right side of the political spectrum. Boys placing themselves on the left are therefore closer to girls in terms of their views on climate and environmental issues.
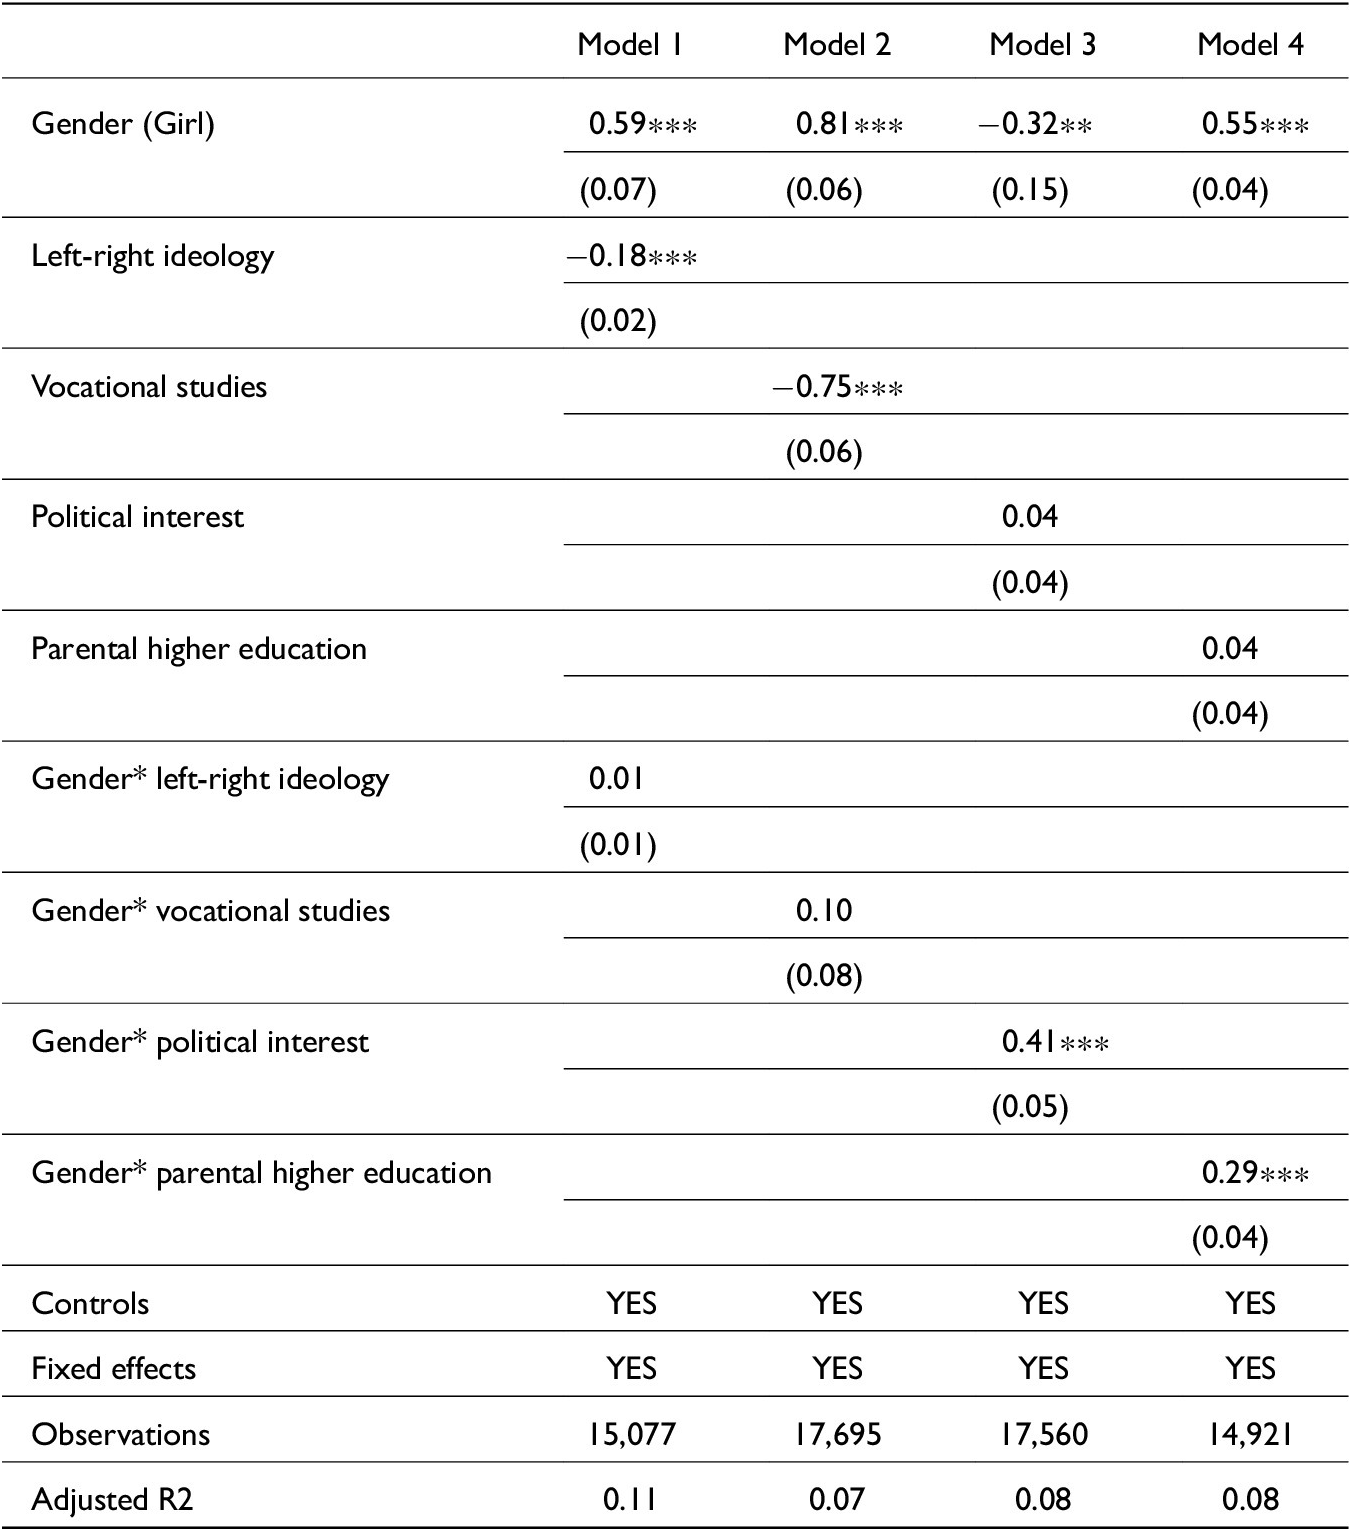
Now turning to political interest, I also see the same trend. The gender gap in climate and environmental attitudes is present across different levels of political interest, although the significant interaction term shows that the gap is bigger among pupils who report being politically interested. In Table 2, Model 3, we can see that the gender coefficient is negative, indicating that the gender gap is reduced among girls and boys who report the lowest score on political interest. However, political interest on its own has no significant effect, and the interaction term between gender and political interest is both greater than the main gender effect and positive. For believing that environmental protection is more important than high living standards, political interest does not influence boys’ attitudes, and it is only among the least politically interested individuals that boys appear slightly greener than girls. Among the most politically interested pupils, girls are much more likely to prioritize environmental protection over a higher standard of living.
The effect of gender on the importance of environmental issues in party choice

Table 1. Long description
The table consists of four columns labeled Model 1 through Model 4.
Row 1: Gender (Girl). Model 1 is 0.10 (0.02). Model 2 is 0.27 (0.01). Model 3 is 0.12 (0.03). Model 4 is 0.19 (0.01). All are significant at p < 0.01.
Row 2: Left-Right Ideology. Model 1 is -0.08 (0.01) significant at p < 0.01.
Row 3: Vocational studies. Model 2 is -0.13 (0.02) significant at p < 0.01.
Row 4: Political interest. Model 3 is 0.11 (0.01) significant at p < 0.01.
Row 5: Parental higher education. Model 4 is -0.01 (0.02).
Row 6: Gender * left-right ideology. Model 1 is 0.03 (0.01) significant at p < 0.01.
Row 7: Gender * vocational studies. Model 2 is 0.02 (0.02).
Row 8: Gender * political interest. Model 3 is 0.06 (0.01) significant at p < 0.01.
Row 9: Gender * parental higher education. Model 4 is 0.10 (0.02) significant at p < 0.01.
Bottom rows indicate that all models include Controls and Fixed effects. Observations range from 59,425 in Model 1 to 78,118 in Model 2. Adjusted R-squared values are 0.12, 0.08, 0.10, and 0.09 respectively.
Note: OLS regression. The full results are shown in the appendix. *p < 0.1; **p < 0.05; ***p < 0.01.
The effect of gender on believing that environmental protection is more important than high living standards

Table 2. Long description
The table presents coefficients and standard errors in parentheses for four regression models.
* Gender Girl: Model 1 is 0.59 (0.07); Model 2 is 0.81 (0.06); Model 3 is minus 0.32 (0.15); Model 4 is 0.55 (0.04).
* Left-right ideology: Model 1 is minus 0.18 (0.02).
* Vocational studies: Model 2 is minus 0.75 (0.06).
* Political interest: Model 3 is 0.04 (0.04).
* Parental higher education: Model 4 is 0.04 (0.04).
* Gender times left-right ideology: Model 1 is 0.01 (0.01).
* Gender times vocational studies: Model 2 is 0.10 (0.08).
* Gender times political interest: Model 3 is 0.41 (0.05).
* Gender times parental higher education: Model 4 is 0.29 (0.04).
All models include Controls and Fixed effects marked as YES.
* Observations: Model 1 has 15,077; Model 2 has 17,695; Model 3 has 17,560; Model 4 has 14,921.
* Adjusted R squared: Model 1 is 0.11; Model 2 is 0.07; Model 3 is 0.08; Model 4 is 0.08.
Statistical significance is indicated by asterisks: three asterisks for p less than 0.01, two for p less than 0.05, and one for p less than 0.1.
Note: OLS regression. The full results are shown in the appendix. *p < 0.1; **p < 0.05; ***p < 0.01.
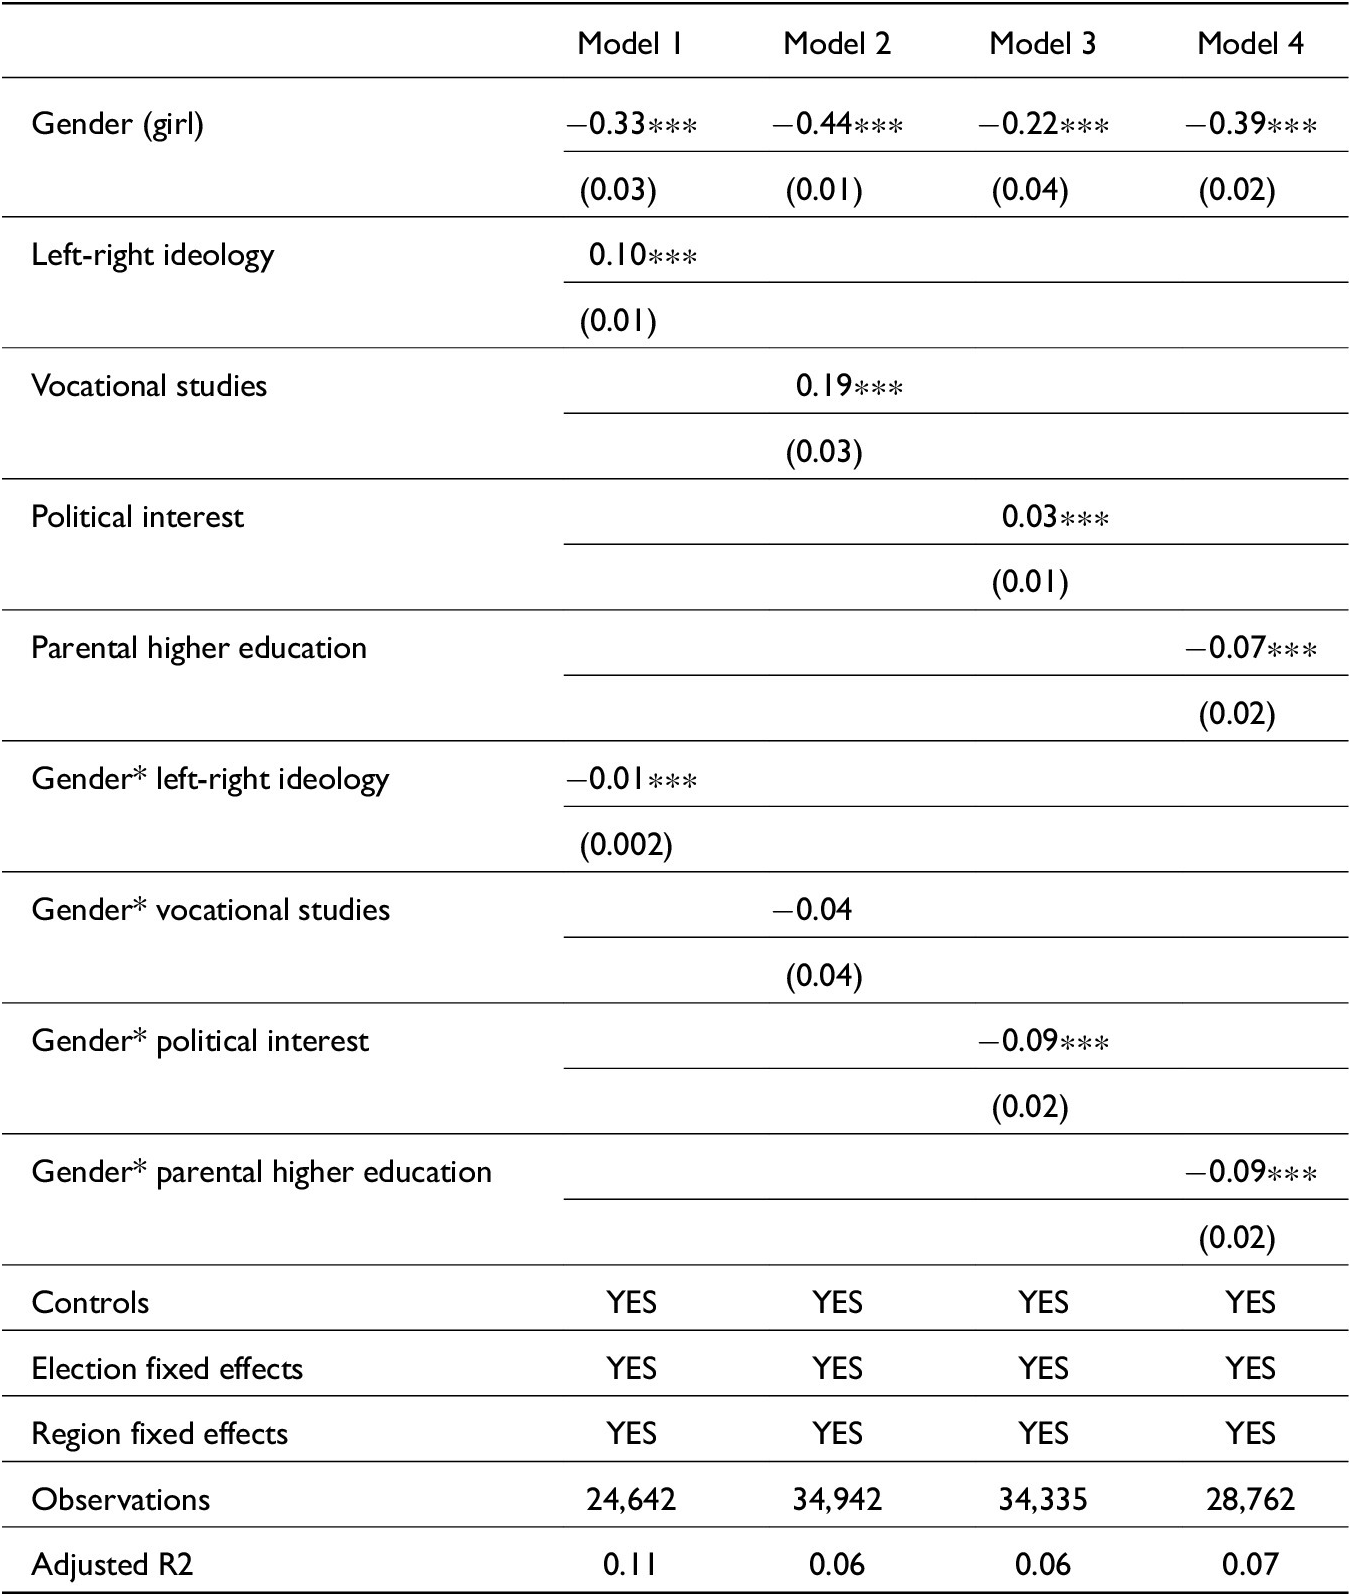
The effect of gender on believing that, to ensure economic growth, we still need industrial development, even if it conflicts with environmental protection

Table 3. Long description
The table presents O L S regression results across four models. The dependent variable is the belief that industrial development is needed for economic growth even if it conflicts with environmental protection.
Row 1: Gender (girl) shows negative coefficients in all models: -0.33 in Model 1, -0.44 in Model 2, -0.22 in Model 3, and -0.39 in Model 4. All are significant at p < 0.01. Standard errors range from 0.01 to 0.04.
Row 2: Left-right ideology (Model 1 only) has a coefficient of 0.10 (p < 0.01).
Row 3: Vocational studies (Model 2 only) has a coefficient of 0.19 (p < 0.01).
Row 4: Political interest (Model 3 only) has a coefficient of 0.03 (p < 0.01).
Row 5: Parental higher education (Model 4 only) has a coefficient of -0.07 (p < 0.01).
Interaction Terms:
- Gender * left-right ideology (Model 1): -0.01 (p < 0.01).
- Gender * vocational studies (Model 2): -0.04 (not significant).
- Gender * political interest (Model 3): -0.09 (p < 0.01).
- Gender * parental higher education (Model 4): -0.09 (p < 0.01).
All models include Controls, Election fixed effects, and Region fixed effects (marked YES).
Model Statistics:
- Observations: Model 1 (24,642), Model 2 (34,942), Model 3 (34,335), Model 4 (28,762).
- Adjusted R-squared: Model 1 (0.11), Model 2 (0.06), Model 3 (0.06), Model 4 (0.07).
Note: OLS regression. The full results are shown in the appendix. *p < 0.1; **p < 0.05; ***p < 0.01.
The effect of gender on agreeing that there should be oil production outside Lofoten

Table 4. Long description
A statistical table presenting O L S regression results for four models. The columns are labeled Model 1, Model 2, Model 3, and Model 4.
Row 1: Gender (girl) shows negative coefficients across all models: -0.44 in Model 1, -0.64 in Model 2, -0.44 in Model 3, and -0.54 in Model 4. All are significant at p < 0.01. Standard errors range from 0.01 to 0.06.
Row 2: Left-right ideology (Model 1 only) has a positive coefficient of 0.14 (0.005).
Row 3: Vocational studies (Model 2 only) has a positive coefficient of 0.46 (0.05).
Row 4: Political interest (Model 3 only) has a negative coefficient of -0.08 (0.02).
Row 5: Parental higher education (Model 4 only) has a negative coefficient of -0.08 (0.02).
Interaction terms (Gender multiplied by the variable) are all negative and significant:
- Gender and left-right ideology: -0.02 (0.01) in Model 1.
- Gender and vocational studies: -0.11 (0.05) in Model 2.
- Gender and political interest: -0.06 (0.02) in Model 3.
- Gender and parental higher education: -0.11 (0.03) in Model 4.
Bottom rows indicate that Controls and Fixed effects are ‘YES’ for all models. Observations range from 11,448 to 14,448. Adjusted R-squared values range from 0.10 to 0.15.
Note: OLS regression. The full results are shown in the appendix. *p < 0.1; **p < 0.05; ***p < 0.01.
This finding suggests that girls who are politically engaged and potentially active in political organizations are more likely to prioritize green issues when deciding which political causes to become involved with. In contrast, politically engaged boys appear to focus more on other areas of political concern. These gendered patterns of engagement point to differing political priorities, with girls showing a stronger commitment to environmentalism. This aligns with research showing that girls are over-represented among environmental organization members (Strandbu and Skogen Reference Strandbu and Skogen2000), in youth-led climate mobilizations (de Moor et al. Reference de Moor, Uba, Wahlström, Wennerhag and De Vydt2020), and that young women are more likely to lead climate organizations than young men (Bessant, Collin, and Watts Reference Bessant, Collin and Watts2023).
Turning to study programs, pupils enrolled in vocational tracks are generally less concerned about the environment. However, there is no significant interactional effect with gender except in the case of attitudes toward oil production, where a small negative interaction is observed, slightly increasing the gender gap among those in vocational education. Regardless of whether students are enrolled in a university-preparatory program or a skilled trade track, girls consistently express more progressive views on climate and environmental issues.
Moving on to growing up in a more educated household, there is a clear interaction effect between gender and parental higher education. The results show that girls express greener attitudes than boys, regardless of the educational background of their parents. At the same time, there is a small but consistent interaction effect, showing a greater gender gap among pupils growing up in families where one or both parents have higher education. Since boys and girls are equally likely to be born into more or less educated families, this interaction must stem from gender interacting with exposures that are more prevalent in households with higher educational backgrounds. A robust body of literature has shown that higher education is associated with greater support for environmental protection (Engel and Pötschke Reference Engel and Pötschke1998; Franzen and Vogl Reference Franzen and Vogl2013), concern about climate change (Poortinga et al. Reference Poortinga, Whitmarsh, Steg, Böhm and Fisher2019), and a higher likelihood of voting Green (Langsæther Reference Langsæther2023). It may be that growing up with more educated parents increases exposure to discussions about climate and environmental issues, and that this exposure operates in gendered ways, shaping girls’ attitudes more strongly than boys.
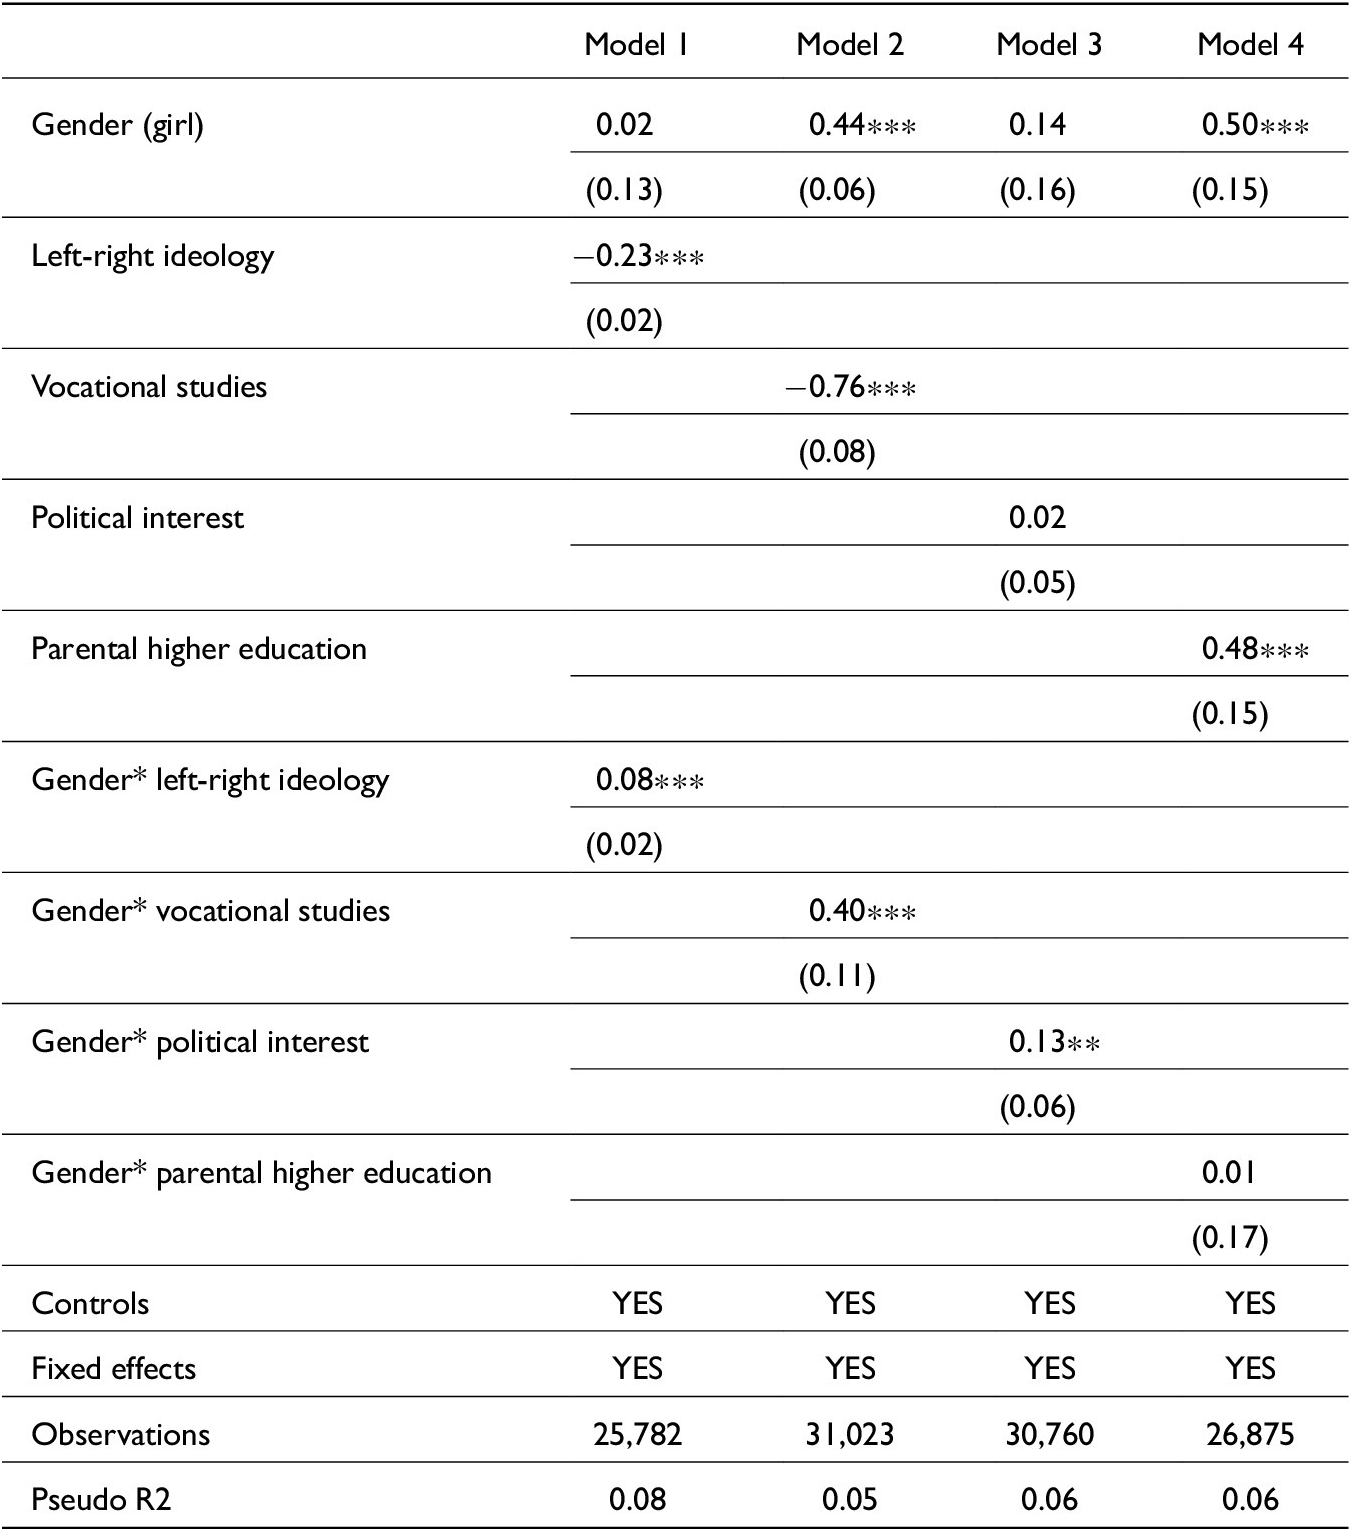
In the table 5, I present the interactional effects on support for the Green Party in the mock school election. This time, interactional effects are observed across all variables, except in relation to having parents with higher education. First, left-right political ideology is negatively correlated with support for the Greens, meaning that the further to the right a pupil places themselves ideologically, the less likely they are to vote green. At the same time, the gender coefficient is not significant, while the interaction term is positive. This indicates that on the left, there is little or no gender gap in support for the Green Party in the mock election among upper-secondary pupils. However, among those placing themselves on the right side of the political spectrum, a gender gap emerges. This mirrors the earlier finding that boys on the left are more similar to girls in holding progressive views on climate and environmental issues.
The effect of gender on propensity to vote for The Green Party in the school election

Table 5. Long description
The table consists of four columns labeled Model 1 through Model 4. Each cell contains a coefficient with standard errors in parentheses below it.
* Gender girl: Model 1 is 0.02 (0.13); Model 2 is 0.44*** (0.06); Model 3 is 0.14 (0.16); Model 4 is 0.50*** (0.15).
* Left-right ideology: Model 1 is minus 0.23*** (0.02).
* Vocational studies: Model 2 is minus 0.76*** (0.08).
* Political interest: Model 3 is 0.02 (0.05).
* Parental higher education: Model 4 is 0.48*** (0.15).
* Gender * left-right ideology: Model 1 is 0.08*** (0.02).
* Gender * vocational studies: Model 2 is 0.40*** (0.11).
* Gender * political interest: Model 3 is 0.13** (0.06).
* Gender * parental higher education: Model 4 is 0.01 (0.17).
All models include Controls and Fixed effects marked as YES.
* Observations: Model 1 has 25,782; Model 2 has 31,023; Model 3 has 30,760; Model 4 has 26,875.
* Pseudo R squared: Model 1 is 0.08; Model 2 is 0.05; Model 3 is 0.06; Model 4 is 0.06.
Significance levels are indicated by asterisks: * p < 0.1; ** p < 0.05; *** p < 0.01.
Note: Logistic regression. The full results are shown in the appendix. *p < 0.1; **p < 0.05; ***p < 0.01.
When it comes to political interest, only the interaction term is statistically significant. This implies that there is no notable gender gap in support for the Green Party among pupils who are less interested in politics. However, among those who report high levels of political interest, a gender gap emerges. Interestingly, boys’ likelihood of supporting the Green Party is not influenced by their level of political interest, which further supports the notion that politically engaged boys do not focus on or engage with climate and environmental issues. In contrast, for politically engaged girls, these issues appear to be central to their political engagement.
Perhaps the most puzzling finding is the positive interaction between gender and participation in vocational study programs. The positive gender coefficient reflects the effect in academic programs, indicating that girls in programs preparing for higher education are more likely to vote Green than boys in the same tracks. However, girls in vocational programs are even more likely to support the Green Party than their counterparts in academic tracks. In contrast, boys in vocational programs are the least likely group to vote Green overall. As a result, the gender gap in Green Party support is largest among pupils in vocational education, with girls and boys in this context moving in opposite directions. This pattern is both surprising and suggests that the vocational setting interacts with gendered political socialization.
In vocational education programs, we see the greatest divide based on traditional gender norms. Boys are more likely to enroll in technical fields such as carpentry, mechanics, or industrial work, whereas girls more often choose service-oriented tracks like hairdressing or hotel management. Girls are also disproportionately represented in programs related to childcare and healthcare. This may suggest that vocational students are more directly exposed to traditional gender roles and gendered socialization, given the clearly gendered nature of the tasks they are being trained to perform in the labor market. Moreover, students in vocational tracks are more likely to come from working-class backgrounds, a social group commonly associated with stronger adherence to traditional gender norms (Sweeting et al. Reference Sweeting, Bhaskar, Benzeval, Popham and Hunt2014). If support for the Green Party is partly linked to the performance of gendered identities, with femininity associated with environmental care and masculinity with economic production, technical work, and the use of natural resources, this could help explain why the gender gap is largest among vocational students. Girls in vocational programs may be especially likely to connect green politics with feminine-coded care orientations, while boys in the same programs may be especially likely to distance themselves from green politics because of its association with femininity.
Conclusion
This article set out to investigate the roots of the Green Gender Gap by asking whether the gap in environmental concern and support for green politics is already present in adolescence. Drawing on two large-scale Norwegian data sources, I have shown that the gender gap appears early and remains stable throughout adolescence. Girls as young as 13 report significantly more concern about climate change than boys, and by the time they are 15 or 16, girls are more likely to prioritize environmental protection and express stronger support for the Green Party. This suggests that the Green Gender Gap is not primarily a consequence of adult experiences such as occupational sorting, income differences, or household responsibilities, but is instead consistent with processes of political gender socialization, even if the present study cannot directly demonstrate the mechanisms through which socialization produces these differences.
These findings are consistent with the hypothesis advanced in this article that political gender socialization plays a central role in the creation of the Green Gender Gap. Regardless of school grade, there is a significant gender gap in views about climate and environmental issues. The gap is observable from the earliest age captured in the data, suggesting that the socialization processes that produce it precede adolescence, even if the present study cannot pinpoint when they begin. I argue that the gender socialization individuals experience from an early age and throughout the life course conditions women to be more open to green ideologies, while men are less encouraged to embrace them. Rather, boys and men may be primed to reject pro-environmental beliefs and behaviors because of their association with femininity.
Moreover, the Norwegian context strengthens the argument. The Norwegian case is instructive not because it eliminates gendered socialization, but because it demonstrates that gendered political orientations persist even under conditions of institutional equality, pointing to the resilience of informal socialization processes that operate within, rather than through, formal structures. If anything, the Norwegian case shows that even in egalitarian contexts, deeply embedded cultural norms around masculinity and femininity continue to shape how boys and girls relate to the environment and to green politics. If we want to understand how and why green ideology remains gendered in adulthood, we must start by examining the socializing processes that occur earlier in life. This includes the messages young people receive about what it means to be a boy or a girl, what is expected of them, and how they should engage with the world around them. Political gender socialization does not just shape environmental attitudes in the present. It also lays the groundwork for future political preferences and behaviors.
Now, in what political context would we expect political gender socialization to create a Green Gender Gap among adolescents? First of all, empirical results suggest that the Green Gender Gap is greater in more affluent countries (Bush and Clayton Reference Bush and Clayton2023; Zinober Reference Zinober2026). At the same time, post-materialist theory suggests that environmental protection becomes more politically salient once basic material needs are more securely met (Inglehart Reference Inglehart1977; Reference Inglehart1997). I suggest that political gender socialization is a universal mechanism operating across contexts; however, whether or not we observe a gender divide over climate and environmental issues depends on whether these issues are salient within the political context. A post-materialist political context, therefore, becomes a prior condition that enables the development of a Green Gender Gap among adolescents. A second boundary condition concerns the gender coding of political issues. While gender as a social institution is relatively stable, what is understood as feminine and masculine varies across time and place. In many Western contexts, environmentalism and green behavior have become associated with femininity (Anshelm and Hultman Reference Anshelm and Hultman2014; Brough et al. Reference Brough, James, Ma, Isaac and Gal2016; Remsö et al. Reference Remsö, Bäck and Renström2024). This suggests that the Norwegian findings are most likely to travel to other social contexts that share a similar gender coding of nature, climate action, and environmental concern to that found in Western contexts.
There is also another reason why I expect the findings in this article to be observed in contexts beyond the Norwegian one. Norway is a relatively hard test because the economy remains deeply tied to oil and gas, making the costs of climate action and environmental protection unusually visible. The fact that the Green Gender Gap nonetheless appears early and remains stable throughout adolescence points to deeper gendered orientations that remain robust even where support for green politics carries more visible economic trade-offs. For that reason, the findings do suggest that similar empirical patterns should be found in other affluent Western democracies where climate and environmental issues are central to political debate and are similarly coded as feminine political orientations.
Lastly, the results in this study document that the Green Gender Gap is present and persistent, but they cannot directly observe the mechanism. The specific processes through which children come to learn that environmental concern is more appropriate for girls than for boys remain underexplored. Future research should employ qualitative and longitudinal designs to examine more directly how gendered environmental orientations develop from early childhood. More work is also needed to explore how these early socialization mechanisms operate, including the role of family, media, education, and peer influence.
Supplementary material
The supplementary material for this article can be found at http://doi.org/10.1017/S1743923X26100932.
Acknowledgments
I am grateful to my PhD supervisor, Simon Hix, for his continuous guidance, support, and insightful feedback throughout the development of this project. Previous versions of this article were presented at the Tuesday Seminar at the Department of Political Science, University of Oslo. I thank all participants for their constructive comments and suggestions, which helped improve the article. I also thank the three anonymous reviewers for their valuable insights and constructive feedback, which significantly strengthened the manuscript.
Funding statement
This research was supported by the Research Council of Norway through PhD funding and by a four-year doctoral grant from the European University Institute.
Competing interests
The author declares none.




 Open access

