


Capsule Review
Pension fund often operate under minimum funding constraints imposed by regulators. This paper computes asset allocation strategies that are optimal in the presence of such short-term constraints, while taking into account the presence of interest rate and inflation risks, which are the two main risk factors faced by defined-benefit (DB) pension funds with inflation-linked liabilities. The optimal allocation to risky assets is shown to be a function of risk budgets that are defined as the difference between the current asset value and a floor, which is the minimum acceptable wealth such as defined in terms of the minimum funding ratio requirement. Although such strategies allow for the respect of minimum funding constraints, insurance against downside risk has an opportunity cost: the access to the performance of stocks is more limited than if no protection was required. One contribution of the paper is to show that this cost can be reduced by imposing a maximum funding ratio constraint together with the minimum constraint. Finally, we analyze the properties of the risk-controlled dynamic strategies when they are implemented in an environment that departs from the model assumptions, and we find that the benefits of such strategies are robust with respect to the presence of a number of market imperfections.
1 Introduction
Most (if not all) private and institutional investors, even those with large amounts of resources at their disposal, face a number of self-imposed or exogenously given liability commitments. Typical examples of such explicit commitments are defined-benefit (DB) pension obligations, which can be regarded as a short position in collateralized defaultable bonds issued by the sponsor company and privately held by employees. More generally, similar formal liability commitments are faced by insurance companies and commercial banks, while more implicit economic liabilities are also often found in private wealth management (Amenc et al., Reference Amenc, Martellini, Milhau and Ziemann2009) or sovereign wealth fund management (Gray et al., Reference Gray, Merton and Bodie2007). Not surprisingly given the high relevance of the problem, a variety of papers have attempted to extend dynamic portfolio selection models to account for the presence of liabilities. A first step toward a dynamic asset-liability management (ALM) model was taken by Merton (Reference Merton1993), who studied the allocation decision of a university that manages an endowment fund that faces a pre-defined expenditure programme. Sundaresan and Zapatero (Reference Sundaresan and Zapatero1997) have considered the case of a DB pension fund that is committed to make a payment indexed on past wages. They derive an optimal portfolio policy under the assumption that investment opportunities are constant. Rudolf and Ziemba (Reference Rudolf and Ziemba2004) have formulated a continuous-time dynamic programming model of DB pension fund management with a time-varying opportunity set, where state variables are interpreted as currency rates that affect the value of the pension's asset portfolio. These papers have provided a number of useful insights, notably including the introduction of a specific liability-hedging demand component in the optimal allocation strategy, as typical in intertemporal allocation decisions in the presence of stochastic state variables (Merton, Reference Merton1973). On the other hand, these papers have mostly focused on unconstrained ALM strategies, without incorporating the presence of explicit constraints on asset value relative to liability value. In a pension fund context, formal constraints on the funding ratio (formally defined as the ratio of assets relative to liabilities) have been introduced by the regulator in most developed countries in an attempt to protect the interests of beneficiaries. The relevance of funding ratio constraints has given rise to a fierce debate between advocates of a tighter regulation, not only in the US but also in Europe, and those arguing that it would only result in a severe welfare loss (see e.g., Pugh, Reference Pugh2006).
Our paper extends this literature on asset allocation decisions with liability commitments by analyzing the impact of formal funding ratio constraints in the context of a continuous-time model for intertemporal allocation decisions by a DB pension fund. Given that interest rate and inflation uncertainty are the two main risk factors impacting pension liability values, we cast the problem in a setting with stochastic interest and inflation rates and model the liabilities of the pension fund as a portfolio of inflation-indexed bonds. We assume that preferences are expressed over the funding ratio, so as to take the liabilities into account in the optimization problem. This framework is similar to that of Hoevenaars et al., (Reference Hoevenaars, Molenaar, Schotman and Steenkamp2008), but the main difference between our paper and theirs is that we do not restrict our analysis to fixed-mix strategies. Instead, we use the martingale approach to portfolio choice (Cox & Huang, Reference Cox and Huang1989) to analytically derive optimal strategies in the presence and absence of funding ratio constraints. In the unconstrained case, we confirm that the optimal strategy involves a fund separation theorem that legitimates investing in a liability-hedging portfolio, in addition to the standard performance-seeking portfolio (PSP; speculative demand). When funding ratio constraints are introduced, optimal policies, for which we obtain analytical expressions, are shown to involve a dynamic allocation to the PSP that is a function of the margin for error measured in terms of the distance between the current asset value and the minimum level allowed by funding ratio constraints.
Our paper is not the first to study the effects of minimum capital constraints on asset allocation. In a recent paper, Van Binsbergen and Brandt (Reference Van Binsbergen and Brandt2009) impose constraints of the Value-at-Risk type: the probability of an underfunding must not exceed, say, 2.5%. However, such constraints ‘in probability’ do not allow for analytical solutions to be obtained. Instead, we consider a more stringent type of constraints, by requiring that the minimum funding levels be respected almost surely. Such ‘hard’ constraints have already been considered in the literature, often implicitly through the preferences of the pension fund. For example, if the preferences are expressed over the surplus (defined as the excess of assets over liabilities) and the utility function precludes negative arguments (as in the case of constant relative risk aversion (CRRA) preferences), then any optimal policy must yield an almost surely positive surplus. A less severe funding condition can be imposed by replacing the surplus by the partial surplus, which is defined as the excess of assets over a fraction of liabilities (see Sharpe and Tint, Reference Sharpe and Tint1990). This type of implicit constraints is present in Rudolf and Ziemba (Reference Rudolf and Ziemba2004), and, even more recently, in Detemple and Rindisbacher (Reference Detemple and Rindisbacher2008). These authors introduce a general framework with stochastic investment opportunities and derive optimal strategies for defined contribution (DC) or DB pension funds. Our paper focuses on the special case of CRRA preferences and shows that the policies that are optimal in the presence of minimum funding ratio constraints can be interpreted as risk-controlled strategies that are reminiscent of constant proportion portfolio insurance (CPPI) or option-based portfolio insurance (OBPI) strategies, which they extend to an ALM context, where risk is measured relative to liabilities.Footnote 2
None of these papers, however, has considered maximum funding constraints. Such constraints are yet of practical interest, because they appear in several regulations. In the UK, for instance, pension assets must not exceed 105% of accrued liabilities. Explicit limits are also imposed on the size of pension assets in Canada and Japan. Assets that are in excess of such limits must in general be spent under various forms: contribution holidays, increase in plan benefits or negative contributions from the pension fund to the sponsor. The US pension law also mentions a ‘full funding limitation’: when it is reached, the sponsor loses part of the tax advantage to contributions.Footnote 3 In the Netherlands, there exists a target funding ratio that is a function of investment risk, and reaches 130% on average. Overall, it appears that maximum funding constraints are often imposed by tax authorities to prevent the deliberate or accidental build-up of excessive assets within the pension fund. Even when such constraints do not formally exist, it is unclear whether pension funds have any utility over exceedingly large surpluses, given the uncertainty as to who owns surpluses (Pugh, Reference Pugh2006). In this context, it seems reasonable to try and analyze how the introduction of maximum funding ratio targets would impact the optimal strategy. One of the contributions of our paper is to show that these targets would allow pension funds to decrease the cost of downside liability risk protection, while giving up part of the upside potential beyond levels where marginal utility of wealth (relative to liabilities) is low or almost zero. To the best of our knowledge, our paper is the first to provide a formal analysis of maximum funding ratio constraints. In addition to the literature on ALM, our paper is also strongly related to the literature on portfolio insurance and more generally on portfolio decisions with minimum target terminal wealth. This literature has evolved according to at least two main directions. The first strand of the literature, starting with Leland (Reference Leland1980) and extended by Benninga and Blume (Reference Benninga and Blume1985) or Franke et al., (Reference Franke, Stapleton and Subrahmanyam1998), approaches the question from a positive angle: taking as given a set of standard convex payoffs, these papers examine the features of investors’ preferences and market characteristics that would support a rational non-zero holding of these derivatives contracts. They have mostly found that only severe forms of market incompleteness and/or the presence of background risk can justify holding such payoffs. In a related effort, but moving beyond the paradigm of expected utility maximization, Driessen and Maenhout (Reference Driessen and Maenhout2007) have shown that it is only with highly distorted probability assessments that one can obtain positive portfolio weights for puts (cumulative prospect theory and anticipated utility) and straddles (anticipated utility). The second strand of the literature, initiated by Brennan and Solanki (Reference Brennan and Solanki1981), has examined the question from a more normative angle by searching for the design of optimal payoffs from the investor's standpoint. To this strand of the literature are related papers on portfolio allocation with wealth constraints, including Grossman and Vila (Reference Grossman and Vila1989), Cox and Huang (Reference Cox and Huang1989), Basak (Reference Basak1995), Grossman and Zhou (Reference Grossman and Zhou1996) or Basak (Reference Basak2002). These papers rationalize CPPI or OBPI by showing that such strategies are optimal in the presence of wealth constraints. Our paper extends this latter strand of the literature by revisiting in the presence of liability commitments the question of optimal design of non-linear payoffs and the related question of the costs and benefits of risk management.
Finally, because it focuses on portfolio choice with a liability benchmark, our paper is also related to the literature on dynamic asset allocation models with performance benchmarks. Single-agent portfolio allocation models with benchmark constraints include notably Browne (Reference Browne2000) in a complete market setting, Tepla (Reference Tepla2001), who also includes constraints on relative performance, and Basak et al., (Reference Basak, Shapiro and Tepla2006), who derive optimal strategies subject to the constraint that the probability of overperforming the benchmark is equal to a given level. Another formally related paper is Brennan and Xia (Reference Brennan and Xia2002), who studied in an incomplete market setting asset allocation decisions when an inflation index is used as a numeraire.Footnote 4 The rest of the paper is organized as follows. In Section 2, we introduce a formal continuous-time model of dynamic asset allocations decisions in the presence of liability commitments. In Section 3, we analyze the impact of formal minimum and/or maximum funding ratio constraints on optimal allocation strategies. In Section 4, we perform a series of numerical exercises highlighting the properties of these strategies. In Section 5, we test for the impact of various forms of market imperfections or incompleteness on the behavior of optimal strategies. Section 6 concludes and presents suggestions for further research.
2 A formal model of ALM
In this section, we introduce a stylized continuous-time asset allocation model for a long-term investor, e.g., a pension fund, facing liability commitments.
2.1 Stochastic model for state variables and risky assets
We let [0, T 0] denote the (finite) time span of the economy, where uncertainty is described through a standard probability space  $\lpar \rmOmega \comma {\cal A}\comma {\bb P}\rpar$. In what follows, T 0 can be thought of as the date of the last pension payment by a pension fund (after which the pension fund will be terminated), or as the duration of pension liabilities. It is to be distinguished from the investment horizon, which can be some arbitrary date denoted by T⩽T 0. We assume that financial markets are frictionless.
Regarding the liability side, inflation risk and interest rate risk appear as the two most relevant risk factors. This is because pension benefits are typically inflation-indexed, and the typically long duration of liability payments make their current value highly sensitive to changes in interest rates. In what follows, we model the nominal short-term interest rate as an Ornstein–Uhlenbeck process (Vasicek, Reference Vasicek1977) and the price index as a Geometric Brownian motion
 $$\eqalign{ \tab {\rm d}r_{t} \equals a\lpar b \minus r_{t} \rpar \,{\rm d}t \plus \sigma _{r} \,{\rm d}z_{t}^{r} \comma \cr \tab {{{\rm d}\rmPhi _{t} } \over {\rmPhi _{t} }} \equals \phiv \,{\rm d}t \plus \sigma _{\rmPhi } \,{\rm d}z_{t}^{\rmPhi } \comma \cr}$$
where zr and z Φ follow standard correlated Wiener processes under ℙ. ϕ represents the instantaneous expected inflation rate, which we assume to be constant for simplicity.Footnote 5
On the asset side, we assume that the menu of asset classes includes a unit zero-coupon bond with payoff 1 at maturity τ1 and a price B(t, τ1) at time t. So as to stay within a complete market environment, we also assume that the pension fund can trade in an inflation-indexed zero-coupon bond of maturity τ2, i.e., a bond with payoff given by  $\rmPhi _{\tau _{\setnum{2}} }$. The price at time t of the inflation-linked bond is denoted by I(t, τ2), which will be made explicit in proposition 1 below. Moreover, we assume that the pension fund can trade in a stock index whose price St evolves as
 $${\rm d}S_{t} \equals S_{t} \lsqb \lpar r_{t} \plus \sigma _{S} \lambda _{S} \rpar \,{\rm d}t \plus \sigma _{S} \,{\rm d}z_{t}^{S} \rsqb \comma$$
where λS is a constant Sharpe ratio. In addition to these assets, the pension fund can also invest in a cash account, whose value is the continuously compounded interest rate.
The dynamics of these state variables can be rewritten in vector form as
 $$\openup3\eqalign{ {\rm d}r_{t} \equals \tab a\lpar b \minus r_{t} \rpar \,{\rm d}t \plus {\bimsigma} \prime_{\hskip-2ptr} \,{\rm d}{\bi z}_{t} \comma \cr {\rm d}\rmPhi _{t} \equals \tab \rmPhi _{t} \lsqb \varphi \,{\rm d}t \plus {\bimsigma} \prime_{\hskip-2pt\rmPhi } \,{\rm d}{\bi z}_{t} \rsqb \comma \cr {\rm d}S_{t} \equals \tab S_{t} \lsqb \lpar r_{t} \plus {\sigma} _{S} \lambda _{S} \rpar \,{\rm d}t \plus {\bimsigma} \prime_{\hskip-3pt S} \,{\rm d}{\bi z}_{t} \rsqb \comma \cr}$$
where z is a three-dimensional Wiener process. Throughout the paper we assume that the information available to the investor at time t is ℱt, the augmented sigma-field generated by z up to time t.
Assuming a complete financial market, there exist prices of interest and inflation risks, λr and λΦ, hence there exists a unique price of risk vector λ, given by
 $${\bimlambda} \equals {\bimsigma} \lpar {\bimsigma} \prime \; {\bimsigma} \rpar ^{ \minus \setnum{1}} \left( {\matrix{ {{\sigma} _{r} {\lambda} _{r} } \cr {{\sigma} _{\rmPhi } {\lambda} _{\rmPhi } } \cr {{\sigma} _{S} {\lambda} _{S} } \cr} } \right)\comma$$
with σ being the volatility matrix of traded risks, that is
 $${\bimsigma} \equals \lpar \matrix{ {{\bimsigma} _{r} } \tab {{\bimsigma} _{\rmPhi } } \tab {{\bimsigma} _{S} } \cr} \rpar .$$
The vector λ defines a unique equivalent martingale measure by
 $${{{\rm d}{\bb Q}} \over {{\rm d}{\bb P}}} \equals {\rm exp}\left[ { \minus {\bimlambda} \prime {\bi z}_{T_{\setnum{0}} } \minus \textstyle{1 \over 2}\vert \vert {\bimlambda} \vert \vert ^{\setnum{2}} T_{\setnum{0}} } \right]\comma$$
and a unique pricing kernel process M through
 $$M_{t} \equals {\rm exp}\left( { \!\minus\! \int_{\setnum{0}}^{t} r_{s} \,{\rm d}s} \right){\bb E}_{t} \left[ {{{{\rm d}{\bb Q}} \over {{\rm d}{\bb P}}}} \right].$$
We are now able to write the prices of the nominal and indexed zero-coupon bonds that are available for trading.
Proposition 1
The prices of the nominal and of the real zero-coupon bonds of respective maturities τ1and τ2are given by
 $$B\lpar t\comma \tau _{\setnum{1}} \rpar \equals {\rm e}^{\alpha \lpar \tau _{\setnum{1}} \minus t\rpar r_{t} \plus \beta _{\setnum{1}} \lpar \tau _{\setnum{1}} \minus t\rpar } \quad {\rm and}\quad I\lpar t\comma \tau _{\setnum{2}} \rpar \equals \rmPhi _{t} {\rm e}^{\alpha \lpar \tau _{\setnum{2}} \minus t\rpar r_{t} \plus \beta _{\setnum{2}} \lpar \tau _{\setnum{2}} \minus t\rpar }$$
where
 $$\openup3\eqalign{ \alpha \lpar s\rpar \tab \equals \minus {{1 \minus {\rm e}^{ \minus as} } \over a}\comma \quad \tilde{b} \equals b \minus {{{\bimsigma} \prime_{r} {\kern 1pt} {\bimlambda} } \over a}\comma \quad \tilde{\varphi } \equals \varphi \minus {\bimsigma} \prime_{\hskip-3pt\rmPhi } {\bimlambda} \comma \cr \beta _{\setnum{1}} \lpar s\rpar \tab \equals \minus \tilde{b}s \plus \tilde{b}{{1 \minus {\rm e}^{ \minus as} } \over a} \plus {{\vert \vert {\bimsigma} _{r} \vert \vert ^{\setnum{2}} } \over {2a^{\setnum{2}} }}\left[ {s \minus 2{{1 \minus {\rm e}^{ \minus as} } \over a} \plus {{1 \minus {\rm e}^{ \minus \setnum{2}as} } \over {2a}}} \right]\comma \cr \beta _{\setnum{2}} \lpar s\rpar \tab \equals \left( {\tilde{\varphi } \minus {{\vert \vert {\bimsigma} _{\rmPhi } \vert \vert ^{\setnum{2}} } \over 2} \minus \tilde{b}} \right)s \plus \tilde{b}{{1 \minus {\rm e}^{ \minus as} } \over a} \plus {1 \over 2}\int_{\setnum{0}}^{s} \,\mathop {\left\Vert {{{1 \minus {\rm e}^{ \minus au} } \over a}{\bimsigma} _{r} \minus {\bimsigma} _{\rmPhi } } \right\Vert}\nolimits^{\setnum{2}} \,{\rm d}u. \cr}$$
In particular, the volatility vectors of B(·, τ1) and I(·, τ1) are given by
 $${\bimsigma} _{B} \lpar t\comma \tau _{\setnum{1}} \rpar \equals \alpha \lpar \tau _{\setnum{1}} \minus t\rpar {\bimsigma} _{r} \quad {\rm and}\quad {\bimsigma} _{I} \lpar t\comma \tau _{\setnum{2}} \rpar \equals \alpha \lpar \tau _{\setnum{2}} \minus t\rpar {\bimsigma} _{r} \plus {\bimsigma} _{\rmPhi }$$
Proof
See appendix A.1. □
2.2 Net wealth process
We consider a pension fund managing financial assets and paying a stream of pension payments. For simplicity, we do not model the stream of contributions from the sponsor company, and instead assume that it can be summarized by an initial endowment A 0 to the pension fund. This initial wealth can be invested in the stock, the nominal and the indexed bonds, and the cash account.
We denote with ωt the vector of weights describing the portfolio at time t, and with σt the volatility matrix of the stock and the two zero-coupon bonds at time t, defined as
 $${\bimsigma} _{t} \equals \lpar \matrix{ {{\bimsigma} _{S} } \tab {{\bimsigma} _{B} \lpar t\comma \tau _{\setnum{1}} \rpar } \tab {{\bimsigma} _{I} \lpar t\comma \tau _{\setnum{2}} \rpar } \cr} \rpar .$$
The value of the financial portfolio, A, evolves as
 $${\rm d}A_{t} \equals A_{t} \lsqb r_{t} \plus {\bimomega} \prime_{\hskip -2pt t} {\bimsigma} \prime_{\hskip -2pt t} {\bimlambda} \rsqb \,{\rm d}t \plus A_{t} {\bimomega} \prime_{\hskip -2pt t} {\kern 1pt} {\bimsigma} \prime_{\hskip -2pt t} \,{\rm d}{\bi z}_{t} \minus {\rm d}V_{t} \comma$$
where dVt is the payment to pensioners between dates t and t + dt. This representation can accommodate continuous payments as well as lump-sum payments at dates t 1, …, tn. In this latter case, dVt should be formally written as  ${\rm d}V_{t} \equals \sum _{i \equals \setnum{1}}^{n} l_{t_{i} } \;{\rm d}H_{t}^{t_{i} }$, where
 $H^{t_{i} }$ is an Heaviside function,
 $H_{t}^{t_{i} } \equals \mathbbm{1}_{\lcub t\geqslant t_{i} \rcub }$. In what follows, we shall sometimes consider a specific case of the discrete payment model, where a single payment takes place, at time T 0, a situation we shall refer to as the zero-coupon case. The generic case will be the generic situation, where the continuous or discrete nature of the payments is not specified.
Since the financial market is complete, the stream of future payments can be valued as the dividend flow of a financial asset. Hence, for T 1<T 2, the quantity
 $$L_{t}^{T_{\setnum{1}} \comma T_{\setnum{2}} } \equals {\bb E}_{t}^{{\bb Q}} \left[ {\int_{\left] {T_{\setnum{1}} \comma T_{\setnum{2}} } \right]} {\rm e}^{ \minus \int _{t}^{s} r_{u} \,{\rm d}u} \,{\rm d}V_{s} } \right]\comma \quad t \leqslant T_{\setnum{1}} \lt T_{\setnum{2}} \comma$$
is the price that an agent would have to pay at time t to receive the payment stream dV from date T 1 excluded to date T 2 included. We will also let:  $L_{t} \equals L_{t}^{t\comma T_{\setnum{0}} }$ denote the total liability value, i.e., the discounted value of all future liability payments, at date t. With these notations, the budget constraint (see proposition 2.2 in Cox and Huang, Reference Cox and Huang1991) becomes
 $$A_{t} \equals {\bb E}_{t} \left[ {{{M_{s} } \over {M_{t} }}A_{s} } \right] \plus L_{t}^{t\comma s} \comma \quad t \lt s.$$
Throughout the paper we take lt=ntΦt, where n is a non-negative deterministic function of time representing the size of the population to which benefits will be provided for. Since the pair (r, Φ) is Markov under ℚ,  $L_{t}^{T_{\setnum{1}} \comma T_{\setnum{2}} }$ is a function
 ${\cal L}^{T_{\setnum{1}} \comma T_{\setnum{2}} }$ of (t, rt, Φt). It's lemma then gives the volatility vector of
 $L^{T_{\setnum{1}} \comma T_{\setnum{2}} }$
 $${\bimsigma} _{L\comma t}^{T_{\setnum{1}} \comma T_{\setnum{2}} } \equals {{{\cal L}_{r}^{T_{\setnum{1}} \comma T_{\setnum{2}} } {\bimsigma} _{r} \plus {\cal L}_{\rmPhi }^{T_{\setnum{1}} \comma T_{\setnum{2}} } \rmPhi _{t} {\bimsigma} _{\rmPhi } } \over {L_{t}^{T_{\setnum{1}} \comma T_{\setnum{2}} } }}.$$
We will set  ${\bimsigma} _{L\comma t} \equals {\bimsigma} _{L\comma t}^{t\comma T_{\setnum{0}} }$.
In the zero-coupon case, it is assumed that the pension fund makes a single payment, at time T 0. We thus have  $L_{t}^{T\comma T_{\setnum{0}} } \equals n_{T_{\setnum{0}} } I\lpar t\comma T_{\setnum{0}} \rpar$ for any T∊[t, T 0[ and the volatility vector of L is σL ,t=σI(t, T 0). In particular, the volatility vector is deterministic in the zero-coupon case (while it is stochastic when a stream of continuous or discrete liability payments are considered). This property allows for explicit pricing of the terminal optimal net wealth, and the associated dynamic asset allocation strategy, as will be made clear below.
2.3 Objectives and optimal asset allocation decisions
The objective of this paper is to adopt the perspective of the pension fund manager, an agent who acts on behalf of the shareholders and workers of the company.Footnote 6 Preferences of the manager are expressed here on the terminal funding ratio F T, where
 $$F_{t} \equiv {{A_{t} } \over {L_{t} }}\comma \quad t \lt T_{\setnum{0}} .$$
Several comments are in order. First, we assume that the pension fund is concerned with the funding ratio rather than the asset per se. This amounts to using the liability value process (Lt)t ⩾0, as opposed to the bank account, as a numeraire, an approach that has already been used for example by Van Binsbergen and Brandt (Reference Van Binsbergen and Brandt2009). Second, we choose to focus on the funding ratio because it is the variable of interest for managers of DB pension plans and regulators of pension plans.Footnote 7 Third, we assume that the pension fund has utility from the terminal funding ratio, not from the intermediate ones. This reduced-form objective can be interpreted in two ways. A first interpretation is that the pension fund is closed, i.e., no new participants join the pension plan between 0 and the liability horizon T 0. All liability payments that take place between 0 and the investment horizon date T are already taken into account in the dynamics of the net asset A, so it is not necessary to consider utility from intermediate funding ratios. A second interpretation is that the pension fund is in a stationary state, has liabilities with a constant maturity T 0 and does not make any payments between dates 0 and T. Since there are no intermediate liability payments, intermediate funding ratios do not enter the utility function. Whichever perspective is taken, the choice of the horizon T is somewhat arbitrary, so we will let this parameter vary in our simulations.
The reduced-form program assumed for the pension fund manager is thus
 $$\mathop {\rm max}\limits_{{\bimomega} } {\bb E}\lsqb U\lpar F_{\rm T} \rpar \rsqb .$$
Unless otherwise stated, we assume that the pension fund manager has CRRA preferences, with relative risk aversion γ, i.e., we take U=u whereFootnote 8
 $$u\lpar x\rpar \equals \left\{ {\openup3\matrix{ {\displaystyle{{x^{\setnum{1} \minus \gamma } } \over {1 \minus \gamma }}\comma } \hfill \tab {{\rm for}\;x \gt 0\comma } \hfill \cr { \minus \infty \comma } \hfill \tab {{\rm for}\;x \leqslant 0.} \hfill \cr} } \right.$$
To obtain the solution to (9), we use the martingale approach in complete markets developed by Cox and Huang (Reference Cox and Huang1989). The following proposition presents the expression for the optimal policy in the zero-coupon case.Footnote 9 Details of derivation are relegated to appendices.
Proposition 2
The optimal payoff and wealth process in (9) in the generic case are
 $$A \ast_{\hskip-5pt\rm T}^{ u} \equals {{A_{\setnum{0}} \minus L_{\setnum{0}}^{\setnum{0}\comma T} } \over {{\bb E}\lsqb \mathop {\lpar M_{\rm T} L_{\rm T} \rpar }\nolimits^{\setnum{1} \minus \lpar\setnum{1}\sol \gamma\rpar } \rsqb }}M_{\rm T}^{ \minus \setnum{1}\sol \gamma } L_{\rm T}^{\setnum{1} \minus\lpar \setnum{1}\sol \gamma\rpar } \comma$$
 $$A\ast _{\hskip-5pt t}^{ u} \equals L_{t}^{t\comma T} \plus {{A_{\setnum{0}} \minus L_{\setnum{0}}^{\setnum{0}\comma T} } \over {{\bb E}\lsqb \mathop {\lpar M_{\rm T} L_{\rm T} \rpar }\nolimits^{\setnum{1} \minus \lpar\setnum{1}\sol \gamma\rpar } \rsqb }}M_{t}^{ \minus \setnum{1}\sol \gamma } \mathop {\lpar L_{t}^{T\comma T_{\setnum{0}} } \rpar }\nolimits^{\setnum{1} \minus \lpar\setnum{1}\sol \gamma\rpar } g\lpar t\comma r_{t} \comma \rmPhi _{t} \rpar \comma$$
where
 $$g\lpar t\comma r_{t} \comma \rmPhi _{t} \rpar \equals {\bb E}_{t} \left[ {\mathop {\left( {{{M_{\rm T} L_{\rm T}^{T\comma T_{\setnum{0}} } } \over {M_{\rm T} L_{\rm T}^{T\comma T_{\setnum{0}} } }}} \right)}\nolimits^{\setnum{1} \minus \lpar\setnum{1}\sol \gamma\rpar } } \right].$$
• In the zero-coupon case, the optimal strategy reads
where $${\bimomega} \ast _{\hskip-5ptt}^{ u} \equals {{{\bf 1}\prime{\bimsigma} _{t}^{ \minus \setnum{1}} {\bimlambda} } \over \gamma }{\omega} _{t}^{{\rm PSP}} \plus {\bf 1}\prime{\bimsigma} _{t}^{ \minus \setnum{1}} {\bimsigma} _{I} \lpar t\comma T_{\setnum{0}} \rpar \left( {1 \minus {1 \over \gamma }} \right){\bimomega} _{t}^{{\rm LMP}} \lpar T\comma T_{\setnum{0}} \rpar \comma$$$${\bimomega} _{t}^{{\rm PSP}} \equiv {{{\bimsigma} _{t}^{ \minus \setnum{1}} {\bimlambda} } \over {{\bf 1}\prime{\bimsigma} _{t}^{ \minus \setnum{1}} {\bimlambda} }}\comma \quad {\bimomega} _{t}^{{\rm LMP}} \lpar T\comma T_{\setnum{0}} \rpar \equals {{{\bimsigma} _{t}^{ \minus \setnum{1}} {\bimsigma} _{I} \lpar t\comma T_{\setnum{0}} \rpar } \over {{\bf 1}{\prime } {\bimsigma} _{t}^{ \minus \setnum{1}} {\bimsigma} _{I} \lpar t\comma T_{\setnum{0}} \rpar }}\comma \quad {\bf 1} \equals \lpar \matrix{ 1 \tab 1 \tab 1 \cr} \rpar {\prime } .$$


Proof
See appendix A.2. □
We find that the solution involves the standard PSP and a liability-hedging or liability-matching portfolio (LMP). This portfolio has the following property, which is typical of intertemporal hedging demand terms in dynamic asset allocation models (Merton, Reference Merton1973): ωt LMP(T, T 0) maximizes the correlation between the returns on the asset portfolio and the return on the present value of future pension payment. In this complete market setting, the maximum correlation achieved is equal to 1. In case the maturity of the inflation-linked bond coincides with the date of the unique payment T 0, the LMP is fully invested in this bond, otherwise it involves the combination of cash, nominal bond and inflation-linked bond needed for reaching the target duration. It should be noted that the optimal portfolio strategy does not involve a separate interest rate hedging component. Indeed, while interest rate risk impacts the asset value, it also impacts liability value in such a way that the net effect at the funding ratio level is trivial.
3 Optimal allocation decisions in the presence of funding ratio constraints
As discussed before, funding ratio constraints, whether desirable or not, are dominant in pension funds’ environment. The allocation strategy presented in Section 2 is in fact not optimal in the presence of minimum funding requirements. We now turn to the analysis of the optimal allocation strategy when funding ratio constraints are explicitly accounted for.
3.1 Portfolio optimization with minimum funding ratio constraint
We complement the investor's objective by introducing the following explicit funding ratio constraint:
 $$\mathop {\rm max}\limits_{{\bimomega} } {\bb E}\lsqb U\lpar F_{\rm T} \rpar \rsqb \comma \quad {\rm s}.{\rm t}.\;A_{\rm T} \geqslant kL_{\rm T} .$$
Imposing such an explicit lower bound intuitively means that the pension fund has infinitely low utility from funding ratios below k. In fact, it follows from the results in Bouchard et al., (Reference Bouchard, Touzi and Zeghal2004) that (11) is a special case of (9) for a non-smooth utility function U:
 $$\mathop {\rm max}\limits_{{\bimomega} } {\bb E}\lsqb \tilde{U}^{\hskip1pt k} \lpar F_{\rm T} \rpar \rsqb \comma$$
where Ũk is a non-smooth utility function defined as follows:
 $$\tilde{U}^{\hskip1pt k} \left( x \right) \equals \left\{ {\openup3\matrix{ {u\lpar x\rpar \comma } \hfill \tab {{\rm if}\;x\geqslant k\comma } \hfill \cr { \minus \infty \comma } \hfill \tab {{\rm if}\;x \lt k.} \hfill \cr} } \right.$$
It seems from program (11) that only the terminal funding ratio is constrained to be larger than k. In fact, taking expectations on both sides of the inequality A T⩾kL T and using the budget constraint (6), we obtain that the constraint  ${\bb P}\lpar F_{\rm T} \geqslant k\rpar \equals 1$ is equivalent to
 $$A_{t} \minus L_{t}^{t\comma T} \geqslant kL_{t}^{T\comma T_{\setnum{0}} } \comma \quad {\rm for}\;{\rm all}\;t\;{\rm in}\;\lsqb 0\comma T\rsqb \;{\rm with}\;{\rm probability}\;1.$$
Hence, the long-term funding ratio constraint is equivalent to a series of short-term constraints. It can easily be seen that for k < 1, these short-term constraints imply that Ft⩾k with probability 1 at all dates t. In particular, it is necessary that  $A_{\setnum{0}} \geqslant L_{\setnum{0}}^{\setnum{0}\comma T} \plus kL_{\rm T}^{T\comma T_{\setnum{0}} }$ holds at time 0, for the maximization problem to be feasible. It should also be noted that the complete market assumption is critical here, since the presence of a non-hedgeable source of risk would make it impossible for the terminal constraint to hold almost surely.
The following proposition provides the solution to the optimization process in the presence of funding ratio constraints.
Proposition 3
Assume that the initial asset satisfies  $A_{\setnum{0}} \geqslant L_{\setnum{0}}^{\setnum{0}\comma T} \plus kL_{\rm T}^{T\comma T_{\setnum{0}} }$. Then
• In the generic case, the optimal payoff and terminal wealth in (11) are
(14)$$A \ast_{\hskip-5pt\rm T}^{ k} \equals kL_{\rm T} \plus \lpar \xi A \ast_{\hskip-5pt\rm T}^{ u} \minus kL_{\rm T} \rpar ^{ \plus } \comma$$where$$A \ast_{\hskip-5ptt}^{ k} \equals L_{t}^{t\comma T} \plus kL_{t}^{T\comma T_{\setnum{0}} } \plus Ex\lpar t\comma r_{t} \comma \rmPhi _{t} \comma \xi \lpar A \ast_{\hskip-5ptt}^{ u} \minus L_{t}^{t\comma T} \rpar \comma kL_{t}^{T\comma T_{\setnum{0}} } \rpar \comma$$$Ex\lpar t\comma r_{t} \comma \rmPhi _{t} \comma \xi \lpar A \ast_{\hskip-5ptt}^{ u} \minus L_{t}^{t\comma T} \rpar \comma kL_{t}^{T\comma T_{\setnum{0}} } \rpar$is the price at time t of an option to exchange the payoff ξA T*ufor the payoff $kL_{\rm T}^{T\comma T_{\setnum{0}} }$at time T, namely The constant ξ is chosen so that the budget constraint A 0*k=A 0holds.$$Ex\lpar t\comma r_{t} \comma \rmPhi _{t} \comma \xi \lpar A \ast _{\hskip-5pt t}^{u} \minus L_{t}^{t\comma T} \rpar \comma kL_{t}^{T\comma T_{\setnum{0}} } \rpar \equals {\bb E}_{t}^{{\bb Q}} \left[ {{\rm e}^{ \minus \int_{t}^{T} \,r_{u} \,{\rm d}u} \lpar \xi A \ast_{\hskip-5pt\rm T}^{ u} \minus kL_{\rm T}^{T\comma T_{\setnum{0}} } \rpar ^{ \plus } } \right].$$• In the zero-coupon case, the optimal strategy is given by
(15)where$$\eqalign{ {\bimomega} \ast _{\hskip-5pt t}^{ k} \equals \tab {{{\bf 1}\prime{\bimsigma} _{t}^{ \minus \setnum{1}} {\bimlambda} } \over \gamma }\left( {1 \minus {{k{\cal N}\lpar \minus d_{\setnum{2}\comma t} \rpar L_{t} } \over {A \ast _{\hskip-5pt t}^{k} }}} \right){\bimomega} _{t}^{{\rm PSP}} \cr \tab \plus {\bf 1}\prime{{\bimsigma} _{t}^{ \minus \setnum{1}}{\bimsigma} _{I} \lpar t\comma T_{\setnum{0}} \rpar \left[ {1 \minus {1 \over \gamma }\left( {1 \minus {{k{\cal N}\lpar \minus d_{\setnum{2}\comma t} \rpar L_{t} } \over {A \ast _{\hskip-5pt t}^{k} }}} \right)} \right]{\bimomega} _{t}^{{\rm LMP}} \lpar T\comma T_{\setnum{0}} \rpar \comma \cr}$$(16)$$\openup3\eqalign{ d_{\setnum{1}\comma t} \equals {1 \over {{\textstyle{1 \over \gamma }}\sqrt {\int_{t}^{T} \vert \vert {\bimsigma} _{I} \lpar s\comma T_{\setnum{0}} \rpar \minus {\bimlambda} \vert \vert ^{\setnum{2}} \,{\rm d}s} }}\left[ {{\rm ln}{{\xi A \ast_{\hskip-5pt t}^{ u} } \over {kL_{t} }} \plus {1 \over {2\gamma ^{\setnum{2}} }}\int_{t}^{T} \vert \vert {\bimsigma} _{I} \lpar s\comma T_{\setnum{0}} \rpar \minus {\bimlambda} \vert \vert ^{\setnum{2}} \,{\rm d}s} \right]\comma \cr}$$(17)$$\eqalign{d_{\setnum{2}\comma t} \equals\tab d_{\setnum{1}\comma t} \minus {1 \over \gamma }\sqrt {\int_{t}^{T} \vert \vert {\bimsigma} _{I} \lpar s\comma T_{\setnum{0}} \rpar \minus {\bimlambda} \vert \vert ^{\setnum{2}} \,{\rm d}s} \comma\cr A \ast_{\hskip-5pt t}^{ k} \equals\tab kL_{t} \plus {\cal N}\lpar d_{\setnum{1}\comma t} \rpar \xi A \ast_{\hskip-5pt t}^{ u} \minus kL_{t} {\cal N}\lpar d_{\setnum{2}\comma t} \rpar .$$







Proof
See appendix A.3. □
We thus obtain an explicit analytical representation of the relationship between optimal strategies in the presence and absence of funding ratio constraints, expressed both in terms of optimal payoffs and optimal portfolio weights. In terms of payoffs, we find that the optimal terminal wealth is given by an initial long position  $kL_{\setnum{0}}^{T\comma T_{\setnum{0}} }$ in a portfolio with payoff kL T, while the remainder
 $A_{\setnum{0}} \minus L_{\setnum{0}}^{\setnum{0}\comma T} \minus kL_{\setnum{0}}^{T\comma T_{\setnum{0}} }$ is invested in an exchange option, which allows the investor to exchange, when the option expires in the money, a portfolio of terminal value kL T for a portfolio delivering the payoff ξA T*u. The constant ξ is adjusted to make the price of the option equal to $A_{\setnum{0}} \minus L_{\setnum{0}}^{\setnum{0}\comma T} \minus kL_{\setnum{0}}^{T\comma T_{\setnum{0}} }$. As a result, the terminal net wealth will be the maximum of kL T and ξA T*u. The expression for the optimal investment strategy and wealth process is reminiscent of OBPI strategies, which the present setup extends in several dimensions. First, the underlying asset is not a stock index but the underlying optimal unconstrained strategy. Second, the risk-free asset is not cash but the liability-benchmark, which allows one to transport the structure to an asset–liability relative risk management context.
A comparison between the optimal terminal wealth under the unconstrained strategy and the constrained strategy can be found in the following proposition, which formalizes the intuition according to which insurance of downside risk (relative to liabilities) has a cost in terms of performance potential.
Proposition 4
For the states of the world ω such that 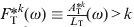 $F \ast_{\hskip-5pt \rm T}^{ k} \lpar {\omega} \rpar \equiv {\textstyle{{A \ast_{\hskip-3pt \rm T}^{ k} } \over {L_{\rm T} }}}\lpar {\omega} \rpar \gt k$, or equivalently such that [ξA T*u (ω)−kL T(ω)]+ > 0, we have that A T*k (ω)<A T*u (ω).
Proof
See appendix A.4. □
3.2 Introducing maximum funding ratio constraints
As noted in the introduction, pension funds have no interest in building up exceedingly large surpluses. Overfunding can be formally prohibited by pension law, or may be simply discouraged by tax law or complexity of surplus sharing rules. The purpose of this subsection is to introduce a maximum funding constraint along with a minimum one. The value of the maximum can be interpreted as the funding level beyond which the utility function of the pension fund is constant. The optimization programme is thus given by (9) subject to the additional constraints F T⩾k and F T⩽k′:
 $$\mathop {\rm max}\limits_{{\bimomega} } {\bb E}\lsqb U\lpar F_{\rm T} \rpar \rsqb \comma \quad {\rm s}.{\rm t}.\;k\leqslant F_{\rm T} \leqslant k'.$$
In order to have the constraint k⩽F T⩽k′ satisfied almost surely, the initial asset A 0 should lie between  $L_{\setnum{0}}^{\setnum{0}\comma T} \plus kL_{\setnum{0}}^{T\comma T_{\setnum{0}} }$ and
 $L_{\setnum{0}}^{\setnum{0}\comma T} \plus k'L_{\setnum{0}}^{T\comma T_{\setnum{0}} }$. The following proposition presents the solution to these optimization programmes in the presence of minimum and maximum funding ratio constraints (or targets).
Proposition 5
Assume that the initial asset satisfies  $L_{\setnum{0}}^{\setnum{0}\comma T}\! \plus kL_{\setnum{0}}^{T\comma T_{\setnum{0}} } \leqslant A_{\setnum{0}} \leqslant L_{\setnum{0}}^{\setnum{0}\comma T} \!\plus k \prime L_{\setnum{0}}^{T\comma T_{\setnum{0}} }$. Then
• In the generic case, the optimal payoff and wealth process in (18) are given by
where the constant ξ′ is adjusted to make the budget constraint A 0*k,k′ =A 0hold.$$\openup3pt\eqalign{ A\ast _{\hskip-5pt \rm T}^{ k\comma k\prime} \equals \tab kL_{\rm T} \plus \lpar \xi \prime A \ast_{\hskip-5pt \rm T}^{ u} \minus k \prime L_{\rm T} \rpar ^{ \plus } \minus \lpar \xi \prime A \ast_{\hskip-5pt \rm T}^{ u} \minus k\prime L_{t} \rpar ^{ \plus } \comma \cr A \ast_{\hskip-5pt t}^{ k\comma k\prime } \equals \tab L_{t}^{t\comma T} \plus kL_{t}^{T\comma T_{\setnum{0}} } \plus Ex\lpar t\comma r_{t} \comma \rmPhi _{t} \comma \xi \prime \lpar A \ast_{\hskip-5pt t}^{ u} \minus L_{t}^{t\comma T} \rpar \comma kL_{t}^{T\comma T_{\setnum{0}} } \rpar \cr \tab \minus Ex\lpar t\comma r_{t} \comma \rmPhi _{t} \comma \xi \prime \lpar A \ast_{\hskip-5pt t}^{ u} \minus L_{t}^{t\comma T} \rpar \comma k \prime L_{t}^{T\comma T_{\setnum{0}} } \rpar \comma \cr}$$• In the zero-coupon case, the optimal strategy is given by
where$$\hskip-2pt\eqalign{ {\bimomega} \ast _{\hskip-5pt t}^{ k\comma k\prime } \equals \tab {{{\bf 1}\prime {\bimsigma} _{t}^{ \minus \setnum{1}} {\bimlambda} } \over \gamma }\left( {1 \minus \lsqb k{\cal N}\lpar \minus d_{\setnum{2}\comma t} \rpar \plus k\prime {\cal N}\lpar d{\hskip1pt\prime }_{\hskip-3pt\setnum{2}\comma t} \rpar \rsqb {{L_{t} } \over {A \ast_{\hskip-5pt t}^{ k\comma k{\prime } } }}} \right){\bimomega} _{t}^{{\rm PSP}} \cr \tab\hskip-12pt\plus {\bf 1}\prime {\bimsigma} _{t}^{ \minus \setnum{1}} {\bimsigma} _{I} \lpar t\comma T_{\setnum{0}} \rpar \left[ {1 \minus {1 \over \gamma }\left( {1 \minus \lsqb k{\cal N}\lpar \minus d_{\setnum{2}\comma t} \rpar \plus k\prime {\cal N}\lpar d{\prime }_{\hskip-2pt\setnum{2}\comma t} \rpar \rsqb {{L_{t} } \over {A \ast_{\hskip-5pt t}^{ k\comma k\prime } }}} \right)} \right]{\bimomega} _{t}^{{\rm LMP}} \lpar T\comma T_{\setnum{0}} \rpar \comma \cr}$$The constantξ′ is adjusted to make the budget constraint A 0*k,k′ =A 0hold.$$\eqalign{ d{\hskip1pt\prime }_{\hskip-3pt\setnum{1}\comma t} \equals \tab {1 \over {{\textstyle{1 \over \gamma }}\sqrt {\int_{t}^{T} \vert \vert {\bimsigma} _{I} \lpar s\comma T_{\setnum{0}} \rpar \minus {\bimlambda} \vert \vert ^{\setnum{2}} \,{\rm d}s} }}\left[ {{\rm ln}{{\xi \prime A \ast_{\hskip-5pt t}^{ u} } \over {k\prime L_{t} }} \plus {1 \over {2\gamma ^{\setnum{2}} }}\int_{t}^{T} \vert \vert {\bimsigma} _{I} \lpar s\comma T_{\setnum{0}} \rpar \minus {\bimlambda} \vert \vert ^{\setnum{2}} \,{\rm d}s} \right]\comma \cr d{\hskip1pt\prime }_{\hskip-2pt\setnum{2}\comma t} \equals \tab d{\hskip1pt\prime }_{\hskip-3pt\setnum{1}\comma t} \minus {1 \over \gamma }\sqrt {\int_{t}^{T} \vert \vert {\bimsigma} _{I} \lpar s\comma T_{\setnum{0}} \rpar \minus {\bimlambda} \vert \vert ^{\setnum{2}} \,{\rm d}s} \comma \cr A \ast_{\hskip-5pt t}^{ k\comma k\prime } \equals \tab kL_{t} {\cal N}\lpar \minus d_{\hskip1pt\setnum{2}\comma t} \rpar \plus k\prime L_{t} {\cal N}\lpar d{\hskip1pt\prime }_{\hskip-3pt\setnum{2}\comma t} \rpar \plus \lsqb {\cal N}\lpar d_{\setnum{1}\comma t} \rpar \minus {\cal N}\lpar d{\hskip2pt\prime } _{\hskip-3pt\setnum{1}\comma t}\rpar \rsqb \xi \prime A \ast^{u}_{\hskip-5pt t} . \cr}$$


Proof
See appendix A.5. □
The optimal terminal net wealth is given by the payoff of a static portfolio strategy that consists of investing kL 0 in the LMP, with the remainder, A 0−kL 0, being invested in a bull spread strategy extended to an exchange option context. This strategy consists of a long position in an exchange option and a short position in an exchange option on the same underlying payoff and a higher strike price. The former option gives its owner the right to exchange a portfolio of terminal value kL T for a portfolio of terminal value ξ′A T*u, while the latter option gives its owner the right to exchange a portfolio of terminal value k′L T for the same portfolio of terminal value ξ′A T*u.
A noteworthy property of the strategy of proposition 5 is that it allows for the respect of the maximum funding constraint at all times, provided the maximum funding level k′ > 1 and the initial wealth satisfies the conditions stated in the proposition. The proof of this statement is straightforward: given that the terminal wealth satisfies  $A \ast_{\hskip-5pt \rm T}^{ k\comma k\prime } \leqslant k\prime L_{\rm T}^{T\comma T_{\setnum{0}} }$ with probability 1, we obtain, taking the present values of both sides of the inequality
 $$A_{t} \minus L_{t}^{t\comma T} \leqslant k\prime L_{t}^{T\comma T_{\setnum{0}} } \comma$$
which implies that At⩽k′Lt if k′ > 1. Similarly, the minimum funding constraint is respected at all dates if k < 1: the proof is exactly the same as for the strategy with a lower bound only (see Section 3.1).
Finally, comparing propositions 3 and 5, it can be seen that the imposition of an explicit upper bound involves a short position in an exchange option. This short position allows one to reduce the cost of downside protection by giving up some access to the upside potential beyond the funding ratio threshold k′, as shown in the following proposition.
Proposition 6
Let  $F \ast_{\hskip-5pt \rm T}^{ k\comma k^{\prime } } \equiv {\textstyle{{A \ast_{\hskip-3pt \rm T}^{ k\comma k\prime } } \over {L_{\rm T} }}}$denote the optimal terminal funding ratio when the lower bound k and the upper bound k′ are imposed. Similarly, let
 $F \ast_{\hskip-5pt \rm T}^{ k} \equiv A \ast_{\hskip-5pt \rm T}^{ k} \sol L_{\rm T}$denote the optimal terminal funding ratio when only the lower bound k is imposed. For those states of the world ω such that k<F T*k ,k′ (ω)<k′, we have that A T*k(ω)<A T*k,k′ (ω).
Proof
See appendix A.6. □
4 Empirical analysis
We now turn to an empirical testing of the optimal strategies discussed in the previous section. To this end, we use a schedule of liability payments provided for by a Dutch pension fund and displayed in Table 1, from which we obtain that the date of the last scheduled payment is T 0 = 75 years. These cash-flows represent real expected pension payments, to which a cumulative inflation factor should be applied so as to obtain the nominal liability payment.Footnote 10 The duration of the pension fund liability is the maturity of the indexed zero-coupon bond that has the same sensitivity to interest rates as the coupon bond that models the liability. Since the present value at time 0 of all future payments is equal to L 0, the duration τ0 is defined by
 $$ \minus {{1 \minus {\rm e}^{ \minus a\tau _{\setnum{0}} } } \over a} \equals {1 \over {L_{\setnum{0}} }}{{\partial L_{\setnum{0}} } \over {\partial r_{\setnum{0}} }} \equals \minus {1 \over {L_{\setnum{0}} }}\displaystyle\mathop{\sum}\limits_{t_{i} \equals \setnum{1}}^{\setnum{75}} {{1 \minus {\rm e}^{ \minus at_{i} } } \over a}n_{t_{i} } I\lpar 0\comma t_{i} \rpar .$$
Numerically, we obtain that τ0 = 11.32 years.
Schedule of annual liability payments expressed in real terms

This table presents the schedule of annual pension payments expressed in real terms. The data have been provided for by a Dutch pension fund. The duration of this payment stream, as computed in (19), is τ0 = 11.32 years.
4.1 Unconstrained strategy
With no loss of generality, we assume that the investment opportunity set includes a single stock index, regarded as an efficient combination of individual stocks, in addition to a zero-coupon bond and an inflation-indexed bond with maturity corresponding to the duration of pension payments. Our base case parameters are taken from Munk et al., (Reference Munk, Sørensen and Vinther2004), who also model the nominal interest rate as an Ornstein–Uhlenbeck process and the price index as a Geometric Brownian motion.Footnote 11Table 2 summarizes our base case set of parameter values.
Base case parameters

This table contains parameter values for interest rate, price index and stock return processes. These parameter values, as well as the price for interest rate risk, are borrowed from Munk et al., (Reference Munk, Sørensen and Vinther2004), while the equity risk premium parameter is taken from Brennan and Xia (Reference Brennan and Xia2002) and the inflation risk premium is set to zero.
In all cases, we have assumed that the pension fund was initially fully funded, i.e., A 0=L 0, and have estimated the distribution of the final funding ratio using 5,000 points. In Table 3, we provide information regarding the distribution of the funding ratio when no constraint is introduced. As expected, we find that the dispersion increases with T and decreases with γ. Indeed, a lower risk-aversion parameter implies a higher investment in the PSP, and hence a higher performance potential coupled with a higher funding risk. On the other hand, for a given risk-aversion parameter value, we find that the range of funding ratio values increases with the time-horizon T as more time is allowed for uncertainty to play a role. Even for γ = 10, we find that the minimum funding ratio obtained is lower than 90% for a one-year horizon, and lower than 70% for a 20-year horizon. This provides justification for the introduction of funding ratio constraints aiming at imposing a left-truncation of the final distribution.
Distribution of the final funding ratio when utility is from terminal funding ratio and no lower bound is imposed

This table reports the minimum and the maximum of the distribution of the terminal funding ratio, the 2.5%, 25%, 50%, 75% and 97.5% quantiles, the mean and the volatility. Also reported are the shortfall probability, the expected shortfall and the conditional mean of the funding ratio given it lies above k = 0.9, or between 0.9 and k′ = 1.1. Parameters are fixed at their base case values (see Table 2). The pension fund is initially fully funded, and liability payments are given in Table 1.
4.2 Minimum funding ratio constraints
In Table 4, we test for the introduction of explicit funding ratio constraints, with a minimum set at k = 90%. In this case, we find that the minimum funding ratio is indeed limited to k, a value that is reached with a relatively high probability, suggesting that the margin for error is fully utilized with these strategies. In fact, the dispersion of the funding ratio distribution is narrower on both sides when the pension fund follows the strategy with explicit constraints than when it chooses the unconstrained counterpart. For instance, in the case T = 20 years and γ = 5, the maximum funding ratio is 3.1 in the explicit constraint case, while it reaches 4.01 in the unconstrained case. That downside protection comes at the cost of a more limited access to the upside potential can also be seen from the fact that the expected terminal funding ratio conditional upon being larger than the constraint k,  ${\bb E}\lsqb F_{\rm T} \vert F_{\rm T} \geqslant k\rsqb$, is always strictly lower in the constrained case than in the unconstrained case. For example, when T = 20 years and γ = 5, the conditional mean reaches 1.16 in the constrained case, while it is 1.51 in the unconstrained case. On the other hand, the average deficit is also significantly higher in the latter case (13%, as opposed to 8% in the constrained case).
Distribution of the final funding ratio when utility is from terminal funding ratio and a lower bound is imposed

This table reports the minimum and the maximum of the distribution of the terminal funding ratio, the 2.5%, 25%, 50%, 75% and 97.5% quantiles, the mean and the volatility. Also reported are the shortfall probability, the expected shortfall and the conditional mean of the funding ratio given that it lies between k = 0.9 and k′ = 1.1. Parameters are fixed at their base case values (see Table 2). The lower bound k is set to 0.9. The pension fund is initially fully funded, and liability payments are given in Table 1.
4.3 Minimum and maximum funding ratio constraints
In Table 5, we introduce an additional upper bound constraint, with a maximum funding ratio value set at k′ = 110%. Giving up access to the upside potential above 110% allows one to decrease the cost of downside protection, as can be seen from the fact that the average of terminal funding ratio values conditional upon being in the range between 90% and 110% are higher when the upper bound is imposed than when it is not introduced. In fact, focusing again on T = 20 years and γ = 5, we have that the conditional expected funding ratio  ${\bb E}\lsqb F \ast_{\hskip-5pt\rm T}^{ k\comma k\prime } \vert k\leqslant F \ast_{\hskip-5pt\rm T}^{k\comma k\prime } \leqslant k\prime \rsqb \equals 1.04$ when both constraints are imposed, while it merely reached 0.95 when only the lower constraint was imposed. In the unconstrained case, we had that
 ${\bb E}\lsqb F \ast_{\hskip-5pt\rm T}^{k\comma k\prime } \vert k\leqslant F \ast_{\hskip-5pt\rm T}^{k\comma k\prime } \leqslant k\prime \rsqb \equals 1.01 \lt 1.04$. Hence, the addition of the short option position allows for an improvement of the mean funding ratio over the range of values between 0.9 and 1.1, not only with respect to the case with minimum funding requirement only, but also with respect to the unconstrained case.
Distribution of the final funding ratio when utility is from terminal funding ratio and lower and upper bounds are imposed (k′ = 1.1)

This table reports the minimum and the maximum of the distribution of the terminal funding ratio, the 2.5%, 25%, 50%, 75% and 97.5% quantiles, the mean and the volatility. Also reported are the shortfall probability, the expected shortfall and the conditional mean of the funding ratio given that it lies between k = 0.9 and k′ = 1.1. Parameters are fixed at their base case values (see Table 2). The pension fund is initially fully funded, and liability payments are given in Table 1. The lower bound k is set to 0.9 and the upper bound k′ to 1.1.
4.4 Dynamic properties of the funding ratio
As noted in the theoretical section of this paper, the optimal strategies presented in propositions 3 and 5 allow for the respect of minimum funding constraints at all times if the minimum funding level k < 1, k′ > 1, and the initial funding ratio is compatible with the respect of these constraints (see conditions in the propositions).
Nevertheless, given the regulatory focus on intermediate funding ratios, it is useful to consider the evolution of this variable over time. In order to keep the analysis as simple as possible, we assume that there is a single liability payment at the terminal date T 0, which corresponds to the zero-coupon case. We take T 0 to be the duration of the payments in Table 1 (see equation (19)), numerically equal to 11.32 years, and we set the horizon to 10 years.Footnote 12 Then it follows from propositions 2, 3 and 5 that the unconstrained funding ratio and the two constrained wealth funding ratios are given by
 $$\eqalign{\hfill F \ast_{\hskip-5pt t}^{ u} \equals \tab {{A_{\setnum{0}} } \over {L_{\setnum{0}}^{\setnum{1} \minus \setnum{1}\sol \gamma } }}L_{t}^{ \minus \setnum{1}\sol \gamma } M_{t}^{ \minus \setnum{1}\sol \gamma } \exp\left[ {\int_{\setnum{0}}^{t} \vert \vert {\bimsigma} _{I} \lpar s\comma T_{\setnum{0}} \rpar \minus {\bimlambda} \vert \vert ^{\setnum{2}}\,{\rm d} s} \right]\comma \hfill\cr\hfill F \ast_{\hskip-5pt t}^{ k} \equals \tab {{\xi A\ast _{t}^{ u} } \over {L_{t} }}{\cal N}\lpar d_{\setnum{1}\comma t} \rpar \plus k{\cal N}\lpar \minus d_{\setnum{2}\comma t} \rpar \comma\hfill \cr\hfill F \ast_{\hskip-5pt t}^{k\comma k\prime } \equals \tab {{\xi \prime A \ast _{\hskip-5pt t}^{u} } \over {L_{t} }}{\cal N}\lpar d_{\setnum{1}\comma t} \rpar \minus {{\xi \prime A \ast_{\hskip-5pt t}^{ u} } \over {L_{t} }}{\cal N}\lpar d\prime _{\setnum{1}\comma t} \rpar \plus k{\cal N}\lpar \minus d_{\setnum{2}\comma t} \rpar \plus k\prime{\cal N} \lpar d\hskip1pt\prime _{\hskip-3pt\setnum{2}\comma t} \rpar \comma\hfill \cr}$$
where ξ, ξ′, di ,t and d′i ,t are defined in propositions 3 and 5.
Using these expressions, we simulate the intermediate funding ratios at dates t = 1, 3, 5, 7 and 9 years for a strategy with horizon T = 10 years. Table 6 reports the volatility, mean, minimum and maximum after t years. It appears that the increase in volatility over time is larger for the unconstrained strategy than for the strategies that impose at least one bound: when γ = 2, volatility ranges from 0.18 after 1 year to 0.78 after 9 years with no constraint, and from 0.06 to 0.41 with a lower bound only. This effect is straightforward: by cutting either the left tail or both tails of the distribution, these strategies reduce the volatility. Similarly, the mean, the minimum and the maximum vary less over time for the two constrained strategies. The unconstrained strategy is found to respect neither the minimum funding constraint nor the maximum one, whatever the horizon. The violations of these constraints are, however, more limited in size at short horizons and for high levels of risk aversion.
Distribution of intermediate funding ratios Optimal strategy with no lower bound Optimal strategy with lower bound Optimal strategy with lower and upper bounds This table reports descriptive statistics on the intermediate optimal funding ratio in three situations: no lower bound is imposed, a lower bound k = 0.9 is imposed, and a lower bound and an upper bound k′ = 1.1 are simultaneously imposed. The pension fund is initially fully funded, and liabilities are represented by a single payment of 


 $\rmPhi _{T_{\setnum{0}} }$ at date T 0 = 11.32 years, and the horizon of the strategy is T = 10 years. Other parameters are fixed at their base case values (see Table 2).
5 Robustness checks
The strategies that have been studied in the previous sections have been derived under the assumption of perfect and dynamically complete financial markets. A natural question is whether they still have good properties outside this idealized framework. The purpose of this section is therefore to assess their robustness with respect to various forms of imperfection or incompleteness, such as the inability for pension funds to implement continuous trading, as well as incompleteness arising from jump risk in the stock or from unspanned liability risk. We do not tackle the problem of computing optimal strategies in these imperfect settings, and we focus on the question whether the constrained strategy of Section 3.1 still respects a minimum funding constraint with reasonably high probability.
5.1 Introducing dynamic incompleteness
The optimal terminal net wealth obtained in proposition 3 can only be generated through dynamic trading in continuous-time. In practice, continuous trading is impossible because of transaction costs or liquidity constraints. It is therefore relevant to test whether the strategy described in the proposition satisfies the minimum funding constraints when it is implemented in discrete time. We focus on the zero-coupon case, because it leads to a fully analytical expression for the optimal strategy in continuous time. Hence, there is a single liability payment at the terminal date T 0 = 11.32 years.
We assume that trading takes place at dates 0<t 1< ⋅⋅⋅<tn<T, where the time step Δt=ti +1−ti can be either one week, one month, two months or one year. The portfolio is rebalanced at each date ti, and is buy-and-hold over the period [ti, ti +1]. The weights allocated to the stock index, the nominal bond and the indexed bond at date ti are given by the vector  ${\bimomega} \ast^{ k}_{t_{i} }$, where ω*k is the portfolio rule that has been shown to be optimal in continuous time (see equation (15)). The weight allocated to cash is one minus the sum of the weights allocated to the other assets. This strategy generates a certain terminal wealth, and panel (a) of Table 7 summarizes the distribution of the terminal funding ratio. It also reports descriptive statistics on the distribution of the terminal funding ratio when the strategy is implemented in continuous time. The continuous-time distributions have been obtained through direct simulation of the terminal payoff (14). All the results in this table have been obtained assuming an investment horizon of T = 10 years, and a lower bound k = 0.9.
Summary of robustness checks Discrete-time trading Jump risk in stock index Unspanned liability risk In panel (a), we study the impact of the rebalancing frequency. In panel (b), we introduce downside jumps in the price process of the stock index. In panel (c), liabilities include a specific risk component orthogonal to all traded risks. Liabilities are paid at date T 0 = 11.32 years, the investment horizon is T = 10 years, and the lower bound k is set to 0.9. Other parameters are fixed at their base case values (see Table 2).


We find that the introduction of dynamic incompleteness leads to a positive probability of violating the minimum funding constraint. Indeed, the minimum value for the funding ratio happens to be lower than the minimum funding value k when trading is yearly or bimonthly. On the other hand, these violations are very limited in probability, since the minimum funding level is respected in at least 97.5% of the scenarios, except for the somewhat extreme assumption of annual rebalancing. For a reasonable trading frequency of one month, we find that the constraint is violated with positive probability only in the case γ = 10, but is respected at the 2.5% level. Overall, these results show that discrete trading does not lead to worrying deteriorations of the performance of the continuous-time strategy, as far as the objective of respecting a minimum funding level is concerned.
5.2 Introducing jump risk on the asset side
As a second robustness check, we now test the behavior of the strategy in the presence of jumps in the dynamics of stock returns. Jumps make the market incomplete, since they cannot be hedged. Formally, we follow Merton (Reference Merton1976) in assuming that the stock price evolves as a mixture of a pure diffusion process and a Poisson process
 $${\rm d}S_{t} \equals S_{t} \lsqb r_{t} \plus {\sigma} _{S} {\lambda} _{S} \minus \iota x\rsqb \,{\rm d}t \plus S_{t} {\bimsigma}{\prime}_{\hskip-3ptS} \,{\rm d}{\bi z}_{t} \plus S_{t \minus } x\,{\rm d}N_{t} .$$
In this equation, N denotes a Poisson process with constant intensity under ℙ denoted by ι, a process that we assume to be independent of z. x represents the jump size. This quantity is negative, but ensuring that the price remains positive requires x > − 1. The price process is right continuous, but no longer continuous, hence the St − in the above equation.
The presence of jump risk introduces a form of dynamic incompleteness. As pension cash-flows are not impacted by the presence of jumps in the stock price, the no-arbitrage value of liabilities equals the same L 0 as in the complete market case. On the other hand, the optimal strategies that were derived with or without funding constraints in the absence of jumps (see propositions 2, 3 and 5) are now suboptimal. We do not attempt here to compute optimal strategies in the presence of jumps.Footnote 13 Instead, we use the same weights as in the complete market case, and we apply them to the two zero-coupon bonds and the stock with jump risk. These weights are given by (15). They involve, in particular, the constant ξ which is solution to the equation
 $$\xi A_{\setnum{0}} {\cal N}\lpar d_{\setnum{1}\comma \setnum{0}} \rpar \minus kL_{\setnum{0}} {\cal N}\lpar d_{\setnum{2}\comma \setnum{0}} \rpar \equals A_{\setnum{0}} \minus kL_{\setnum{0}} \comma$$
where d 1,0 and d 2,0 are given by equations (16) and (17). It should be noted that because of market incompleteness, the left side is no longer the no-arbitrage price of the payoff [ξA T*u−kL T]+; therefore (21) is taken here as a definition, rather than a property, of ξ. We then implement strategy (15) with monthly rebalancings, which corresponds to a commonly chosen frequency in practice.
Panel (b) of Table 7 summarizes the distribution of the terminal funding ratio. We find that jumps of exceedingly large size or frequency are needed for the strategy to exhibit severe and frequent violations of the minimum funding ratio requirements. For example, assuming that a jump takes place on average every 5 years, with a −20% intensity, we find for γ = 2 that the minimum funding ratio is 75%, with the 2.5% bottom percentile already very close to the minimum funding requirement, with the value 87%. If a jump of the same size were to occur on average every year, the strategy would not perform as well: for γ = 2, the probability of not satisfying the minimum funding requirement would be more than 50%. However, a −20% jump on average every year appears to be an extreme assumption.Footnote 14 For γ = 2, in each but this particular case, the probability of not breaching the floor is greater than 75%. For greater values of the relative risk aversion, the terminal net wealth is less impacted by jump risk since stocks receive a lower allocation. For instance, when γ = 10, the constraint is satisfied with a probability of 2.5% in all cases, except if a −20% jump occurs on average every year.
5.3 Introducing specific liability risk
So far we have assumed that pension payments were only subject to interest rate and inflation risks. Since nominal and indexed bonds are assumed to be traded on the financial market, liability risk is therefore entirely spanned by existing securities. In practice, however, the presence of specific liability risk related, in particular, to actuarial uncertainty induces a particular form of market incompleteness. We do not attempt here to present a realistic model for the dynamics of the work force demography, but instead to introduce a stylized model that will allow us to test the robustness of the dynamic strategies in the presence of actuarial risk that is not spanned by traded securities. Formally, we assume that the amount to be paid at time T 0 is equal to  $\varepsilon _{T_{\setnum{0}} } \rmPhi _{T_{\setnum{0}} }$, where
 $$\varepsilon _{T_{\setnum{0}} } \equals {\rm exp}\lsqb \minus {\sigma} _{\varepsilon }^{\setnum{2}} T_{\setnum{0}} \plus {\sigma} _{\varepsilon } \tilde{z}_{T_{\setnum{0}} } \rsqb .$$
In this equation,  is a ℙ-Brownian motion independent of z that represents actuarial risk. This risk is therefore assumed to be independent of financial risk, which is arguably a reasonable approximation of reality. As the traded assets only span interest rate, inflation and stock price risks, the market is no longer complete. Technically speaking, there exist infinitely many equivalent martingale measures (see Harrison and Kreps, Reference Harrison and Kreps1979). To each martingale measure corresponds a pricing kernel through equation (3), and one price process for the liability payment
 $L_{T_{\setnum{0}} }$. As shown by He and Pearson (Reference He and Pearson1991), the solution to the utility maximization problem (9) involves the ‘minimax’ pricing kernel. In this section, we do not solve for minimax pricing kernel, and we fix the martingale measure exogenously by taking the ‘minimal’ martingale measure (see Föllmer and Schweizer, Reference Föllmer and Schweizer1990): this measure, which assigns a zero price to non-traded risks, leads to the same price process for the liability as in the complete market setting:Footnote 15
 $$L_{t} \equals {\bb E}_{t} \left[ {{{M_{\rm T} } \over {M_{t} }}\varepsilon _{T_{\setnum{0}} } \rmPhi _{T_{\setnum{0}} } } \right] \equals \varepsilon _{t} I\lpar t\comma T_{\setnum{0}} \rpar .$$
We then solve for ξ in equation (21), and we implement the dynamic strategy (15) on a monthly basis, using the minimal entropy price Lt for the liability wherever needed. Panel (c) in Table 7 reports summary statistics on the distribution of the terminal funding ratio for different values of σ∊, which is the parameter driving the uncertainty on  $\varepsilon _{T_{\setnum{0}} }$ through the equality:
 $${\bb V}\lsqb \varepsilon _{T_{\setnum{0}} } \rsqb \equals {\rm exp} \lsqb {\sigma} _{\varepsilon }^{\setnum{2}} T_{\setnum{0}} \rsqb \minus 1.$$
Since there is a specific risk factor in the liability payment, the payoff L T is not replicable, so it is impossible to ensure that the terminal funding ratio is greater than k with probability 1. The results confirm that the introduction of unspanned liability risk causes a deterioration of the performance of the risk-controlled strategy. For reasonable parameter values leading to 5% standard deviation in $\varepsilon _{T_{\setnum{0}} }$, we find that minimum funding requirement is respected with a 2.5% probability when γ = 10, and close to being respected at the 2.5% confidence level for γ = 2 and γ = 5. Overall, it appears that the benefits of the risk-controlled strategies are relatively robust with respect to the introduction of various forms of market incompleteness.
6 Conclusion and extensions
DB pension funds are currently facing a serious challenge and dilemma. On the one hand, the desire to alleviate the burden of contributions leads them to invest significantly in equity markets and other classes poorly correlated with liabilities but offering superior long-term performance potential. On the other hand, stricter regulatory environments and accounting standards give them more incentive to invest a dominant fraction of their portfolios in assets highly correlated to liabilities. Although there is a general agreement about the fact that some regulatory constraints are needed, there is a fierce debate regarding whether it makes sense to impose strict short-term funding constraints to long-term investors. The point of our paper is not to question whether minimum funding ratio constraints are desirable or not, but instead to analyze what exact strategies are optimal given such constraints. We cast this question in the context of a continuous-time dynamic asset allocation model for an investor facing liability commitments subject to inflation and interest rate risks. When (regulatory or self-imposed) constraints on the funding ratio are introduced, the optimal policy is shown to involve dynamic trading strategies that allow investors to hedge out downside risk beyond the minimum funding level, at the cost of a less than 100% access to the upside generated by the otherwise comparable unconstrained strategy. We also find that the introduction of maximum funding ratio targets would allow pension funds to decrease the cost of downside protection while giving up part of the upside potential beyond levels where marginal utility of wealth (relative to liabilities) is low or almost zero.
This analysis can be extended in a number of directions. In particular, we have focused on the pension fund situation, mostly taken in isolation from the sponsor company. Abstracting away from the sponsor company allows for a dramatic simplification of the problem, and it would be desirable to develop a more integrated approach to ALM, with a focus on optimal allocation and contribution policies from the shareholders’ standpoint. This would, however, require a formal capital structure model, with an analysis of the rational valuation of liability streams as defaultable claims, as well as an analysis of the impact of asset allocation decisions on the sponsor company credit ratings. It would also require a careful analysis of the agencies issues among the various stakeholders, including equity holders and bondholders of the sponsor company, but also workers and pensioners, as well as managers of the pension funds and their trustees. Regarding default on pension obligations, it should also be noted that in some countries such as the US, there exists a pension insurance system, which is in charge of (partially) compensating for the deficit, if any, in pension payment in case of default of the sponsor company.Footnote 16 Analyzing the impact of these additional sources of complexity is beyond the scope of the present paper, and is left for further research.
Appendix A: Proof of the main propositions
A.1 Proof of proposition 1
The expression for the nominal zero-coupon bond is standard (Vasicek, Reference Vasicek1977). For the inflation-linked bond, we proceed as follows. First it follows from Girsanov's theorem that the process  ${\bi \hat{z}}$ defined by
 ${\rm d}\mathop {{\bi \hat{z}}}\nolimits_{t} \equals {\rm d}{\bi z}_{t} \plus {\bimlambda} \,{\rm d}t$ is a ℚ-Brownian motion. The dynamics of r and Φ under ℚ are
 $$\openup6\eqalign{ {\rm d}r_{t} \equals \tab a\lpar \tilde{b} \minus r_{t} \rpar {\rm d}t \plus {\bimsigma} \prime _{\hskip-3pt r}\, {\rm d}{\hskip2pt\bi \hat{z}}_{\hskip1pt t} \comma \cr {\rm d}\rmPhi _{t} \equals \tab \rmPhi _{t} \lsqb \tilde{\varphi }{\rm d}t \plus {\bimsigma} \prime_{\hskip-3pt\rmPhi}\, {\rm d}{\hskip2pt\bi \hat{z}}_{\hskip1pt t} \rsqb . \cr}$$
Hence
 $$\openup6\eqalign {\tab\hskip60pt \rmPhi _{\tau _{\setnum{2}} } \equals \rmPhi _{t} \,{\exp}\left[ {\int_{t}^{\tau _{\setnum{2}} } \left( {\tilde{\varphi } \minus {{\vert \vert {\bimsigma} _{\rmPhi } \vert \vert ^{\setnum{2}} } \over 2}} \right){\rm d}u \plus \int_{ t}^{\tau _{\setnum{2}} } {\bimsigma} \prime _{\hskip-3pt\rmPhi } \,{\rm d}\hskip1pt\mathop {{\bi \hat{z}}}\nolimits_{\hskip1pt u} } \right]\comma\hfill \cr\tab \int_{t}^{\tau } r_{u} {\kern 1pt} {\rm d}u \equals \tilde{b}\left[ {\tau _{\setnum{2}} \minus t \minus {{1 \minus {\rm e}^{ \minus a\lpar \tau _{\setnum{2}} \minus t\rpar } } \over a}} \right] \plus {{1 \minus {\rm e}^{ \minus a\lpar \tau _{\setnum{2}} \minus t\rpar } } \over a}r_{t} \plus {1 \over a}\int_{t}^{\tau _{\setnum{2}} } \,\lpar 1 \minus {\rm e}^{ \minus a\lpar \tau _{\setnum{2}} \minus u\rpar } \rpar {\bimsigma} \prime _{r} \,{\rm d}\mathop {\hskip1pt\bi\hat{z}}\nolimits_{\hskip1pt u} . \cr}$$
Standard computations of expectations of log-normal random variables yield the result.
A.2 Proof of proposition 2
Following Cox and Huang (Reference Cox and Huang1989), we write (9) as a static maximization program whose control variable is the terminal wealth
 $$\mathop {\rm max}\limits_{A_{\rm T} } \;{\bb E}\left[ {{1 \over {1 \minus \gamma }}\mathop {\left( {{{A_{\rm T} } \over {L_{\rm T}^{T\comma T_{\setnum{0}} } }}} \right)}\nolimits^{\setnum{1} \minus \gamma } } \right]$$
subject to constraint  ${\bb E}\lsqb M_{\rm T} A_{\rm T} \rsqb \equals A_{\setnum{0}} \minus L_{\setnum{0}}^{\setnum{0}\comma T}$. The associated first-order condition reads
 $$A \ast ^{u}_{\hskip-4pt\rm T} \equals L_{\rm T}^{T\comma T_{\setnum{0}} } \mathop {\left( {\nu _{\setnum{1}} M_{\rm T} L_{\rm T}^{T\comma T_{\setnum{0}} } } \right)}\nolimits^{ \minus \setnum{1}\sol \gamma } .$$
The optimal wealth process A*u is then given by
 $$A \ast^{u}_{\hskip-4pt t} \equals L_{t}^{t\comma T} \plus \nu _{\setnum{1}}^{ \minus \setnum{1}\sol \gamma } M_{t}^{ \minus \setnum{1}\sol \gamma } \mathop {\lpar L_{t}^{T\comma T_{\setnum{0}} } \rpar }\nolimits^{\setnum{1} \minus (\setnum{1}\sol \gamma) } {\bb E}_t\left[ {\left( {{{M_{\rm T} L_{\rm T}^{T\comma T_{\setnum{0}} } } \over {M_{t} L_{t}^{T\comma T_{\setnum{0}} } }}} \right)^{\setnum{1} \minus (\setnum{1}\sol \gamma) } } \right].$$
The process  $X \equals ML^{T\comma T_{\setnum{0}} }$ follows a martingale under ℙ, so that
 $${{{\rm d}X_{t} } \over {X_{t} }} \equals {\left[ {\bimsigma} _{L\comma t}^{T\comma T_{\setnum{0}} } \minus {\bimlambda} \right]}\vskip-5pt \prime \vskip5pt {\rm d}{\bi z}_{t} .$$
The volatility vector is a function of (t, rt, Φt), hence the triplet (r, Φ, X) has the Markov property under ℙ. In particular, there exists some function h of (t, rt, Φt, Xt) such that
 $${\bb E}_{t} \left[ {\mathop {\left( {{{X_{\rm T} } \over {X_{t} }}} \right)}\nolimits^{\setnum{1} \minus (\setnum{1}\sol \gamma) } } \right] \equals h\lpar t\comma r_{t} \comma \rmPhi _{t} \comma X_{t} \rpar .$$
Let us set  $H\lpar t\comma r_{t} \comma \rmPhi _{t} \comma X_{t} \rpar \equals X_{t}^{\setnum{1} \minus (\setnum{1}\sol \gamma) } h\lpar t\comma r_{t} \comma \rmPhi _{t} \comma X_{t} \rpar$. The process (H(t, rt, Φt, Xt))t follows a martingale under ℙ. Assuming that h is smooth, this implies that the function H solves the following partial differential equation (p.d.e.):
 $$\eqalign{ 0 \equals \tab H_{r} a\lpar b \minus r\rpar \plus H_{\rmPhi } \rmPhi \pi \plus {\textstyle{1 \over 2}}H_{rr} {\bi\sigma} _{r}^{\setnum{2}} \plus {\textstyle{1 \over 2}}H_{\rmPhi \rmPhi } {\bi \sigma} _{\rmPhi }^{\setnum{2}} \rmPhi ^{\setnum{2}} \cr \tab \plus {\textstyle{1 \over 2}}\,H_{XX} \vert \vert {\bimsigma} _{X} \vert \vert ^{\setnum{2}} X^{\setnum{2}} \plus H_{rX} X{\bimsigma} \prime _{\hskip-3pt r} {\bimsigma} _{X} \plus H_{\rmPhi X} {\rmPhi} X{\bimsigma} \prime _{\hskip-3pt\rmPhi } {\bimsigma} _{X} \plus H_{\rmPhi r} \rmPhi {\bimsigma} \prime _{\hskip-3pt\rmPhi } {\bimsigma} _{r} \comma \cr}$$
where  ${\bimsigma} _{X} \equals {\bimsigma} _{L\comma t}^{T\comma T_{\setnum{0}} } \minus {\bimlambda}$. The terminal condition is
 $H\lpar T\comma r\comma \rmPhi \comma X\rpar \equals X^{\setnum{1} \minus (\setnum{1}\sol \gamma) }$. It is easily verified that this p.d.e. has a solution of the form
 $X^{\setnum{1} \minus (\setnum{1}\sol \gamma) } h_{\setnum{1}}$, where h 1 is a function of (t, r, Φ) only. Therefore, we have that g=h 1, and
 $$A \ast ^{u} _{\hskip-4pt t}\equals L_{t}^{t\comma T} \plus \nu _{\setnum{1}}^{ \minus \setnum{1}\sol \gamma } M_{t}^{ \minus \setnum{1}\sol \gamma } \lpar L_{t}^{T\comma T_{\setnum{0}} } \rpar ^{\setnum{1} \minus (\setnum{1}\sol \gamma) } g\lpar t\comma r_{t} \comma \rmPhi _{t} \rpar .$$
In the zero-coupon case, we have Ltt,T = 0 for any t⩽T, and  ${\bimsigma} _{L}^{T\comma T_{\setnum{0}} } \equals {\bimsigma} _{L}$ is deterministic, which allows for analytical computation of g(t, rt, Φt):
 $$g\lpar t\comma r_{t} \comma \rmPhi _{t} \rpar \equals {\rm exp}\left[ { \minus {1 \over 2\gamma}\left( {1 \minus {1 \over \gamma }} \right)\int_{t}^{T} \vert \vert {\bimsigma} _{L\comma s} \minus {\bimlambda} \vert \vert ^{\setnum{2}}\, {\rm d}s} \right].$$
In particular, we have that gr=g Φ = 0. Moreover, we have that
 $${\cal L}_{r}^{T\comma T_{\setnum{0}} } \equals \alpha \lpar T_{\setnum{0}} \minus t\rpar L_{t}^{T\comma T_{\setnum{0}} } \quad {\rm and}\quad {\cal L}_{\rmPhi }^{T\comma T_{\setnum{0}} } \equals {{L_{t}^{T\comma T_{\setnum{0}} } } \over {\rmPhi _{t} }}.$$
Applying Ito's lemma to the process A*u, we obtain the optimal strategy ω*u written in proposition 2.
A.3 Proof of proposition 3
The first-order optimality condition reads
 $${1 \over {L_{\rm T} }}\mathop {\left( {{{A \ast^{ k}_{\hskip-4pt\rm T} } \over {L_{\rm T} }}} \right)}\nolimits^{ \minus \gamma } \minus \nu _{\setnum{2}} M_{\rm T} \plus {{\nu _{\setnum{3}} } \over {L_{\rm T} }} \equals 0\comma$$
where ν3 ⩾ 0,  $\nu _{\setnum{3}} \lpar\lpar A \ast ^{k}_{\hskip-4pt\rm T} \sol L_{\rm T}\rpar \minus k\rpar \equals 0$ and A*kT⩾kL T. Hence, the optimal terminal net wealth and the optimal wealth process
 $$A \ast^{ k}_{\hskip-4pt\rm T} \equals kL_{\rm T} \plus \mathop {\lsqb L_{\rm T} \lpar \nu _{\setnum{2}} M_{\rm T} L_{\rm T} \rpar ^{ \minus \setnum{1}\sol \gamma } \minus kL_{\rm T} \rsqb }\nolimits^{ \plus } \comma$$
 $$A \ast^{ k} _{\hskip-4ptt}\equals L_{t}^{t\comma T} \plus kL_{t}^{T\comma T_{\setnum{0}} } \plus {\bb E}_{t}^{{\bb Q}} \lsqb {\rm e}^{ \minus \int _{t}^{T} r_{u} \,{\rm d}u} \lpar \xi A \ast^{ u}_{\hskip-4pt\rm T} \minus kL_{\rm T} \rpar ^{ \plus } \rsqb \comma$$
where A*uT is the optimal final net wealth in the absence of constraints on the funding ratio, ξ is equal to (ν2/ν0)−1/γ and ν0 is the Lagrange multiplier associated with the budget constraint in (9). The expectation in equation (A.3) is the price at time t of the option to exchange the payoff kL T for the payoff ξA T*u at time T. Since the process  $\mathop {\lpar \lpar r_{t} \comma \rmPhi _{t} \comma A \ast^{u}_{\hskip-5pt t} \minus L_{t}^{t\comma T} \comma L_{t}^{T\comma T_{\setnum{0}} } \rpar \rpar }\nolimits_{t}$ has the Markov property under ℚ, there exists some measurable function Ex such that
 $${\bb E}_{t}^{{\bb Q}} \lsqb {\rm e}^{\minus \int _{t}^{T} r_{u}\, {\rm d}u} \lpar \xi A \ast^{ u}_{\hskip-6pt \rm T} \minus kL_{\rm T} \rpar ^{ \plus } \rsqb \equals Ex\lpar t\comma r_{t} \comma \rmPhi _{t} \comma \xi \lpar A\ast^{u}_{\hskip-5pt t} \minus L_{t}^{t\comma T} \rpar \comma kL_{t}^{T\comma T_{\setnum{0}} } \rpar .$$
It is only in the zero-coupon case that the volatility vector of  $A \ast ^{u} \sol L^{T\comma T_{\setnum{0}} }$ is deterministic, which allows for the use of Margrabe's formula to price the exchange option
 $$A \ast^{k}_{\hskip-5pt t}\equals kL_{t} \plus \xi \lpar A \ast^{u}_{\hskip-5ptt} \minus L_{t}^{t\comma T} \rpar {\cal N}\lpar d_{\setnum{1}\comma t} \rpar \minus kL_{t}^{T\comma T_{\setnum{0}} } {\cal N}\lpar d_{\setnum{2}\comma t} \rpar \comma$$
where d 1,t and d 2,t are given in the statement of the proposition. We then apply Ito's lemma
 $$\eqalign{ {\rm d}A \ast^{ k}_{\hskip-5pt t} \equals \tab r_{t} A \ast^{ k}_{\hskip-5pt t}\,{\rm d} t \plus kL_{t} {\bimsigma} _{I} \lpar t\comma T_{\setnum{0}} \rpar \prime \,{\rm d}{\hskip3pt\bi\hat z}_{t} \plus \lpar A \ast^{ k}_{\hskip-5pt t} \minus kL_{t} \rpar {\bimsigma} _{I} \lpar t\comma T_{\setnum{0}} \rpar \prime\, {\rm d}{\bi z}_{t} \cr \tab \plus {{\xi \lpar A \ast^{ k}_{\hskip-5pt t} \minus L_{t}^{t\comma T} \rpar {\cal N}\lpar d_{\setnum{1}\comma t} \rpar } \over \gamma }\lsqb {\bimlambda} \minus {\bimsigma} _{I} \lpar t\comma T_{\setnum{0}} \rpar \rsqb \prime\, {\rm d}{\hskip3pt\bi\hat z}_{t} . \cr}$$
Writing ξAt*u (d 1,t) as At*k−kLt (−d 2,t) and rearranging terms leads to the optimal portfolio strategy given in proposition 3.
A.4 Proof of proposition 4
First note that for k > 0, the price of the exchange option lies between the no-arbitrage bounds given on the one hand by the intrinsic value of the option  $\mathop {\lsqb \xi \lpar A_{\setnum{0}} \minus L_{\setnum{0}}^{\setnum{0}\comma T} \rpar \minus kL_{\setnum{0}}^{T\comma T_{\setnum{0}} } \rsqb }\nolimits^{ \plus }$ and on the other hand by the underlying price ξ(A 0−L 00,T):
 $$\mathop {\left[ {\xi \lpar A_{\setnum{0}} \minus L_{\setnum{0}}^{\setnum{0}\comma T} \rpar \minus kL_{\setnum{0}}^{T\comma T_{\setnum{0}} } } \right]}\nolimits^{ \plus } \lt A_{\setnum{0}} \minus L_{\setnum{0}}^{\setnum{0}\comma T} \minus kL_{\setnum{0}}^{T\comma T_{\setnum{0}} } \lt \xi \lpar A_{\setnum{0}} \minus L_{\setnum{0}}^{\setnum{0}\comma T} \rpar \comma$$
which implies that ξ < 1 and also that  $\xi \gt 1 \minus \lpar kL_{\setnum{0}}^{T\comma T_{\setnum{0}} } \sol A_{\setnum{0}} \minus L_{\setnum{0}}^{\setnum{0}\comma T} \rpar$.
A.5 Proof of proposition 5
We just explain how to derive the optimal terminal net wealth. The first-order optimality condition for the optimization program reads
 $${1 \over {L_{\rm T} }}\mathop {\left( {{{A \ast _{\hskip-4pt\rm T}^{k\comma k\prime } } \over {L_{\rm T} }}} \right)}\nolimits^{ \minus \gamma } \minus \nu _{\setnum{4}} M_{\rm T} \plus {{\nu _{\setnum{5}} } \over {L_{\rm T} }} \minus {{\nu _{\setnum{6}} } \over {L_{\rm T} }} \equals 0\comma$$
where kL T⩽A T*⩽k′L T, ν5 and ν6 are non-negative and  $\nu _{\setnum{5}} \lpar A \ast^{ k\comma k\prime } _{\hskip-5pt\rm T}\minus kL_{\rm T} \rpar \equals\nu _{\setnum{6}} \lpar A \ast^{ k\comma k\prime } _{\hskip-5pt\rm \rm T}\minus$
 $ k\prime L_{\rm T} \rpar \equals 0$. This implies that
 $$A \ast^{ k\comma k{\prime } }_{\hskip-5pt\rm T} \equals k \plus \lsqb \lpar \nu _{\setnum{4}} M_{\rm T} L_{\rm T} \rpar ^{ \minus \setnum{1}\sol \gamma } \minus k\rsqb ^{ \plus } \minus \lsqb \lpar \nu _{\setnum{4}} M_{\rm T} L_{\rm T} \rpar ^{ \minus \setnum{1}\sol \gamma } \minus k\prime \rsqb ^{ \plus } .$$
Having written the optimal payoff under this form, we are back to the proof of proposition 13 (see appendix A.3).
A.6 Proof of proposition 6
By definition of ξ′, we have that
 $$\openup3\eqalign{Ex\lpar 0\comma r_{\setnum{0}} \comma \rmPhi _{\setnum{0}} \comma \xi \lpar A_{\setnum{0}} \minus L_{\setnum{0}}^{\setnum{0}\comma T} \rpar \comma kL_{\setnum{0}}^{T\comma T_{\setnum{0}} } \rpar\equals\tab Ex\lpar 0\comma r_{\setnum{0}} \comma \rmPhi _{\setnum{0}} \comma \xi \prime \lpar A_{\setnum{0}} \minus L_{\setnum{0}}^{\setnum{0}\comma T} \rpar \comma kL_{\setnum{0}}^{T\comma T_{\setnum{0}} } \rpar\cr\tab \minus Ex\lpar 0\comma r_{\setnum{0}} \comma \rmPhi _{\setnum{0}} \comma \xi \prime \lpar A_{\setnum{0}} \minus L_{\setnum{0}}^{\setnum{0}\comma T} \rpar \comma k\prime L_{\setnum{0}}^{T\comma T_{\setnum{0}} } \rpar . \cr}$$
Since Ex is a strictly increasing function of its fourth argument, we obtain that  $\xi \lpar A_{\setnum{0}} \minus L_{\setnum{0}}^{T\comma T_{\setnum{0}} } \rpar \lt \xi \prime \lpar A_{\setnum{0}} \minus L_{\setnum{0}}^{T\comma T_{\setnum{0}} } \rpar$, which implies that ξ < ξ′.
Assume now that  $k \lt F \hskip1pt\ast^{ k\comma k\prime }_{\hskip-5pt\rm T} \lt k\prime$. Then
 $F \hskip1pt\ast^{k\comma k\prime }_{\hskip-5pt\rm T} \equals \xi \prime F \ast ^{\comma u} _{\hskip-5pt\rm T}$. If F T*k=k, then it is clear that F T*k,k′ >F T*k. If F T*k = ξF T*,u , then we have that F T*k,k′ >F T*k as well.



