Introduction
Dementia with Lewy bodies (DLB) is the second most common form of degenerative dementia after Alzheimer's disease (AD) (McKeith et al., Reference McKeith2005). Core clinical features of the condition include spontaneous motor parkinsonism, recurrent visual hallucinations, and cognitive fluctuation (McKeith et al., Reference McKeith2005). In contrast to AD, the cognitive profile is one of predominantly attentional and visuospatial impairments (McKeith et al., Reference McKeith2005). Generally, patients with DLB perform better than those with AD on tests of memory but worse on visuospatial performance tasks (McKeith et al., Reference McKeith2005).
Pathologically, DLB is differentiated from other dementia subtypes by the presence of Lewy body pathology, i.e. Lewy bodies and Lewy neurites containing aggregates of the synaptic protein alpha-synuclein, which can form in the brainstem, limbic, and neocortical areas (McKeith et al., Reference McKeith2005). The majority of DLB patients also have varying degrees of Alzheimer pathology (neuritic plaques and, less frequently, tau-based neurofibrillary tangles), the severity of which is usually intermediate or low (McKeith et al., Reference McKeith2005).
Despite the differences, establishing a patient's clinical diagnosis remains challenging and misdiagnosis is common. Refining the ante-mortem diagnosis is an important step towards optimizing patient care and is essential for furthering research into the disorder, including the potential development of disease-modifying agents.
Structural MRI has been used extensively to investigate patterns of gray matter (GM) atrophy in AD but to a much lesser extent in DLB. AD is characterized by a pattern of generalized cortical atrophy with particular GM loss of the medial temporal lobe structures and temporoparietal association cortices (Jack et al., Reference Jack, Petersen, Obrien and Tangalos1992; Whitwell et al., Reference Whitwell2008).
Visual rating and volumetric studies have shown that patients with DLB have relative preservation of the medial temporal lobe (MTL) when compared with AD (Barber et al., Reference Barber, Gholkar, Scheltens, Ballard, McKeith and O'Brien1999; Whitwell et al., Reference Whitwell2007). In a prospective MRI study with autopsy validation, Burton et al. (Reference Burton2009) found that medial temporal atrophy (MTA) correlated with Alzheimer pathology but not Lewy-related pathology. This finding is increasingly recognized as a potential discriminator between the conditions. In addition, “relative preservation of the medial temporal lobe structures on CT/MRI scan” has now been incorporated as a supportive feature in the revised consensus criteria for the clinical diagnosis of DLB in 2005 (McKeith et al., Reference McKeith2005).
Other reported results have been less consistent. Some studies have found atrophy affecting subcortical regions such as the putamen, substantia innominata, and dorsal midbrain along with overlap of affected areas in AD such as atrophy of the amygdala (Cousins et al., Reference Cousins, Burton, Burn, Gholkar, McKeith and O'Brien2003; Hanyu et al., Reference Hanyu, Shimizu, Tanaka, Hirao, Iwamoto and Abe2007; Whitwell et al., Reference Whitwell2007), findings which have not always been replicated by others. The inconsistencies between studies may relate to variability in cohorts, heterogeneity within cohorts with differing degrees of pathological overlap between conditions, differing methods of analysis and small sample sizes.
Voxel-based morphometry (VBM) performs a voxel-level analysis of tissue concentration between subject groups. It is an unbiased and largely operator independent method of MRI data analysis (Ashburner and Friston, Reference Ashburner and Friston2000). Findings from other VBM studies comparing the structural gray matter changes in DLB and AD have varied (Burton et al., Reference Burton2002; Reference Burton, McKeith, Burn, Williams and O'Brien2004; Beyer et al., Reference Beyer, Larsen and Aarsland2007; Whitwell et al., Reference Whitwell2007; Takahashi et al., Reference Takahashi2010). VBM analysis methodology continues to be improved and refined and the “Diffeomorphic Anatomical Registration Through Exponentiated Lie algebra” (DARTEL) image registration algorithm has recently been introduced. DARTEL provides a more sophisticated mathematical framework than the standard unified segmentation approach (Ashburner, Reference Ashburner2007). This has been incorporated into the Statistical Parametric Mapping toolbox (http://www.fil.ion.ucl.ac.uk/spm) and is now in widespread use. DARTEL offers more accurate inter-subject registration of brain images, thereby improving the localization and sensitivity of VBM studies (Ashburner, Reference Ashburner2007).
With the use of higher resolution imaging (3T) and the improved VBM-DARTEL analysis tool in a large group of well-characterized DLB subjects, we aimed to further define MRI patterns of GM atrophy in DLB that may assist in differentiating it from AD. We also aimed to investigate correlations between GM loss and neuropsychological measures to help understand the in vivo pathological basis for clinical features in patients with dementia.
Methods
Participants
Participants with dementia
Seventy-one people with dementia over the age of 60 (both sexes) were recruited from a community-dwelling population of patients referred to local Old Age Psychiatry, Geriatric Medicine or Neurology Services. The research was approved by the local ethics committee. All patients and, where appropriate, their nearest relative provided written informed consent.
Control participants
Thirty-five control participants were recruited from among relatives and friends of participants with dementia or were recruited as volunteers via advertisements in local community newsletters. A detailed examination was undertaken to exclude those with evidence of dementia (from history or CAMCOG score < 80), depression (history and assessment) or a history of any other significant neurologic, physical or psychiatric disorder including drug and alcohol abuse.
Assessment and diagnosis
Diagnosis was made following a detailed clinical assessment. This included review of clinical records, psychiatric and medical history review as well as physical examination and mental state assessment. A standard dementia screen was also completed which included hematology and biochemistry analysis, B12 and folate concentrations, thyroid function tests, syphilis serology, and CT brain. Diagnoses of AD and DLB were made in accordance with NINCDS-ADRDA (McKhann et al., Reference McKhann, Drachman, Folstein, Katzman, Price and Stadlan1984) and DLB consensus criteria (McKeith et al., Reference McKeith1996; Reference McKeith2005) respectively, by consensus agreement among three experienced raters (RB, JO'B, and RW) blinded to all information from the MRI scans.
Assessment of global cognitive measures in all three groups (AD, DLB, and controls) included the CAMCOG, which incorporates the Mini-Mental State Examination (MMSE; Folstein et al., Reference Folstein, Folstein and McHugh1975). The CAMCOG Memory subscale includes assessment of recent and remote memory and new learning. Depressive symptoms were measured using the 15-item Geriatric Depression Scale (Sheikh and Yesavage, Reference Sheikh, Yesavage and Brink1986). Motor parkinsonism was assessed with the Unified Parkinson's Disease Rating Scale Part III (UPDRS-III).
For participants with dementia, neuropsychiatric features were assessed using the Neuropsychiatric Inventory (NPI) (Cummings et al., Reference Cummings, Mega, Gray, Rosenberg-Thompson, Carusi and Gornbein1994), cognitive fluctuations were assessed using the Clinician's Assessment of Fluctuation (Walker et al., Reference Walker2000) and function was assessed using the Bristol Activities of Daily Living (Bucks et al., Reference Bucks, Ashworth, Wilcock and Siegfried1996).
MRI data acquisition
Subjects underwent T1 weighted magnetic resonance (MR) scanning on a 3T MRI system (Intera Achieva scanner, Philips Medical Systems, Eindhoven, Netherlands) with an eight-channel receiver head coil, within two months of the study assessment. The sequence was a standard T1 weighted volumetric sequence covering the whole brain (3D MPRAGE, sagittal acquisition, 1 mm isotropic resolution and matrix size of 240 (anterior-posterior) × 216 (superior-inferior) × 180 (right-left); repetition time (TR) = 8.3ms; echo time (TE) = 4.6ms; SENSE factor = 2; flip angle = 8°). The acquired volume was angulated such that the axial slice orientation was standardized to align with the AC–PC line.
VBM-DARTEL: pre-processing steps
VBM analysis was performed using SPM8 (http://www.fil.ion.ucl.ac.uk/spm) and MATLAB 7.9 (Math-Works, Natick, MA, USA). Subject images were visually inspected for any artifacts or gross anatomical abnormalities. MR images were then segmented into gray matter (GM), white matter (WM), and cerebrospinal fluid (CSF) using the standard unified segmentation model in SPM8 (Ashburner and Friston, Reference Ashburner and Friston2005). GM templates were generated from all patients using DARTEL (Ashburner, Reference Ashburner2007). The patients’ GM data were spatially normalized and warped in DARTEL and transformed to Montreal Neurological Institute (MNI) space (http://www.mni.mcgill.ca/). Images were then Jacobian scaled (similar to modulation) to ensure that relative volumes of GM were preserved following the spatial normalization procedure and then smoothed with an 8mm full-width at half-maximum (FWHM) isotropic Gaussian kernel. After spatial pre-processing, the smoothed, modulated, normalized GM datasets were used for statistical analysis. Total intracranial volume of each participant was calculated by summing the total tissue probability of gray matter, white matter and CSF from probability maps generated during the initial segmentation step.
Statistical analysis
Demographic, clinical, and cognitive measures
Descriptive analyses of the group characteristics were completed using the Statistical Package for Social Sciences (SPSS, version 17). Data were reviewed for normality by visual inspection of the histograms and by the Shapiro-Wilk test. Differences in demographic and clinical data were assessed using either t-tests or ANOVA for continuous variables as appropriate and χ2 test for categorical data. Where post hoc analysis was required to test for group differences following ANOVA, a Tukey correction for multiple comparisons was applied to control for Type I errors. For each test statistic, a probability value of <0.05 test was regarded as significant.
VBM
Regional volume differences between groups were assessed using the SPM8 General Linear Model based on random Gaussian field theory (Friston et al., Reference Friston, Holmes, Worsley, Poline, Frith and Frackowiak1995). An absolute threshold mask of 0.05 was used for GM analyses. Age and total intracranial volume were included in the design matrix as nuisance covariates in all VBM analyses.
Analyses were also performed to investigate the effects of GM loss and cognitive measures (CAMCOG, CAMCOG memory subscale, CAMCOG praxis subscale, and MMSE) in subjects with AD and DLB, separately and combined as a single dementia group.
Significant effects were assessed using an uncorrected threshold of P ≤ 0.001 and the family-wise error (FWE) threshold of PFWE ≤ 0.05, corrected for multiple comparisons. Only voxel-level significance was considered. The cluster centers were converted from MNI space to Talairach coordinates using the program GingerALE version 2.0.4 (http://brainmap.org/ale/). The anatomical location was then determined using Talairach daemon (http://www.talairach.org/).
Results
Participant characteristics
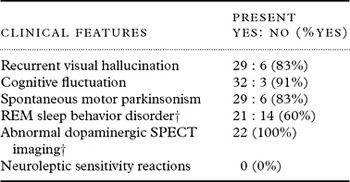
One-hundred-and-six participants completed the MRI scan and clinical assessment (35 DLB, 36 AD, 35 Controls). Of these, 36 met the NINCDS/ADRDA criteria for probable AD (McKhann et al., Reference McKhann, Drachman, Folstein, Katzman, Price and Stadlan1984), and 34 met the original consensus diagnostic criteria for probable DLB and one for possible DLB (McKeith et al., Reference McKeith1996). However, all 35 DLB subjects fulfilled the revised consensus criteria for probable DLB (McKeith et al., Reference McKeith2005). The core clinical diagnostic features of the DLB group are summarized in Table 1.
Clinical features of the DLB cases (N = 35)

† Twenty-two patients had abnormal FP-CIT SPECT imaging prior to study inclusion, all were abnormal; 13 patients did not have FP-CIT SPECT imaging, which is not needed to make a diagnosis of probable DLB.
REM = rapid eye movement; SPECT = single photon emission computerized tomography.
The MR data of two AD subjects were excluded, one due to motion artifact and the other to inaccuracy in the segmentation step noted on visual inspection.
Participant demographics
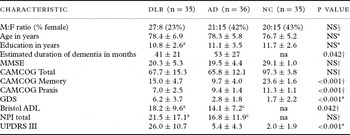
The demographic data for all participants are summarized in Table 2. Subject groups were well matched for age (F2,105 = 0.80, p = 0.450) and educational level (F2,104 = 0.98, p = 0.379). The AD and DLB group mean CAMCOG (t69 = 0.58, p = 0.566) and MMSE (t69 = 0.71, p = 0.480) scores were comparable, suggesting a similar level of dementia severity, although the reported duration of illness was shorter in DLB (DLB average 41 months, AD average 53 months; t69 = 2.08 p = 0.042). As expected, the global cognitive measures were significantly lower in the dementia groups compared with the control group. Also as expected, the DLB group had more depressive features as measured by the GDS (F2,105 = 26.8, p < 0.001), slightly more functional impairment (t66 = 2.02, p = 0.047) and significantly higher UPDRS III scores than the AD subjects (t69 = 10.6, P < 0.001).
Demographics, clinical and cognitive measures
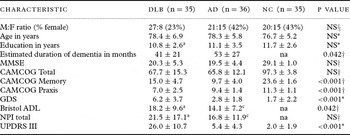
Values expressed as mean±1SD or mean (range); aN = 33; bN = 34; cN = 35; dN = 29; § χ2- controls, AD and DLB for gender. *ANOVA of controls, AD and DLB for age, education, GDS and UPDRS; †Student's t-test of AD vs DLB for MMSE, CAMCOG, Bristol ADL, NPI total.
DLB = dementia with Lewy bodies; AD = Alzheimer's disease; NC = normal control; MMSE = Mini-Mental State Examination; CAMCOG = Cambridge Cognitive Examination; GDS = Geriatric Depression Scale; Bristol ADL, Bristol Activities of Daily Living; NPI = Neuropsychiatric Inventory; UPDRS III = Unified Parkinson's Disease Rating Scale, Part III; NS = not significant (P > 0.05); na = not applicable.
Differences in gray matter volume between DLB and controls
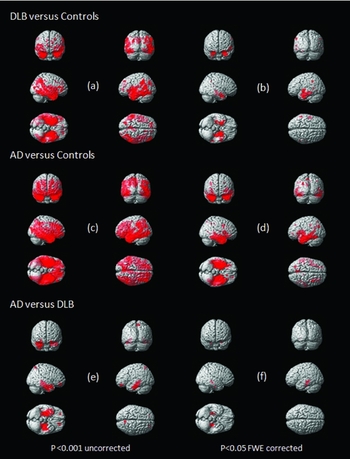
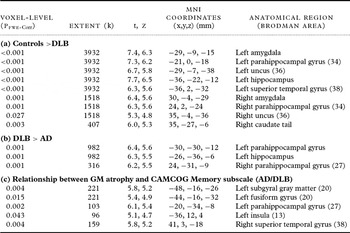
As illustrated in Figure 1a, clusters of reduced gray matter volume were observed in DLB patients relative to controls (p < 0.001, uncorrected). Regions of significant difference (p < 0.05, FWE-corrected) were seen bilaterally in the parahippocampal gyrus, amygdala, superior temporal gyrus, uncus, and the right caudate tail, summarized in Table 3(a).
Three-dimensional surface renders showing the areas of cortical GM loss (red) in DLB compared to controls, (a) and (b); AD compared to controls, (c) and (d) and AD compared to DLB, (e) and (f). All results are represented at p < 0.001 uncorrected (a), (c), (e) and p < 0.05 FWE corrected (b), (d), (f).

Location and peak significance of significant reduction in GM volume: (a) in DLB compared to controls; (b) in AD compared to DLB; and (c) that correlate with CAMCOG memory subscale in dementia (AD/DLB) using VBM-DARTEL. For each peak, the table shows voxel-level significance (PFWE-Corr), spatial extent (k), t and Z scores, MNI coordinates and anatomical region
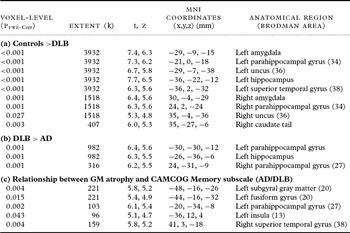
GM = gray matter;, PFWE-Corr = probability value, family wise error corrected; MNI = Montreal Neurological Institute; DLB = dementia with Lewy bodies; AD = Alzheimer's disease.
Differences in gray matter volume between AD and controls
Clusters of gray matter atrophy in AD were diffuse and extensive, involving bilateral frontal, temporal, parietal, and occipital lobes when compared with controls as shown in Figure 1c (p < 0.001, uncorrected).
Differences in gray matter between DLB and AD
There was less atrophy in the medial temporal lobe structures in DLB when compared with AD (Figure 1e). This relative preservation of the medial temporal lobe in DLB was more pronounced on the left. There was significantly more GM loss (p < 0.05, FWE-corrected) in the left hippocampus and bilateral parahippocampal gyri in AD when compared with DLB, represented in Figure 1f and Table 3(b).
Clinical correlations in DLB and AD
A positive correlation was observed between the CAMCOG memory subscale and regions of gray matter atrophy in temporal lobe structures (left > right) in the combined AD and DLB group. Table 3(c) depicts areas of significance (p < 0.05, FWE-corrected). A correlation was observed in the DLB group alone but was strengthened by the inclusion of the AD group. However, the correlation was not observed in the AD group alone. There was no significant correlation found between regions of gray matter atrophy and the CAMCOG praxis subscale or global cognitive measure (CAMCOG and MMSE) in either AD or DLB subject groups.
Discussion
In a VBM study using the DARTEL registration algorithm comparing patterns of GM loss in DLB and AD, we found that patients with DLB showed a pattern of GM loss involving the temporal, parietal, occipital, and subcortical structures when compared with controls. Areas of significance included bilateral parahippocampal gyri, amygdale, and uncus; left hippocampus and superior temporal gyrus and right caudate tail. These structures were also involved to a much greater extent in the AD group as part of widespread GM loss. These findings are largely in keeping with a VBM study by Whitwell et al. (Reference Whitwell2007), although other VBM studies have demonstrated a more diffuse cortical GM loss in DLB (Burton et al., Reference Burton2002; Beyer et al., Reference Beyer, Larsen and Aarsland2007). In the VBM study by Burton et al. (Reference Burton2002), diffuse cerebral changes were reported in DLB, including frontal areas. We did not find significant changes in the frontal regions in DLB. This may, in part, be explained by the differing levels of dementia severity between studies. In Burton's study, the DLB group was more impaired (mean MMSE 13.3) compared to our cohort (MMSE 20.3) (Burton et al., Reference Burton2002). It is possible that as disease progresses in our DLB cohort, areas of frontal atrophy may become apparent and longitudinal investigation is warranted to determine whether this is the case. Beyer et al. (Reference Beyer, Larsen and Aarsland2007) also found widespread changes in DLB; however, in contrast to our study, the results were of unmodulated data and reported tissue concentration rather than volume, making comparisons difficult.
We found relative preservation of the medial temporal lobe structures in DLB compared to AD. This is in agreement with other MRI studies (Barber et al., Reference Barber, Gholkar, Scheltens, Ballard, McKeith and O'Brien1999; Burton et al., Reference Burton2002; Whitwell et al., Reference Whitwell2007) and pathological studies (Lippa et al., Reference Lippa, Johnson and Smith1998; Burton et al., Reference Burton2009), and is consistent with the relative sparing of episodic memory in DLB and the medial temporal structures (hippocampus and amygdala) underlying this. Our findings again highlight the importance of this observation as a potential discriminator between AD and DLB and further validates its incorporation in the revised DLB criteria (McKeith et al., Reference McKeith2005).
Other studies have reported a pattern of subcortical structural change in DLB (Whitwell et al., Reference Whitwell2007). Our study found GM loss of the right caudate tail in DLB when compared to controls. Nigrostriatal dysfunction and dopaminergic loss, particularly of the dopamine transporter in the striatum, occur in DLB but not to a significant extent in AD (Piggot et al., Reference Piggot1999). This can be visualized via nuclear medicine techniques using specific imaging ligands. Using FP-CIT SPECT, reductions of 40–50% have been documented in DLB (O'Brien et al., Reference O'Brien2004). It is important to consider how these functional dopaminergic changes may be related to structural changes. In our cohort of DLB patients, 22 had FP-CIT SPECT imaging as part of their clinical diagnostic work-up prior to study inclusion. Of the patients who had FP-CIT SPECT imaging, all were abnormal indicating reduced dopamine transporter uptake (see Table 1). Other studies have not found significant differences in caudate volume using ROI and semi-automated segmentation analysis methods (Barber et al., Reference Barber, McKeith, Ballard and O'Brien2002; Cousins et al., Reference Cousins, Burton, Burn, Gholkar, McKeith and O'Brien2003). Interestingly, in a VBM study, Burton et al. (Reference Burton, McKeith, Burn, Williams and O'Brien2004) reported atrophy of the right caudate tail in Parkinson's disease dementia but not in the DLB comparison group. In a MRI study, using manual segmentation, Cousins et al. (Reference Cousins, Burton, Burn, Gholkar, McKeith and O'Brien2003) reported reduced putamen volume in DLB (approximately 10–15%) compared to healthy controls. When the values were normalized to TIV they found that the volume loss was also more pronounced in DLB compared to AD. Along with striatal dopamine transporter deficiencies, striatal dopamine D2 receptors are also reduced (Piggot et al., Reference Piggot1999). So although there is some intrinsic striatal pathology which may account for a degree of structural atrophy, it is unlikely that at this level of atrophy it would account for the substantial loss in dopaminergic activity (Duda, Reference Duda2004; O'Brien et al., Reference O'Brien2004).
We identified an association between the CAMCOG memory subscale and atrophy in the medial temporal lobe structures in the combined AD and DLB group that was significant when corrected for multiple comparisons. Areas included the left parahippocampal gyrus, left subgyral gray matter, left fusiform gyrus and right superior temporal gyrus. The association was observed in the DLB group although strengthened by combining the AD group. The CAMCOG memory subscale is a combination of recent and remote memory and new learning with scores ranging from 0 to 27. The DLB group performed better than the AD group on this test which is in keeping with the differing cognitive profiles between the conditions and would suggest that memory dysfunction in DLB is associated with GM atrophy in these regions. Although this correlation was not detected in AD alone, there may be a number of reasons for this. Given the early and significant dysfunction of episodic memory in AD, many of the neuropsychological tests have a floor effect making it difficult to detect correlations even where they may exist (large type II error probability).
In contrast to the memory assessments, the DLB group performed worse on the CAMCOG praxis subscale than the AD group, which again is consistent with the expected neuropsychological profile of DLB of more impaired visuospatial processing and praxis (McKeith et al., Reference McKeith2005). One possible reason for this involves dysfunction of the parieto-occipital areas. The parieto-occipital changes in DLB have been demonstrated in functional imaging studies with hypometabolism and hypoperfusion in PET and SPECT studies respectively (Ishii et al., Reference Ishii1998; Lobotesis et al., Reference Lobotesis2001). We observed a pattern of GM loss preferentially affecting these areas relative to the frontal region (Figure 1a). This was in contrast to AD which showed a more extensive and global pattern of cortical atrophy (Figure 1c). However, we did not find significant areas of GM atrophy in the occipital areas (p < 0.05, corrected) in DLB, or significant differences between DLB and AD. In a VBM study of patients comparing DLB and Parkinson's disease dementia, Beyer et al. (Reference Beyer, Larsen and Aarsland2007) reported reduced tissue concentration of the left occipital gyrus in the DLB group. However, volumetric studies using ROI (Middelkoop et al., Reference Middelkoop2001) and VBM (Burton et al., Reference Burton2002; Whitwell et al., Reference Whitwell2007) did not find significant occipital structural changes. Our study suggests that some neuronal loss in the parieto-occipital areas does occur although it did not reach statistical significance when corrected for multiple comparisons, and does not appear more pronounced than in AD. It seems more likely that the characteristic neuropsychological changes in DLB may reflect neuronal or synaptic dysfunction rather than neuronal loss. Our results also support previous studies suggesting that underlying structural changes are not sufficient to explain the functional metabolic abnormalities in the posterior parietal and occipital cortex which are seen in DLB but not AD.
Strengths of the study include a large and well-characterized group of patients with probable DLB. In addition, the dementia groups were well matched for age, level of education, and dementia severity. We were therefore able to report results corrected for multiple comparisons using the family-wise error which is in contrast to some other studies. This means there is a high likelihood that our findings represent true differences between the groups, although the potential disadvantage with using this method is the possibility that we may have missed, or underestimated, the degree of true MRI differences between the groups (type II error).
As with all ante-mortem neuroimaging studies, the reliance on clinical diagnostic criteria rather than pathological diagnosis is a potential limitation. However, the methods of diagnosis are robust and clinical scales used are well validated. This method has been shown to have high specificity in autopsy validation studies (McKeith et al., Reference McKeith2000).
In conclusion, we have demonstrated a pattern of GM loss affecting the temporal, parietal, occipital, and subcortical structures in DLB when compared with controls. These changes were generally less extensive than seen in AD. In particular, we have shown that there was significantly less medial temporal lobe atrophy in the DLB group when compared to AD. This finding, along with pathological validation studies, suggest that the degree of medial temporal atrophy may be a more useful imaging biomarker than previously thought. Relative preservation of the MTL structures has been included as a supportive feature in the revised consensus criteria for DLB and our findings support its inclusion.
Conflict of interest
None.
Description of authors' roles
R. Watson was responsible for recruiting and assessing the study participants, including subject diagnostic rating, analyzed the data, developed the research question and prepared the paper. J. T. O'Brien oversaw the study, provided subject diagnostic rating, supervised R. Watson, assisted with the development of the research question and reviewed and revised drafts of the paper. R. Barber was involved in the subject diagnostic rating and reviewed the paper. A. M. Blamire oversaw the study, supervised R. Watson, assisted with the development of the research question and reviewed and revised drafts of the paper.
Acknowledgments
This work was supported by the Sir Jules Thorn Charitable Trust (grant number 05/JTA). We thank Josh Wood, Assistant Psychologist and members of NE-DeNDRoN, Karen Morgan and Barbara Wilson for their assistance with recruitment and assessment of study participants, and the Newcastle Magnetic Resonance Centre radiographers. We also thank Sean Colloby, Institute for Ageing and Health, for his support with the image analysis.