Implications
The devices evaluated in this study are the first to be developed for the category of growing cattle in Brazil; they represent an advancement in precision farming and have the potential for adoption and use in facilities, mainly in research centres, in the country. The objective of the study was to validate the automatic feed and water bin Intergado® (Intergado® Ltd, Contagem, Minas Gerais, Brazil) system, based on radio frequency technology, for animals in the growth stage.
Introduction
The time spent feeding or drinking may be a useful predictor of total daily intake, and has been evaluated to understand variation in feed efficiency and to predict the health status of animals. For this reason, not only changes in intake but also changes in feeding and drinking behaviour have been the focus of recent research. The study of behaviour has been traditionally carried out by direct and indirect observation using time-lapse video recordings (Friend et al., Reference Friend, Polan and McGilliard1977; Vasilatos and Wangsness, Reference Vasilatos and Wangsness1980; Huzzey et al., Reference Huzzey, von Keyserlingk and Weary2005), making collection of behavioural data from a large group of animals on several days difficult and time-consuming. The radio frequency identification (RFID) allows for identification of a specific animal at a feed bin and, therefore, allows for the feeding system to record visits of individual animals with specific start and end times and, consequently, their intake based on the difference in weight before and after the visit. This technology has been used for the individual measurement of intake, efficiency and feeding behaviour of animals housed in groups (Lancaster et al., Reference Lancaster, Carstens, Crews, Welsh, Forbes, Forrest, Tedeschi, Randel and Rouquette2009), as well as for the selection of more efficient animals through identification of those that feed less for the same level of production. It may also be valuable in early identification of diseases, such as, respiratory diseases (Quimby et al., Reference Quimby, Sowell, Bowman, Branine, Hubbert and Sherwood2001; González et al., Reference González, Tolkamp, Coffey, Ferret and Kyriazakis2008), metritis (Weary et al., Reference Weary, Huzzey and Von Keyserlingk2009) and acidosis (Robles et al., Reference Robles, González, Ferret, Manteca and Calsamiglia2007).
The Intergado® system developed for young cattle provides automatic measures of feed and water intake and feeding and drinking behaviour (continuous measures of visit frequency and duration) for animals housed in groups with free access to the bins. To date, no data that validate measures from this system for young cattle have been published. The objective was to validate the measures of feeding and drinking behaviour as well as intake electronically collected from the Intergado® system by comparison with time-lapse video recordings and manual feed/water intake measurements.
Material and methods
All animal care and handling procedures were approved by the Universidade Federal de Minas Gerais Animal Care and Use Committe (CEUA/UFMG, Belo Horizonte, Minas Gerais, Brazil) under protocol no. 306/2013.
Animals and diet composition
A total of 35 Holstein–Gyr crossbred heifers, with an average BW of 180±52 kg and an age of 121.5±32.5 days, were distributed into three groups of 12, 12 and 11 animals per period of 4 weeks each and had free access to 12 electronic feed bins and two electronic water bins on the ‘Brejo Alegre’ commercial farm (Itaúna, Minas Gerais, Brazil). The heifers were fed ad libitum a total mixed ration consisting of 60% corn silage, 10% chopped sugarcane and 30% commercial concentrate on a dry matter (DM) basis (DM: 40.7±2.45%; CP: 14.1±0.98% of DM and NDF: 55.8±3.65% of DM; analysis based on AOAC International, 1990), twice a day (0830 and 1600 h).
Animal identification and equipment
Each heifer received an ear tag with a passive transponder (FDX – ISO 11784/11785; Allflex; Joinville, SC, Brazil) in the right ear. They were also identified using semi-permanent paint markings made on the head. Video cameras (Car Rear View Camera 1/4 ‘CCD OV136’; RUI-LON, Guangzhou, China) were placed in the roof to simultaneously capture events in two equipments. The images were recorded on a video recorder (DVR Stand Alone H.264; SPYA Express, Sao Paulo, Brazil). Fluorescent lamps (100 W) were used to facilitate animal identification from the video recording captured at night. The clocks of the video recorder and the Intergado® monitoring system were synchronised.
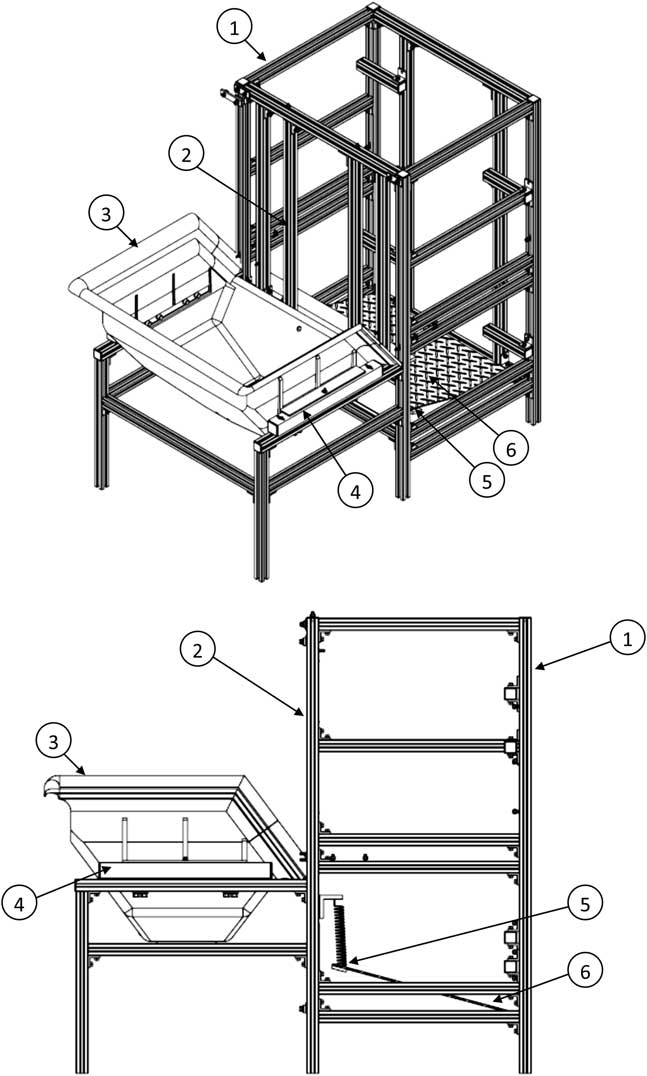
The equipment consisted of extruded aluminium structural framing and polyethylene bins, which were located on load cells to measure consumption (Figure 1). The load cells on the feed bins had a capacity of 100 kg with a precision of ±25 g. In the water bins the capacity of the load cells was about 55 kg, with an accuracy of ±25 g. Access to the bins was free, there was no gate, and no RFID antennas coated with rubberised material that lines the neck bars were used.
The feed bins (AF 1000 Junior). 1: Extruded aluminium structural, 2: radio frequency identification antennas (RFID), 3: polyethylene bins, 4: load cells, 5: mechanical switch – presence sensor and 6: mat – presence sensor.
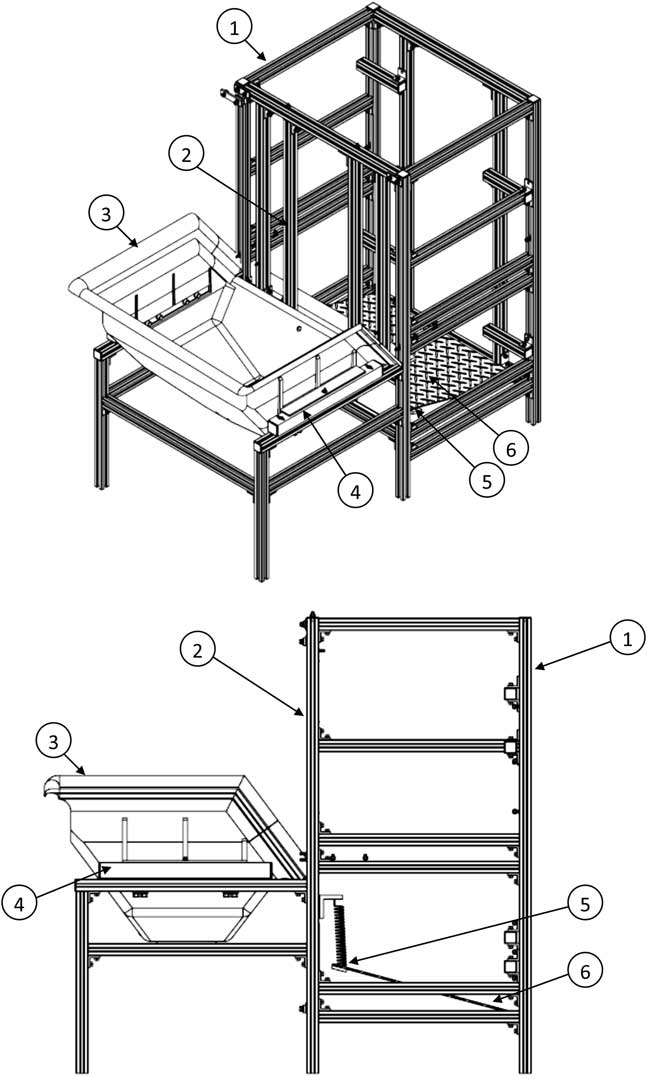
The feed bins (AF 1000 Junior) were 0.80 m wide, 0.70 m long and 0.30 m deep, suitable for young cattle of about 80–300 kg BW. Each feed bin had a mat, located in front of the neck bars, which was coupled to a mechanical switch with an integrated infrared presence sensor that, when pressed by animal’s front hooves, allowed the identification of the ear tag by the antenna.
The water bins (WD-1000 Junior) were 0.80 m wide, 1.00 m long and 0.40 m deep, and were programmed to hold 45 kg of water. Each water bin is coupled to a body-weighing platform suitable for young cattle (0.60 m wide, 1.20 m long and 1.2 m high; weighing capacity of 500±0.5 kg), and the live weight of the animals was registered each time they accessed the water bins. There were separate load cells for the water bin and for the body-weighing platform. The water intake was computed based on the values of water bin load cells, using the difference of bin weight at the beginning and end of each visit. Moreover, the device was equipped with lateral bars that limited access to the water bin to one animal. Water bins were programmed to refill automatically when the water mass was <20 kg and the animals had left the platform.
For each bin visit, the system documented the visit duration and feed and water intake by recording animal’s identification tag, bin number, initial and final times of visits as well as the difference between feed and water weight at the start and end of each bin visit. These data were continuously registered using a data collector via network cable and transferred to the Intergado® web software via a general packet radio service. The system included a backup battery with up to 5 h of energy in case the main power failed.
Intake measurements and behavioural observations
To validate the system’s ability to monitor feed and water intake per visit, an independent scale (BPS15, Filizola, Brazil and 2096 DO/IV, Toledo, São Paulo, Brazil, respectively) was used. For each feed bin, two feeding events were monitored using manual weighing immediately before and after the animal’s visit and the difference between them was assumed as feed intake (n=24 observations). For the water bins, 60 independent weighings were made. For each single bin visit, the feed or water was manually removed and weighed; the bin was refilled thereafter. The feed and water intakes registered using the monitoring system were compared with the manually measured feed and water intake (initial weight minus final weight determined using the external scale).
Feed bins were monitored using time-lapse video recording over 4 days and the water bins were monitored over 6 days to evaluate the bin visit duration. The time-lapse video recordings were assessed by a trained observer. The animals were tagged as present or absent at the bins when their head passed over the panel. Video data on animal behaviour were compared with those generated by the system.
Statistical analysis
Feed and water intake and visit duration computed by Intergado®’s system were evaluated by fitting linear models in which the independent measurements (independent scale and time-lapse video, i.e. observed) were regressed over Intergado®’s measurements (i.e. predicted). For feed bins, because of the larger number of units, a mixed approach was used to evaluate the whole system usage, in which feed bin units were assigned as a random term. This approach would render a more reliable evaluation, less dependent on each feed bin’s isolated response. Confidence intervals for the estimated coefficients, intercept and slope, were evaluated to check whether they would contain the values of 0 and 1, respectively, which indicates no bias as it would correspond to a y=x regression. The mean squared prediction error (MSPE, s 2), root MSPE (s) and mean bias (%) of each fitted model were computed to evaluate the system’s accuracy, whereas the correlation (r) and coefficient of determination (r 2) were used to evaluate the system’s precision (Tedeschi, Reference Tedeschi2006). All analyses were performed in R environment, using NLME and hydroGOF packages.
As described by DeVries et al. (Reference DeVries, Von Keyserlingk, Weary and Beauchemin2003), the sensitivity (represented by the ability to predict consumption or animal presence when it is in fact present or consuming) and the specificity (represented by the system’s ability to predict animal absence or absence of consumption when it is in fact absent or not consuming) were measured. Sensitivity and specificity for presence at the feed and water bins were evaluated by comparison of data from video analysis with electronic records from the feeding system. The visit events were defined as animal presence (with subsequent output) in the feed bins, or in the water bins, over the days of observation.
Results and discussion
Intake predictability
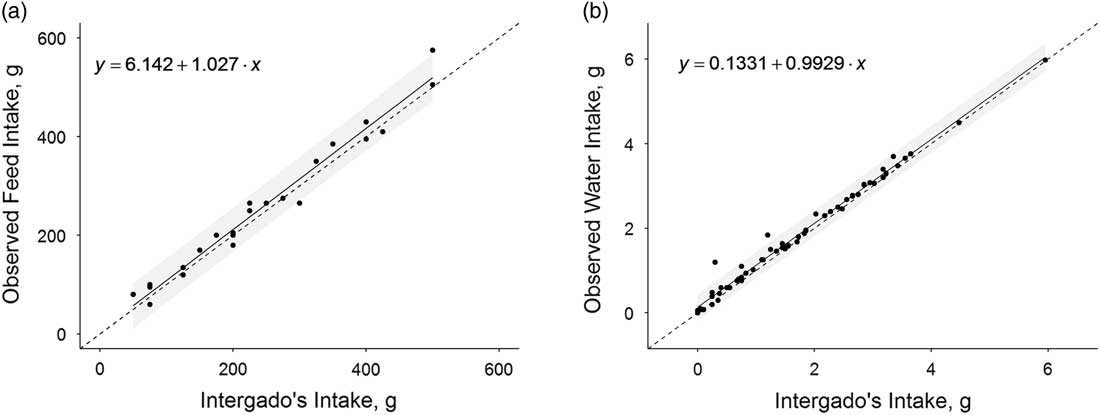
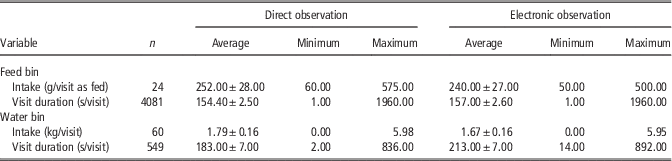
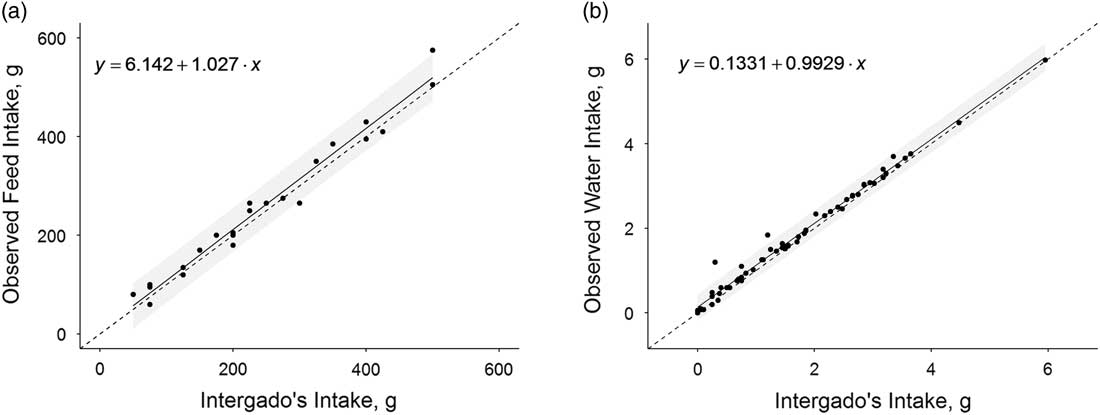
The average feed intake per visit, as well as the average water intake per visit, measured using the electronic system (240±27 g and 1.67±0.16 kg, respectively) were similar to the manual measurments performed using the external scale (252±28 g and 1.79±0.16 kg, respectively) (P>0.05; Table 1). The regression coefficient was high for feed and water intakes (0.973 and 0.986, respectively) (Table 1; Figure 2). These results are in agreement with those obtained from other studies using similar equipment (Bach et al., Reference Bach, Iglesias and Busto2004; Chapinal et al., Reference Chapinal, Veira, Weary and Von Keyserlingk2007). Further, considering that the margin of error allowed for equipment is ±25 g (accuracy of load cells), there was a reduced percentage of errors outside this range.
Feed (a) and water (b) intake measured used an external scale v. feed and water intake recorded by the system. Dashed line represents y=x.
Average, maximum and minimum values for feed intake per visit (g), visit duration to the feed bins (s), water intake per visit (kg) and visit duration to the water bins (s), estimated by the electronic registers (electronic observations) and manual weighing and video observations (direct observations)

Visit detection and animal identification
The electronic system detected 4129 visits to the feeding bins; however, 4118 records were observed on the videos. In 31 events (0.75% in 4129), one specific animal was present in the feeding bin and detected in the video, but not on the electronic system, representing a sensitivity of 99.25%. In 42 events, (1.02% of 4129) heifers should have been considered absent at the feeding bins using the electronic system, but were recorded as present, representing a specificity of 98.98%. In six records, (0.15% of total), the animal identified using the electronic system at the feeding bin differed from the one identified on the video.
The system detected 557 visits to the water bins. On video records, 556 visits were observed. In all, seven events (1.26% of 557) detected on the videos were not recorded by the system (98.74% sensitivity), and eight events (1.44% of 556) registered by the system were not observed on the videos (specificity 98.56%). The discrepant events observed in the water bins were due to the fact that the electronic system considers the animal as present when they climb on the weighing platform. However, to be registered as a valid event, the animal has to be identified, which happens when it is close to the antenna positioned at the frontal opening to the bin. On the other hand, the event is ended only after the animal’s complete exit: that is, when its four feet are out of the platform surface. On the video, the animal was considered present when its head was ahead of the opening. Those differences explain why it is expected that Intergado®’s event duration may be slightly longer than the video’s. Moreover, the seven events detected on the video, but not by the electronic system, may be attributed to events in which animals took their heads off the window but remained over the weighing platform and, then, returned after a while, which would render either two or one visits to the water bin in the video and Intergado®, respectively. On the contrary, the eight events detected by the electronic system, but not in the video, were related to events in which the animals climbed the platform, getting close enough to the front window to be detected by RFID antenna but without completely passing the head through the opening, and, for this reason, not being computed as a visit using video.
Other studies using similar equipment were made in the last decade. The sensitivity of the Intergado®’s feeding system was higher than the results reported by DeVries et al. (Reference DeVries, Von Keyserlingk, Weary and Beauchemin2003; 87.7%) and Mendes et al. (Reference Mendes, Carstens, Tedeschi, Pinchak and Friend2011; 86.4), but the specificity was similar to results reported by these authors (DeVries et al., Reference DeVries, Von Keyserlingk, Weary and Beauchemin2003; 99.2%; Mendes et al., Reference Mendes, Carstens, Tedeschi, Pinchak and Friend2011; 99.6).
Visit duration
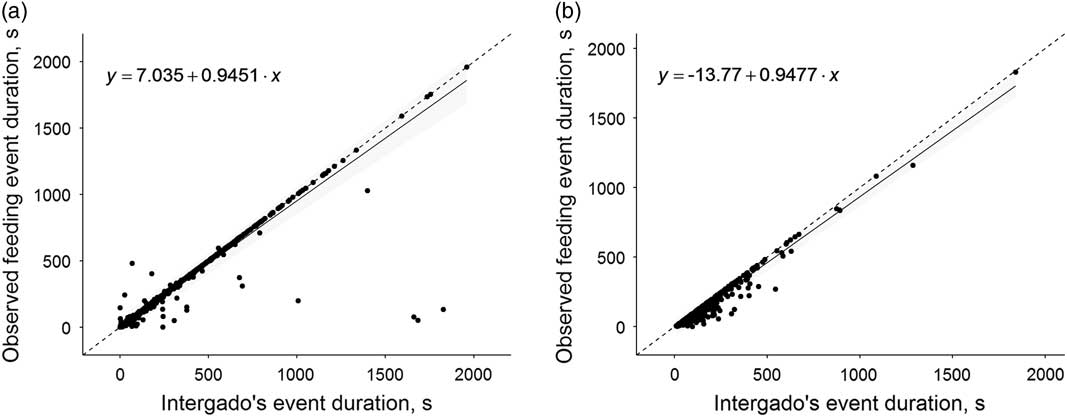
The time spent in the feed bin determined using the monitoring system was similar (P>0.05) to data from video recording (157±2.6 and 154.4±2.5 s, respectively; r 2=0.917) (Table 1; Figure 3). The confidence interval of the intercept and slope did not differ from 0 and 1, respectively, showing satisfactory approximation between systems. Moreover, the high values of correlation and coefficient of determination indicates that the equipment was accurate in detecting the visits. Although a high bias was not detected, the mean square error found can be explained by a few isolated events observed in a specific feed bin (device 413), which showed rupture of the springs of the mat, making it impossible to detect the end of the event (i.e. bin visit).
Visit duration to the feed bin (a) and the water bin (b) observed on the videos v. visit duration recorded by the system. Dashed line represents y=x.
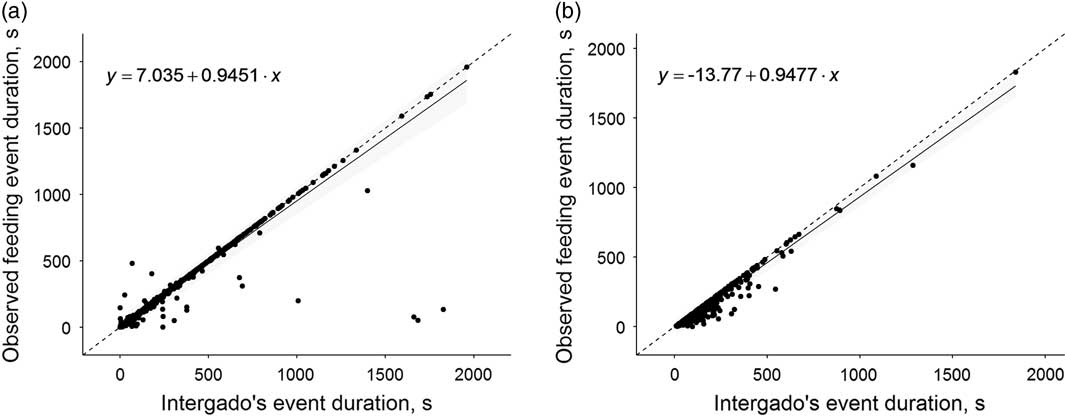
As a result, multiple events generated by different animals have been interpreted by the system as a single long-term event generated by a single animal. Another possible fault associated with the mat may have been caused by reed switch sensors, as they can be activated by external magnetic fields of low or high intensity (Luechinger et al., Reference Luechinger, Duru, Zeijlemaker, Scheidegger, Boesiger and Candinas2002). This peculiarity of device 413 was confirmed by the random coefficients estimated for each equipment in the fitted mixed model, in which the random slope and intercept where shifted by about nine times for this specific device compared with overall coefficients. The time spent in the water bin determined using the electronic system was similar to data registered from video recording (213±7 and 183±7 s, respectively; r 2=0.963) (Table 1; Figure 2). Although it seems that the electronic system overestimated the time to visit the water bins in 20 s, this difference between systems was not significantly different from zero (P>0.05). The differences observed in the duration of visits to the water bins recorded by the monitoring system in relation to the direct observation of the recorded images are due to the longer time spent by the animal to step down completely from the weighing platform connected to the water bin. Moreover, in some events the animals remained on the platform for a long time without even demonstrating intent to drink, but only performing the natural behaviour of exploration. These events possibly explain the estimated confidence intervals for the intercept and slope of this variable. To improve drinking behaviour measurement by the electronic system, the RFID antenna should be read upon activation of a presence sensor located closer to the water bin.The mean error value was 2.55 s, which indicates that the mean difference between the two methods was 2.55 s. This difference is considered insignificant and indicates that the system was effective in detecting the start and end of the visits. The observed mean bias value (Table 2) indicates that the system Intergado® overestimates the time at 1.7%. The rupture of the pedal springs, seen in equipment 413, prevented the detection of the end of the events in which breakage occurred, as well as detection of other events that followed, until the moment when the spring was repaired. As a result, multiple events generated by different animals have been interpreted by the system as a single long-term event generated by a single animal. Another possible failure associated with the pedals may have been caused by reed switch sensors, as they can be activated by external magnetic fields of low or high intensity (Luechinger et al., Reference Luechinger, Duru, Zeijlemaker, Scheidegger, Boesiger and Candinas2002).
Evaluation of the Intergado® registers compared with those observed in the independent systems for feed intake per visit (g), visit duration to the feed bins (s), water intake per visit (kg) and visit duration to the water bins (s)

MSPE=mean squared prediction error; RMSPE=root mean square percentage error.
The regression coefficients for the duration of visits to the feed bins observed by DeVries et al. (Reference DeVries, Von Keyserlingk, Weary and Beauchemin2003), Chapinal et al. (Reference Chapinal, Veira, Weary and Von Keyserlingk2007) and Mendes et al. (Reference Mendes, Carstens, Tedeschi, Pinchak and Friend2011) were, respectively, 0.98, 1.0 and 0.82, whereas in the present study this value was 0.92. Mendes et al. (Reference Mendes, Carstens, Tedeschi, Pinchak and Friend2011) calculated a mean bias of 1.1% and a mean squared prediction error of 72 s 2. In this experiment, those values where 1.7% and 2381.2 s 2, respectively. The last value was highly influenced by device 413, which presented a mechanical problem.
It can be concluded that the Intergado® system demonstrated good accuracy and precision in the detection of feed and water intake. Future improvements to the equipment must be made, focussing on the detection of animal presence, by replacing the feed bins pedals and adding presence sensors closer to water bins.
Acknowledgements
The authors are grateful to the Brejo Alegre dairy farm for allowing them to use its facilities and animals, as well as for providing support and human resources for the realisation of this study, and to the Intergado® company for donating the electronic equipment’s assessment of consumption.