


The fate of minorities in the face of majority rule is one of the most critical issues with which any democracy must contend. In its most basic form, democracies count votes and the side with more votes wins. That electoral equation can, however, have severe consequences for minorities. At least in theory, a slim majority of voters can elect candidates and pass laws that a large minority strongly opposes. Fears of majority tyranny are especially pronounced in the American case. The winner-take-all nature of American elections and a historical record in which the majority has repeatedly trampled the rights of different minority groups has led to widespread concerns about the evenhandedness of American democracy (Guinier Reference Guinier1994; Klinkner and Smith Reference Klinkner and Smith1999; Kousser Reference Kousser1999).
Nonetheless, we have few ways of assessing minority representation that offer a broad and a meaningful evaluation of democratic practices. When we seek to gauge how well a minority group is represented, we generally turn to one of two measures: (1) descriptive representation or (2) substantive representation. For descriptive representation we count the number of elected officials by group to establish whether a given group has representation on par with its numbers. For substantive representation we assess policy outcomes to try to ascertain whether they are in line with minority interests.
There are, however, flaws with of each of these measures. Getting minority candidates into office speaks to the openness of a democracy to minority interests but it does not tell us how effective those minority representatives are once in office. Descriptive representation also makes problematic assumptions about who can and who cannot represent minorities. Do minority candidates always represent minority interests? Likewise, do majority candidates never represent minority interests? Descriptive representation also assumes that there is a single, unified minority choice and discounts minorities who oppose that choice.
Substantive representation is, theoretically speaking, a better indicator of minority representation. In the end, what matters for a minority group is not who wins office but rather whether those in office enact policies that benefit or hurt a minority group. But there are two barriers to measuring substantive representation. First, we seldom have data on minority preferences and government actions on a specific policy decision. Second, it is difficult to assess the responsiveness of government when minorities are not unanimous in their opinions. Is a group well represented, for example, when a policy is passed after 70% of a group express a preference for the policy and 30% express opposition? The problem is worse when group preferences are evenly divided. The result is that we generate few, if any, broad assessments of the substantive representation of different groups.
To supplement these existing measures, I introduce and assess a new measure of minority representation. For any election, I count how many voters from a demographic group vote for a candidate that loses. I then compare the number of winners and losers across a range of demographic characteristics across the range of elections in American democracy. If voters from one group consistently end up on the losing side of the vote, then it is clear that they are not getting their preferences met and we need to be concerned about their representation.
This measure has a number of key attributes. First, it requires no subjective evaluation of minority interests. Minorities themselves choose which side they are on. Second, it incorporates the preferences of every minority voter. We do not have to stipulate that the candidate or policy preferred by a majority of a group is that group's favored policy or candidate. Third, it allows researchers to assess minority representation across any number of elections. Using exit polls and, when they are not available, precinct level returns, we can get a succinct and fairly comprehensive measure of minority representation across almost any set of elections.
Counting winners and losers is by no means a perfect test. Concerns about whether minorities are given a real choice in most elections, questions about whether minorities are making informed choices, and concerns about how well representatives who win with minority support are able to enact policies all need to be considered. Nevertheless, counting winners and losers has the potential to provide a systematic and telling assessment of minority influence that adds to our understanding of minority representation.
In this article, I gather election results and data on individual voting preferences for a wide number of presidential, congressional, state-level, and local elections in the United States. Specifically, I analyze data on all elections that are represented in the Voter News Service (VNS) data series and all mayoral elections in the past 20 years in large American cities for which there are available exit poll data. This analysis demonstrates that most members of most groups end up as winners in most elections in American democracy. However, the results also show that racial and ethnic minority voters lose more regularly than white voters. African Americans, in particular, are the group most likely to end up on the losing side of the vote. Importantly, racial disparities are larger than the disparities in winning and losing across other demographic groups. Race also matters after controlling for class, party, political ideology, and other key characteristics. Beyond these general findings, there are also some important patterns across different sets of elections that help to identify areas in American democracy where minorities are more successful. This analysis provides us with a fuller picture of American democracy and helps us to identify the political reforms that could make American democracy more balanced.
TYRANNY OF THE MAJORITY?
The majoritarian nature of the electoral process inevitably raises questions about the welfare of minorities in a democracy. Do minorities really have a say or are they subject to the whims and wishes of the majority? The potential consequences of majority tyranny, as many have noted, are severe: “In a world of bloc voting, with one candidate per bloc, the minority is completely shut out. Not only can it not elect one of its own; it cannot even influence whom the majority elects” (Guinier Reference Guinier1994, 58).
American democracy is by no means immune to these concerns about minority interests. Anxiety about the fate of minorities in this nation goes back to the Founders. James Madison is famous for declaring that, with majority rule, policy would “too often be decided, not according to the rule of justice and the rights of the minor party but by the superior force of an interested and overbearing majority” (Hamilton, Madison, and Jay Reference Hamilton, Madison, Jay and Fairfield1961, 77). America's electoral system also does little to allay these fears. The fact that almost every election in the United States is conducted under “winner-take-all” majoritarian rules only serves to heighten concerns about the welfare of minorities in American democracy. Comparative studies have generally shown that majoritarian systems such as the United States are, in practice, less friendly to minority interests than proportional representation systems (Lijphart 1994; Taagepara and Shugart Reference Taagepara and Shugart1989). If there is going to be tyranny of the majority in any democracy, a majoritarian system such as the United States is a likely candidate.
At the same time it should be noted that majority tyranny is by no means inevitable. Even in a winner-take-all system, minorities can have considerable influence. If a majority group is divided over policy and candidate choice, then minority voters can provide the decisive swing vote. In fact, if the majority is evenly divided, minorities can determine the outcome of most elections. Moreover, minorities may even have influence in cases where the majority is not divided. Downs’ median voter theorem suggests that if parties or candidates who seek office are not responsive to the median voter, a challenger can take that median position and win (Downs Reference Downs1957). If true, every vote counts and each additional minority voter will “alter the equilibrium location in the direction of their own preferences” (Benoit and Shepsle Reference Benoit, Shepsle and Peterson, NJ1995, 54). In this way, the outcomes of democracy respond to the preferences of all voters.
What is the reality in the United States? Are fears of majority tyranny really founded? And if so, which minorities are the big losers? Theoretically, any group that comprises less than a majority of the electorate could end up being trampled by a winner-take-all majoritarian system. But in practice, this general concern about minority interests has become increasingly focused on the well-being of racial and ethnic minorities (Guinier Reference Guinier1994; Klinkner and Smith Reference Klinkner and Smith1999; Kousser Reference Kousser1999).
Two sharply divergent views exist on the more specific question of how open America's democracy is to racial and ethnic minority interests. Some maintain that evidence of the underrepresentation of racial and ethnic minorities is overwhelming (Fraga Reference Bennett and Resnick1992; Guinier Reference Guinier1994). There are certainly plenty of examples of white tyranny in America's electoral past. Blacks and other racial and ethnic minorities were altogether barred from democratic participation for much of the nation's history (Almaguer Reference Almaguer1994; Kim Reference Kim1999; Klinkner and Smith Reference Abramowitz and Saunders1999). Even after these racial minority groups were given the right to vote, whites regularly mobilized to prevent them from using that vote to gain power (Holt Reference Holt1979; Kousser Reference Kousser1999; Parker Reference Parker1990). Critically, there are those who claim that race retains much of its significance in American democracy. Racial policy questions are often the decisive factor in electoral choice (Carmines and Stimson Reference Carmines and Stimson1989; Edsall and Edsall Reference Edsall and Edsall1991). When minority candidates seek office, study after study has found that most white voters favor the white candidate over the racial and ethnic minority candidate (Bullock and Dunn Reference Bullock and Dunn1999; Hajnal Reference Hajnal2007; McCrary Reference McCrary1990). Moreover, many scholars believe that racial prejudice and a desire to maintain the racial hierarchy are behind much of this white resistance (McCrary Reference McCrary1990; Reeves Reference Reeves1997). The bottom line, according to these scholars is that continued white aversion to minority candidates and minority interests makes it quite likely that tyranny of the white majority is not an historical relic. As Luis Fraga put it in an overview of minority representation, “Any knowledgeable student of the Voting Rights Act understands that the crucial fact of minority politics—whether that of African Americans, Latinos, or other groups—is their exclusion from the mainstream of American political affairs in spite of their desire to be full participants in it” (Fraga Reference Fraga, Grofman and Davidson1992, 278).
But others see a very different world in which race is no longer the dominant factor in elections and the trampling of minority right is now rare (Swain Reference Swain1995; Thernstrom and Thernstrom Reference Thernstrom and Thernstrom1997). These authors claim that the presence of majority tyranny is assumed rather than measured. They note the increasing willingness of white voters to support minority candidates (Hajnal Reference Hajnal2007; Highton Reference Highton2004b; Citrin, Green, and Sears Reference Citrin, Green and Sears1990). They highlight the growth of minority elected officials at every level of office (APALC 2007, JCPS 2003, NALEAO 2006). They point to evidence that white racial attitudes have liberalized (Schuman et al. Reference Schuman, Steeh, Bobo and Krysan1997). And they emphasize research that suggests that although racial considerations may have been the principal dividing line in American politics, they may no longer be (Abramowitz and Sanders Reference Abramowitz and Saunders1998). The reality of American democracy, these scholars claim, is that outcomes are largely evenhanded. If anything blacks, Latinos, and Asian Americans are overprivileged by “affirmative action in the electoral sphere” (Thernstrom Reference Thernstrom1987, 242). If we want to return to a fairer, more equitable democracy, we need to revoke an array of special entitlements based on racial minority status (Butler Reference Butler1995; Chavez Reference Chavez1992).
MEASURING MINORITY REPRESENTATION
How can scholars reach such starkly different conclusions about minority representation in American democracy? Part of the answer, I believe, is that we have had an extremely difficult time finding a measure that provides a broad assessment of how minorities are faring in democracy. When scholars seek to determine just how well represented minorities are in a given democracy, they generally turn to one of two different measures. Either they count the number of minority elected officials to get a measure of descriptive representation or they attempt to measure the correspondence between minority policy preferences and actual policy outcomes to get measure of substantive representation.Footnote 1
Both measures offer real insight into minority representation. Descriptive representation provides an obvious and arguably critical measure of minority success (Mansbridge Reference Mansbridge1999; Phillips Reference Phillips1998). The election of minorities to key offices is important to minority communities for reasons that range from symbolic to more concrete. By demonstrating the openness of a democracy to the minority community, descriptive representation can be critical in instilling legitimacy and trust in a political system and in fostering the participation of minorities in that system (Bobo and Gilliam Reference Bobo and Gilliam, Jr1990; Tate Reference Tate2003). Descriptive representation can also be a powerful tool to demonstrate the competence of minority leaders and the compatibility of minority interests with those of the majority white community (Hajnal Reference Hajnal2007). Moreover, studies suggest that descriptive representation can and often does lead to changes in policy (Browning, Marshall, and Tabb Reference Browning, Marshall and Tabb1984; Karnig and Welch Reference Karnig and Welch1980.Footnote 2 Finally, it is clear from a wide range of studies that minority voters in biracial contests usually favor—often overwhelmingly favor—minority candidates (Hero Reference Hero1989; McCrary Reference McCrary1990). For all of these reasons, there is little disputing the fact that the election of minorities to office can represent a major achievement for the minority community. Thus, when scholars want to gauge the level of minority representation, the measure they use is almost always descriptive representation (Bowler, Donovan, and Brockington Reference Bowler, Donovan and Brockington2003; Bullock and Dunn Reference Bullock and Dunn1999; Davidson and Grofman Reference Davidson and Grofman1994; Menifield Reference Menifield2001).
Nevertheless, there are real problems with a singular focus on descriptive representation. One of the most regularly cited criticisms of descriptive representation is that it ignores what happens after the election (Pitkin Reference Pitkin1967). Counts of the number of minority elected officials tell us little about how effective those minority representatives are once in office. Minority elected officials can and do have an impact in some cases but in many others they do not. Moreover, there are concerns—especially in the case of race and ethnicity—that a small number of minority legislators will be regularly outvoted by the majority white legislators (Guinier Reference Guinier1994). The end result could be widespread descriptive representation that fails to deliver real policy benefits to minority groups.
Descriptive representation also makes problematic assumptions about who can and who cannot represent minorities. By counting minority elected officials and ignoring majority elected officials, descriptive representation implicitly assumes that members of the majority group cannot represent minority interests. This leads to two important problems. First, it means that all majority leaders are viewed the same way and are discounted. But do majority candidates never represent minority interests? Did a president like Lyndon Johnson who helped passed some of the most significant civil rights legislation ever enacted in this nation not provide racial and ethnic minorities with representation? More broadly, research that directly compares racial and ethnic minority elected officials and white elected officials suggests that white leaders can and do represent minority interests—if not quite as strongly as minority representative do (Hero and Tolbert Reference Hero and Tolbert1995; Swain Reference Swain1995). Ignoring white leadership is a potentially major omission in a nation where roughly 90% of all elected officials are white (Hajnal Reference Hajnal2007).
By discounting majority leaders, we also discount the influence that minority voters can have on majority leaders. Yet, the evidence suggests that minority voters can influence the policy positions of leaders who are from the majority group. In the case of race and ethnicity, a range of scholars have demonstrated a positive relationship between the size of the black community and the degree to which elected leaders support minority interests (Cameron, Epstein, and Halloran Reference Cameron, Epstein and Halloran1996; Lublin Reference Lublin1997).Footnote 3 This is especially problematic in the American racial case where the vast majority of racial and ethnic minorities live within districts or political boundaries where whites are the dominant majority, where few minority candidates ever run for office, and where representation is almost always white. Over 70% of all blacks, for example, live in state and federal districts that are majority white, and across the nation only about 1% of all of these majority white districts have ever elected a black candidate to office (Handley and Grofman Reference Handley, Grofman, Davidson and Grofman1994, Lublin Reference Lublin1997). Since Latinos and Asian Americans are much less residentially segregated than African Americans, the proportion of Latinos and Asian Americans living with whites under white leadership is much higher (Massey Reference Massey, Smelser, Wilson and Mitchell2001). If these racial and ethnic minorities have any influence on their white leaders, studies of descriptive representation may be missing most of the influence that minority voters have in America.
Finally, descriptive representation assumes that minority elected officials represent minority interests. Although empirical studies of racial voting patterns show that most minority voters tend to prefer minority candidates in most biracial elections, that is certainly not always the case (Bullock and Dunn Reference Bullock and Dunn1999; Loewen Reference Loewen1990; McCrary Reference McCrary1990). Black Republican candidates, for example, rarely obtain the support of most black voters. Similarly, it is hard to see conservative Cuban politicians as being true representatives of the larger, liberal Latino community. Moreover, even in cases where most minorities favor the minority candidate, support within the community is usually far from unanimous. Is it fair to count those minority voters who opposed minority leadership as being well represented when they wind up as losers in the election? In short, minority leaders may not represent the interests of all (or even most) minority voters.
These criticisms of descriptive representation have led scholars to seek an alternative. To date the main alternative has been substantive representation. In concept, substantive representation is the ideal measure of minority influence (Cameron, Epstein, and Halloran Reference Cameron, Epstein and Halloran1996; Lublin Reference Lublin1997; Overby and Cosgrove Reference Overby and Cosgrove1996). We care about who is elected, but we care more about the policies they enact. By trying to assess how closely policies mirror minority preferences, substantive representation gets at the core of democratic responsiveness.
The main problem with substantive representation is that it is usually extremely difficult to measure the fit between minority preferences and policy outcomes. We sometimes have good measures of policy outcomes but we rarely have good measures of minority views on those specific policies. The result is that studies of substantive representation tend to focus on a specific locality and a single policy choice. For example, important research has looked at the effects of an expanded black electorate on policy outcomes in specific states (Keech Reference Keech1968; Parker Reference Parker1990) or the effect of expanded descriptive representation on a particular policy outcome across cities (Browning, Marshall, and Tabb Reference Browning, Marshall and Tabb1984; Eisinger Reference Eisinger1982; Kerr and Mladenka Reference Kerr and Mladenka1994; Meier and England Reference Meier and England1984). More recently, studies have been able to examine the correspondence between minority opinion and the voting records of individual legislators (Bartels Reference Bartels2008; Griffin and Newman Reference Griffin and Newman2007; Lublin Reference Lublin1997; Whitby Reference Whitby1997). These studies provide insight into one office, one location, or one aspect of policy but they do not provide an overall evaluation of minority representation. Judging by these studies, it is hard to know how well minorities are doing in American democracy.
When researchers do try to make broader statements about the substantive representation of minorities, they often have to infer or assume minority preferences across most of the policy arenas they examine (Cameron, Epstein, and Halloran Reference Cameron, Epstein and Halloran1996; Lijphart 1994; Taagepara and Shugart Reference Taagepara and Shugart1989, but see Canon Reference Canon1999, Gilens Reference Gilens2005; and Griffin and Newman Reference Griffin and Newman2007). Thus, studies that find that direct democracy is one the main barriers to racial equality must do so without any hard data on how racial minorities voted in direct democracy (Bell Reference Bell1978). Research proclaiming that black leaders have failed to serve the black community rarely cites black public opinion (Reed Reference Reed and Smith1988; Smith Reference Smith1996). And comparative studies that make claims about the responsiveness of government policy to minority interests make broad assumptions about what minorities want across different countries (Lijphart 1994). Since we don't really know the true preferences of minorities, it is difficult to tell how far policy outcomes are from the minority ideal point.
A final drawback of substantive representation is that minorities are rarely of one mind on policy choices. Often large segments of the minority community favor one kind of policy while other segments favor a very different policy. This leads to a difficult question. How well, for example, are minorities represented when welfare spending goes up, if 60% favor increased spending, 20% favor no change, and 20% favored decreased spending? To measure substantive representation, we generally have to assume that there is one preferred outcome for the group as a whole and we have to ignore the interests and preferences of any minorities who oppose the minority-preferred outcome (but see Gilens Reference Gilens2005; Griffin and Newman Reference Griffin and Newman2007, Reference Griffin and Newman2008).
A NEW MEASURE—COUNTING WINNERS AND LOSERS
To supplement these existing measures and to help gauge how well minorities are represented in American democracy, I introduce a new measure that identifies winners and losers in the electoral process.Footnote 4 The measure is straightforward. For each election, I simply count how many voters from different demographic groups end up voting for a candidate who eventually wins and how many voters from different demographic groups end up voting for a candidate who eventually loses. I then repeat this for a wide range of elections to attain a more global assessment of how well minorities are faring in democracy. After the tabulations are complete, I compare the proportion of winners and losers across a range of key demographic characteristics that regularly divide the electorate.
Counting winners and losers gets to the heart of democracy. In a democratic system, winners and losers are defined by the outcome of the vote. If your side gets more votes, you win. If your side gets fewer votes, you lose. Thus, how often a group wins or loses seems to provide a telling overall accounting of democratic outcomes. A count of winners and losers also gets at basic notions of fairness and equity. If members of different groups all end up on the winning side of the vote a roughly equal amount of the time, then outcomes do not appear to be particularly biased against any group. If, on the other hand, members from one group consistently end up on the losing side of democracy, then it seems likely that their interests are not being well represented by the system in which they live.Footnote 5
Looking at voters and their electoral outcomes also has the added benefit of bringing us closer to legal definitions of minority rights. The Voting Rights Act and the courts at various points in recent decades have made it clear that one of the most important rights racial and ethnic minorities have in American democracy is the right “to elect a representative of their choice” (Section II of the Voting Rights Act). If your choice consistently loses, you almost by definition have less opportunity to elect representatives of your choice. Thus, by counting votes and adding up winners and losers by race and ethnicity, we come close to an assessment of the core legal metric of “minority vote dilution” (Davidson and Grofman Reference Davidson and Grofman1994).
Some of the other strengths of this new measure are best illustrated by a comparison with the two existing measures of representation. Table 1 displays just such a comparison. One key attribute of counting winners and losers that distinguishes it from the other two measures is the objective nature of vote counting. Since we are using actual votes (or exit polls), there is no need to guess at what minority interests are. We don't need to try to identify the minority candidate (as in descriptive representation) or speculate about what should be seen as the minority-preferred policy (as is often the case with substantive representation). A voter who favored one candidate and lost is a loser in that election. Likewise, a voter who favored a candidate who wins is deemed a winner.
Key Attributes of Three Different Measures of Minority Representation

In adding up votes, there is also no need to assume that minorities are of one mind. In contrast to descriptive representation where there is one minority candidate or substantive representation where there is one minority-favored policy, when we count winners and losers we can explicitly integrate the level of cohesion or division within any group. If all male voters support one candidate and that candidate wins, men are counted as having won by a large margin. If, however, only a slim majority of male voters supports the candidate that wins, this new measure counts men as coming out roughly even. A related advantage of counting winners and losers is that it incorporates the preferences of every individual member of the group. Unlike descriptive representation where minorities who oppose the minority candidate are discounted or substantive representation where minorities who disagree with the minority-favored policy are disregarded, in this new measure, all of these individuals and their votes are included.
Perhaps the principal advantage of this measure is that it offers the opportunity to make a comprehensive assessment of the influence of racial and ethnic minorities in a democracy. We focus not on one set of elections, one set of voters, or one type of office. Instead, we can look at virtually the entire range of offices and outcomes. This includes elections with and without minority candidates and even more importantly it includes elections both inside majority-minority places and outside majority-minority places where the vast majority of blacks, Latinos, and Asian Americans actually live and vote. In short, it is a fairly global measure of winners and losers in American democracy.
Limitations
Counting winners and losers does, however, have some limitations. The chief concern is likely to be that it is not a direct assessment of policy outcomes. Electoral outcomes may or may not translate into substantive policy outcomes. A related problem is that even when a candidate who personifies minority interests is voted into office and tries to represent minority interests, she may be blocked by a more numerous legislative voting bloc that favors majority interests (Guinier Reference Guinier1994).
One way to partially address this concern is to include a broader sample of elections. If minorities win one or two elections, it may not sway policy. But if across all elections minorities fare as well as the majority, it seems unlikely that minority voters would have little say in policy outcomes. Policy will surely not be perfectly correlated with a count of winners and losers in the electoral arena, but if we look at enough elections, there should be considerable correlation between the two. Nevertheless, given this concern, it is important to use a count of winners and losers as a supplement to, rather than as a replacement for, studies of substantive representation.
A related concern with counting winners and losers is that minorities in America may not be given a meaningful choice. Control over the agenda and the selection of candidates for the ballot may be so skewed by the majority that the choice that minorities ultimately face may be one of the lesser of two evils (Kingdon Reference Kingdon1997).Footnote 6 This concern is real and should not be dismissed. There are, however, several factors that may mitigate fears about the validity of counting winners and losers. First, there is a fairly extensive literature that has repeatedly and consistently demonstrated that voting for a losing candidate has consequences. In particular, a multitude of studies has demonstrated across a wide variety of settings that supporters of losing candidates have substantially lower levels of trust in government, less political efficacy, and greater feelings of powerlessness (Anderson and LoTempio Reference Anderson and LoTempio2002; Craig et al. Reference Craig, Martinez, Gainous and Kane2006). These studies also find that losers are less satisfied with government performance and are more apt to believe that the electoral system is not fair (Anderson and Guillory Reference Anderson and Guillory1997; Craig et al. Reference Craig, Martinez, Gainous and Kane2006; Nadeau and Blais Reference Nadeau and Blais1993). Finally, losers are more likely to want to reform electoral institutions (Bowler and Donovan Reference Bowler and Donovan2006). In short, winners feel like they won and losers feel like they lost.Footnote 7
Concerns that minorities are not being given a meaningful choice can also be evaluated in more concrete ways. By looking at primary elections, we can get a better sense of whether minorities are able to get their favored candidates placed on the general election ballot. If minorities exert strong influence in primaries, then we can be more confident that they are being given a real choice in general elections. If however, minorities regularly lose out in both types of contests, then we have a stronger sense that democracy is not representing their interests.Footnote 8 Later in the paper, I examine outcomes in primaries.
A focus on individual voting behavior also implicitly assumes that voters can figure out their true preferences. Given that scholars have argued that many Americans simply do not have enough information about politics to make reasoned, rational decisions, this may be a difficult assumption for some to make (Converse Reference Converse and Apter1964; Delli Carpini and Keeter Reference Delli Carpini and Keeter1996). However, more recent scholarship seems to suggest that the average American can use a range of shortcuts or heuristics to make reasonable decisions in the political arena (Lupia Reference Lupia1994; Popkin Reference Popkin1991). At least in terms of the act of voting, it appears that, most of the time, we get it right (Bartels Reference Bartels1996; Lau and Redlawsk Reference Lau and Redlawsk1997). Moreover, studies have shown that while individual opinions may sometimes be ill-informed and irrational, aggregate public opinion is quite reasoned and rational (Page and Shapiro Reference Page and Shapiro1992).
In focusing on the vote and electoral outcomes, we also overlook other important elements of the democratic process. The representation that minorities do or do not receive via the interest group system or through the responsiveness of the bureaucracy could very well alter our perceptions of how well different minority groups are represented in American democracy (Meier and England Reference Meier and England1984; Schlozman and Tierney Reference Schlozman and Tierney1986). If minorities are well represented in these other arenas, then electoral defeat will be much less damning.
Finally, as with other analyses of the vote, the preferences of nonvoters are ignored. To the extent that the preferences of nonvoters differ from those of voters, the assessments here will not accurately reflect the views of the entire public. Fortunately, the majority of research on this subject suggests that nonvoters do not have substantially different preferences than voters (Verba, Schlozman, and Brady Reference Verba, Schlozman and Brady1995, Wolfinger and Rosenstone 1980). As Ellcessor and Leighley note in a recent article, “one of the least contested conclusions in the study of political behavior is that voters’ political attitudes and policy positions are fairly representative of non-voters” (2001, 127). Logic and a range of empirical tests also suggest that differences between nonvoters and voters of the same demographic group are likely to be even smaller.Footnote 9 Overall then, the skew created by looking only at voters from each demographic group should be limited. Importantly, we can directly test this assertion by incorporating the preferences of nonvoters in an analysis of winners and losers—a step that I undertake later in the paper.
Given these concerns, a count of winners and losers needs to be read with some caution and should not be the only measure of minority representation used to assess American democracy. Nevertheless, measuring winners and losers does have the potential to provide insight into the well-being of minorities in American democracy.
Data
To assess minority representation and tyranny of the majority, I gathered election results and data on individual voting preferences for a wide number of presidential, congressional, state-level, and local elections in the United States—specifically all elections that are represented in the VNS data series from 1994 to 2006 and all mayoral elections in the past 20 years in large American cities for which there are available exit poll data. The VNS data set includes votes in 3 presidential (1996, 2000, and 2004), 139 gubernatorial, 198 senate, and 919 House contests over that period. The pooled data set includes 298,000 individual votes, a volume of opinions that exceeds most other survey resources.
Each VNS survey contains a fairly representative sample of the nation's voters. The demographic characteristics of the national sample closely match national demographics in terms of race, education, income, gender, partisanship, and political ideology. The average N for each poll is over 13,000 respondents. Each poll also generally includes a large enough sample of African American, Latino, and Asian American voters to allow for analysis of each group.Footnote 10 There are, on average, 1,486 African American, 868 Latino, 214 Asian American, and 10,290 white respondents in each poll.Footnote 11
Another important quality of the VNS exit polls is their accuracy. The VNS estimated Democratic vote share correlates with the actual Democratic vote share at 0.99 in presidential elections, 0.88 in Senate elections, 0.86 in gubernatorial elections, and 0.63 in House elections. In the vast majority of elections, where the VNS polls over 80 respondents, accuracy is even greater. Here the estimated Democratic share correlates with the actual share at 0.99 in presidential elections, 0.91 in Senate elections, 0.88 in gubernatorial elections, and 0.76 in House elections. In these elections, the VNS chooses the correct winner in 94 percent of House contests, 85 percent of Senate elections, and 80 percent of gubernatorial contests.
For the mayoral vote, I collected data on the vote by race/ethnicity for any contested primary or general election that occurred in the nation's 20 largest cities between 1991 and 2002. The data set includes racial voting patterns in 45 elections. Estimates of the vote by race came largely from exit polls or preelection polls (within a week of the contest) but in some cases, I also used ecological inference or homogeneous precinct analysis (see Hajnal and Trounstine Reference Hajnal and Trounstine2005 for more information). Since some of the mayoral data is aggregate rather than individual votes, for all of those elections, I simply calculated the percentage of each racial and ethnic group that wound up losers and averaged that number across the 20 cities to get the figures presented in Tables 2–5.Footnote 12
Who Loses in American Democracy: Race, Demographics, and Political Orientation

aSource: VNS Exit Polls, 1994–2006. bSource: Mayoral Exit Polls in Largest 25 Cities, 1982–2002.
c Voters who choose a losing candidate in presidential, senatorial, and gubernatorial elections.
The Determinants of Losing in American Politics

Logistic Regression. ** p < .01. * p < .05.
Source: VNS Exit Polls, 1994–2006.
Measuring Cohesion within Each Racial and Ethnic Group
aSource: VNS Exit Polls, 1994–2006. bSource: Mayoral Exit Polls in Largest 25 Cities, 1982–2002.
Racial Divisions in American Democracy

aSource: VNS Exit Polls, 1994–2006. bSource: Mayoral Exit Polls in Largest 25 Cities, 1982–2002.
Neither the mayoral data set nor the VNS exit polls cover all possible elections, but together the data sets include a broad enough set of cases that the patterns they expose should not be dismissed as anomalies. To help validate the results, I repeated the analysis with a larger sample of voters available from the 2000 and 2004 NAES data sets. With a larger sample size (almost 60,000 respondents per year), a different sampling method, and a much wider geographic distribution (respondents from over 14,000 different zip codes), the NAES offers a slightly different perspective on these elections. It is, therefore, encouraging to see that the results almost exactly mirror those from the VNS. As well, to see how winners and losers differ in primary elections, I compiled and analyzed voting choices in primaries using the 2000 and 2004 NAES and several additional VNS surveys that focus on the presidential primaries. One important limitation to all of these data sets is their time span. The analysis only offers a window into American democracy in recent years. Whether electoral outcomes in earlier decades differ from what we will see here is an open question.Footnote 13
There is one key dependent variable in this analysis—losing, which is coded as a dummy variable. Any voter that chooses a candidate that lost in a particular electoral contest is coded as a loser (1). Any voter that chooses the winner is counted as a winner (0). The VNS includes a range of questions on key demographic characteristics. Voters are asked about their race (white, black, Hispanic/Latino, Asian American, or other),Footnote 14 whether they view themselves as Hispanic, their partisan identification (Democrat, Republican, or Independent/Something Else), how they view their political ideology (liberal, moderate, or conservative), their total annual family income (divided into eight categories), their sex, their age (divided into eight equal categories), their education (divided into the following five categories: less than a high school degree, a high school degree, some college, a college graduate, postgraduate education), their religious affiliation (Protestant, Catholic, Other Christian, Jewish, Something Else, or None), whether they are gay or lesbian, and their region (North, South, Midwest, Northeast). To control for the fact that there are more winners in elections with a larger margin of victory, I merge in data on the margin of victory in each election. Also, to help ensure that the results are not skewed by high or low turnout, I control for overall turnout in each contest.Footnote 15
RESULTS
Who Wins
In Table 2, I provide the first analysis of the fate of different groups across American elections. The table shows the proportion of voters who end up supporting losing candidates in presidential, Senate, gubernatorial, House, and mayoral elections broken down by a range of core demographic and political characteristics. The last column also shows the proportion of voters from each group that voted for the loser in presidential, senatorial, and gubernatorial elections in a single year—a group that I refer to as “superlosers.”
The analysis offers a range of interesting insights into group outcomes. The first and probably the most obvious conclusion is that no one group is totally shut out from the winning side of electoral democracy. Across all of the demographic and political groups and all of the types of elections, the worst outcome for any single group is to end up on the losing side of the vote 65% of the time. In most cases, the majority of voters from each group end up on the winning side of the vote. America's democracy may be divided, but it is not the case that an overwhelming majority consistently wins out against united minority voting blocs.
This does not mean that all groups win equally often. The top of the table reveals a clear racial hierarchy with whites on the top and African Americans on the bottom. During this period, blacks are the least successful racial, demographic, or political group in American elections. Blacks are the only group that loses more than half the time in most contests. A majority of all black voters ends up on the losing side in presidential (59%), Senate (55%), gubernatorial (52%), and mayoral elections (53%). Aside from Latinos, no other group (racial, political, or demographic) loses more than half the time in more than one type of contest. The one important exception is House elections where some 74% of black voters end up getting their favored candidate into office. I discuss the distinctiveness of House elections in more depth below.
The limited success of African Americans in mayoral elections is especially striking. These elections occur in cities where blacks make up a much larger share of the electorate (27%) than at the national level and where the electorate tends to be significantly more Democratic than the national population (64% of voters in these cities chose John Kerry in 2004). If black voters were going to be on the winning side anywhere, one would expect it to be in these disproportionately black and liberal cities. The fact that the vast majority of these mayoral elections are nonpartisan also suggests that the black defeat in mayoral elections should not be entirely ascribed to a pro-Republican tilt in American politics during this time period.
At the other end of the racial spectrum, white voters stand out for their consistent success. In particular, for four of the five different kinds of contests, white voters are substantially more likely than black and Hispanic voters to end up winners. Whites win half or more of the time in every contest, and in most cases close to 60% of white voters end up winners. This leads to a fairly substantial racial gap. The difference between white and black success is 13 points for the Senate, 13 points for the mayoralty, 12 points in gubernatorial contests, and 9 points in presidential contests.
Latino voters fare almost as poorly as blacks. In three of the five types of contests, a slim majority of Latino voters ends up on the losing side and in two sets of these elections Latinos lose just as often as blacks. Latinos fare substantially better than blacks in only one type of contest. In mayoral elections a slim majority of Latinos ends up winners whereas a slim majority of African American voters ends up losers in these contests. Asian Americans are the most difficult racial group to characterize since they have the most mixed outcomes—sometimes surpassing whites and sometimes losing more than any other racial group.
In some ways, these figures understate the depth of America's racial hierarchy. By looking at each type of election in isolation, they cannot tell us how often individual voters lose across multiple elections. If, however, one looks simultaneously at an individual's vote in three elections (presidential, senatatorial, and gubernatorial) as is done in the last column of Table 2, the consistency with which African Americans lose is even more apparent.Footnote 16 Overall, 41% of all black voters can be characterized as superlosers, meaning that they choose the looser in all three contests. By contrast, only 9% of whites, 4% of Latinos, and 14% of Asian Americans end as superlosers. By this measure, blacks stand out from every other demographic or political group in America. The next least successful voters are liberals and Democrats who are, respectively, superlosers only 20% and 24% of the time. Blacks also stand out in terms of how often they win. The average black voter is a winner only 0.76 times across the three contests. That is far below the figure for whites (1.67 wins on average), the figure for Latinos (1.87 wins), and the figure for Asian Americans (1.14 wins).
The fact that, across this range of different contests, blacks are consistently more likely to end up losers raises concerns about equity in American democracy. This pattern seems to fit classic accounts of minority vote dilution, which is defined as “elections that permit a bloc voting majority, over a substantial period of time, consistently to defeat candidates publicly identified with the interests of and supported by a politically cohesive, geographically insular racial or ethnic minority group” (Davidson and Grofman Reference Davidson and Grofman1994, 231). For the many individual black voters who lose time and time again across the spectrum of American elections, one could reasonably argue that American democracy is not serving their interests.
Importantly, none of the other demographic factors seems to have a consistent impact on winning and losing in American elections. Every demographic group in Table 2 wins more than half of the time in at least three of the four contests. Class, in particular, is not tied to losing. Members of the lower class—as measured by income and education—are no more likely to end up on the losing side of democracy. Similarly, there is no consistent pattern in outcomes for age, gender, religion, urbanicity, or sexual orientation. City residents, for example, may have fared worse than any other group in these presidential contests but they ended up as regular winners in the other three types of contests. Further tests also reveal no connection between region or employment status and electoral victory.
There are, however, some signs of a rightward tilt in outcomes during this time period. In these presidential elections, most liberals (60%) and most Democrats (64%) end up on the losing side of the vote. The partisan or ideological skew is not, however, nearly as consistent as the racial skew. In the other three types of elections for which data are available, most Democrats and liberals end up winners. Moreover, in these Senate, gubernatorial, and House elections, those on the left and those on the right win at about the same rate.
Is it Race?
Findings about the rightward tilt of American democracy raise an important question. Are black voters simply losing because they happen to be liberal and Democratic in a time when conservatives and Republicans are more frequently coming out on top? Or is there something about blacks and their place in American democracy that sets them apart and leads to consistent losing? In other words, does race have anything to do with it?
To isolate the independent effect of race, in Table 3, I examined the probability that each respondent ended up on the winning side of these elections, controlling for a range of individual characteristics. The dependent variable is whether the respondent voted for the losing side (in other words, whether she voted against the majority of all voters in that particular election). For this analysis, I pool the responses of every respondent for all elections of the same type (e.g., all Senate contests in all VNS years). As independent variables, I include dummy variables for each racial and ethnic minority group (black, Latino, Asian American), with non-Hispanic whites forming the residual category. To see if it is really race, I also include controls for political ideology, partisanship, and a range of other measures of socioeconomic status, and region in the logistic regressions.Footnote 17
The results are consistent and clear. Even after controlling for political views and party identification, African American voters are significantly more likely than whites to end up on the losing side of democracy for every type of election.Footnote 18 Moreover, the gaps are reasonably large. Since it is difficult to interpret the magnitude of these effects from the logit coefficients, I converted the coefficients into probabilities that members of each group will wind up on the losing side of the vote (King, Tomz, and Wittenberg Reference King, Tomz and Wittenberg2000). In each case I hold all of the other variables constant at values for a hypothetical median voter. These calculations indicate that blacks are 11% more likely than whites to end up losers in Senate contests, 6% more likely to do so in gubernatorial elections, 5% more likely to lose in House contests, and 4% more likely to lose in presidential elections.Footnote 19 This doesn't mean that all blacks lose. But many do.Footnote 20
No other political or demographic group ends up consistently as losers across the four types of elections. In terms of race and ethnicity, the results for Asian Americans and Latinos are quite mixed. In two cases (Senate and House elections), Latinos are substantially more likely than whites to end up losers (2% and 13% more likely, respectively) but in one other case (gubernatorial elections) they are less likely to end up losers (4%), and in one other case they are about as likely as whites to be on the winning side. Asian American outcomes are similarly mixed.
Importantly, during a time period when Republican officeholders did well, party and ideology do not play a clear role in this analysis. Democrats are more likely than Republicans to end up on the losing side of presidential democracy. But the effects are not particularly large (3% more likely to lose). And in one case (House elections) Democrats fare marginally better than Republicans (6% less likely to lose), all else equal. In addition, in the other two types of elections, Democrats are no more or less likely to lose than Republicans. Similarly, liberals are disproportionate losers in one case (presidential elections), disproportionate winners in another case (House elections), and on par with conservatives in the other two types of contests. The effects for income and other socioeconomic characteristics are also decidedly mixed. It is African Americans and only African Americans who always end up losing disproportionately.
Another way to assess whether race is the central factor driving outcomes is to look at different subtypes of voters. Are outcomes for lower-class whites, for example, different from outcomes for middle class whites? And more generally, is there a “type” of white voter that loses as consistently as black voters? To answer this question, I examined outcomes for a wide range of groups of white voters that combined different characteristics of education, income, religion, and political orientation. Although there were marginal differences and some groups such as white liberals were somewhat less successful than the median white voter, no combination of characteristics led to losing on par with black voters.Footnote 21
These results raise even more questions about the representation of African Americans in American democracy. Does a group that consistently loses more regularly than all other groups have enough of a say in the political arena to be consider well represented? Ultimately, these kinds of questions are normative ones that require subjective answers. But the fact that blacks are substantially more likely than whites and other racial ethnic groups to be outvoted in American democracy across a wide spectrum of elections suggests that there may be a problem.
Validating a Count of Winners and Losers
Selective Turnout. One concern with counting votes is that selective turnout could skew an analysis of winners and losers.Footnote 22 The regressions in Table 3 do control for overall voter turnout in each election but they do not control for selective turnout by different groups. It might be that members of a group who feel alienated from the menu of candidates or who feel that their favored candidate has little chance of winning might choose not to vote at all.Footnote 23 If true, a count of winners and losers could overstate the representation of a group.
Additional analysis indicates, however, that selective turnout has at best a marginal effect in these elections. First, supplementary tests show that each racial and ethnic group's turnout is unrelated to its success rate. Specifically, after acquiring the turnout rate by race for each general election from the CPS, I found that each group is not significantly more (or less) successful when its turnout is low than when its turnout is high. I arrive at similarly insignificant results if I look at relative turnout rates (e.g., black turnout minus white turnout in a given election).
Another way to demonstrate that strategic nonvoting has little effect on the relative success of different groups is to directly compare changes in turnout across groups and elections. For turnout to affect the relative success of a group, members of that group must be more strategic than another group in their decision to turn out. The data, however, reveal no such pattern. Black, white, and Latino turnout does vary from year to year but all three racial groups follow an almost identical pattern. When one group turns out more in one year, the other groups also turn out more.Footnote 24 Across the years in the data set, black, white, and Latino turnout rates are correlated at a minimum of 0.95. There is, in short, little evidence of selective turnout by race in these elections. Importantly, the structure of American elections limits the likely impact of strategic nonvoting. Since the electorate votes on multiple offices simultaneously, there is less room for strategic nonvoting in one contest. If you turn out for one contest (e.g., the president), you generally vote in the other contests (e.g., Congress)—whether the outcome in the second contest is likely to be in your favor or not.
A third way to show that strategic turnout is not widespread is to compare the candidate preferences of voters and nonvoters across a variety of different contexts. As I noted earlier, there is ample evidence from a range of different elections and cases indicating that the preferences of nonvoters are similar to the preferences of voters (Bennett and Resnick Reference Bennett and Resnick1990; Ellcessor and Leighley Reference Ellcessor, Leighley and Menifield2001; Highton and Wolfinger Reference Highton and Wolfinger2001; Norrander Reference Norrander1989). This is even true if we compare voters and nonvoters from the same racial or ethnic group (Hajnal and Trounstine Reference Hajnal and Trounstine2005). To supplement this literature, I turned to two alternative data sets, the NAES, which has data on the choices of voters and the preferences of nonvoters in general and primary elections for president in 2000 and 2004, and the General Social Survey, which has data on presidential preferences among voters and nonvoters from 1968 to 2000. In this limited set of elections, there are few substantial differences between the preferences of voters and nonvoters in either data set. Nonvoters would have chosen the same winners in roughly the same proportions. Moreover, differences between voters and nonvoters within the same racial group (or demographic or political group) tended to be even smaller and were generally insignificant.Footnote 25 Including the preferences of nonvoters would likely alter a count of winners and losers on the margins, but the overall conclusions would be nearly identical.
Primary Elections. Another concern is that almost all of the results to this point focus on general elections while ignoring primary election outcomes. Although there is a logic to focusing on general elections—winning a primary matters little if you ultimately lose in the general election—primary elections can also affect the kind of representation minorities have. Groups that are consistent losers in primary elections are less likely to have a meaningful choice in general elections and may be forced to choose the lesser of two evils.
Analysis of primaries at the mayoral and presidential levels reveals a mixed picture. The same racial hierarchy that we saw in general elections also emerges in mayoral primaries. African American voters in the typical Democratic primary in the mayoral data set lose 48% of the time compared to 37%, 41%, and 38% of the time for whites, Latinos, and Asian Americans, respectively.Footnote 26 At least at the mayoral level, African Americans are failing disproportionately at both stages of the electoral process. They are, in essence, doubly disadvantaged. The pattern in presidential elections is, however, very different. Here, African Americans—and other minorities—are particularly apt to end up winners in the primary.Footnote 27 The limited available data suggest that blacks are marginally more successful than whites—winning 43% of the time versus 40% of the time for whites.Footnote 28 Latinos (48% winners) and Asian Americans (42% winners) also fare better than white voters at this stage. This pattern suggests that African Americans (and other minorities) will often have a favored candidate in the general election. The problem for African Americans and to a lesser extent for Latinos is that even when they have a meaningful choice in the general election, at the end of the day they still regularly wind up losers. Much more work needs to be done across a broader array of primary contests before we can offer anything close to an overarching assessment of primaries in American democracy, but none of these limited primary results would lead one to dismiss the concerns that emerge out of the general election analysis.Footnote 29
Comparing Different Measures of Representation. Another very different way to assess this new measure of representation is to compare its results with assessments of minority representation based on existing measures. If we look first at descriptive representation and compare outcomes for several key demographic groups, it is apparent that a count of winners and losers is correlated with but distinct from a count of descriptive representation.
For African Americans, the parallels between the two measures are striking. Blacks fare poorly on both measures for all offices except the House of Representatives. In terms of descriptive representation, black elected officials account for only 2% of the nation's governors, 1% of its senators, and 2% of its mayors, but almost 10% of House seats (Hajnal Reference Hajnal2007; JCPS 2003; MacManus and Bullock Reference MacManus and Bullock1993). Similarly, most black voters lose in contests for governor, senator, and mayor, but the vast majority (71%) end up winners in House elections. The one difference between the two measures is that a count of black elected officials suggests that when blacks are underrepresented, they are grossly underrepresented whereas a count of winners and losers suggests that blacks are not that severely undercut by democratic elections. The reason for the difference in this case is simple. A count of winners views blacks who vote for successful white candidates as winners. By contrast, descriptive representation views these same black voters as being unrepresented. Since the bulk of the black population lives in majority-white states and districts and votes in elections without black candidates, descriptive representation is dismissing most of the voting done by African Americans as meaningless. As such, it may be ignoring most of the influence that African American voters have in elections across the country.
The case of gender provides a sharper contrast between the same two measures. In a count of winners and losers, women fare only marginally worse than men. By contrast, a count of descriptive representation indicates that women are greatly underrepresented in all of these offices.Footnote 30 Again, it is not clear which measure provides the more telling account, but the contrast does highlight the fact that the two measures are likely to diverge when the group in question does not vote cohesively. Female voters don't lose in overwhelming numbers in a count of winners and losers because they seldom vote in overwhelming numbers for one candidate over another.
A comparison of a count of winners and substantive representation is more difficult because we have few overall measures of substantive representation for a group in any given democracy. We know that black constituents do have influence on the voting patterns of their legislators (Griffin and Newman Reference Griffin and Newman2007; Whitby Reference Whitby1997), there is evidence that expanded black voting has altered policy outcomes in a given state (Keech Reference Keech1968; Parker Reference Parker1990), and there are studies that link the election of black elected officials with a host of symbolic and concrete effects (Browning, Marshall, and Tabb Reference Browning, Marshall and Tabb1984; Karnig and Welch Reference Karnig and Welch1980). But it is extremely difficult to say whether African Americans are, as a whole, being well represented in American democracy from studies that focus on the actions of a few leaders across a small number of policy arenas.Footnote 31 Scholars do offer broader assessments of black substantive representation but because of the imprecise way in which both black opinions and policy outcomes are measured, the accounts differ wildly. Thus, while one set of scholars can claim that both of the nation's major political parties ignore the interests of black voters when deciding policy (Frymer Reference Frymer1999; Walters Reference Walters1988), others can claim not only that blacks are often well represented but also that electoral rules give African Americans special advantages (Swain Reference Swain1995; Thernstrom Reference Thernstrom1987; Thernstrom and Thernstrom Reference Thernstrom and Thernstrom1997).Footnote 32
A sharper distinction between substantive representation and a count of winners and losers might be made in the case of gay and lesbian representation. By a count of winners, gays and lesbians fare reasonably well, winning between 52% and 57% of the time in the elections in this study. But it would be hard to maintain that policy outcomes in America favor gay and lesbian interests on the most important issues facing the two groups. Fundamental rights such as the right to marry are often not recognized in American democracy. The insight here might be that it is important to assess winners and losers in elections that are of particular importance to the group in question. For gay and lesbian voters, we might want to focus on statewide propositions concerning gay rights.
It is also informative to compare all three measures in other historical periods and across different geographic contexts. A focus on the representation of blacks in the South after the Great Depression would likely conclude that blacks fared extremely poorly in terms of substantive representation (blacks were barred from white schools and many jobs and had little access to the vote) and descriptive representation (black officeholding was negligible), but well in a count of winners and losers since the few black voters that did make it to the polls often won (blacks were starting to vote Democratic in an era of Democratic domination). Roughly the same contrast might emerge if we shifted the focus to the Apartheid era in South Africa. These historical and geographic comparisons suggest that a count of winners and losers is only appropriate if the group in question has broad access to the vote.
These few paragraphs offer a far from systematic and exhaustive comparison of how these measures fare in different circumstances, but they do help to recognize some of the qualities and limitations of counting winners. In terms of limitations, these comparisons suggest that a count of winners should be limited to cases where there is equal access to political participation and should focus on elections that are important to the group in question. At the same time these comparisons also help to establish the validity of counting winners by demonstrating some level of correlation with existing measures. They also suggest that a count of winners can incorporate different kinds of minority influence that other measures fail to capture. Based on these insights, it is clear that we should not perceive a count of winners and losers as anything close to a perfect measure of representation. Instead, we should view a count of winners as a valuable new tool that compliments rather than replaces existing measures of representation. What that tool is telling us is that even today, African Americans appear to be less well represented in American democracy than most other groups.
Why Do Blacks Lose?
The disproportionate failure of African American voters in American democracy leads to an important question. Why are black voters losing more regularly than other voters? One part of the answer is surely institutional. By all accounts, the fact that almost all American elections are winner-take-all likely diminishes black influence (Davidson and Grofman Reference Davidson and Grofman1994; Guinier Reference Guinier1994). Comparative studies suggest that countries such as the United States that have majoritarian systems tend to have fewer minorities in office and more limited spending on minority-friendly policies than countries with proportional representation (Lijphart 1994; Taagepara and Shugart Reference Taagepara and Shugart1989). Within the American context, analysis of the few elections that are held with alternative voting methods suggest that minority descriptive representation is greatly enhanced under many of these alternative electoral systems (Bowler, Donovan, and Brockington Reference Bowler, Donovan and Brockington2003). There are also a number of more specific local electoral institutions that have been linked in recent decades to reduced black representation. In particular, black representation continues to be impaired by at-large elections (Welch Reference Welch1990), off-cycle local elections (Hajnal and Trounstine Reference Hajnal and Trounstine2005), reduced council size (Bullock and MacManus Reference Bullock and MacManus1987), and other electoral barriers. If we are concerned about the underrepresentation of black voters, reform to each of these institutional arrangements should be considered.
Another factor that, at least intuitively, could do even more to explain the defeat of black voters is a pattern of racial bloc voting.Footnote 33 The potential relevance of bloc voting for any minority group is obvious. No minority can overcome the will of a united and active majority in a democracy. But do blacks really lose out because of bloc voting? If bloc voting is to blame, we would see three underlying patterns. First, the minority group must, to a certain extent, vote as a unified block. If members of a minority group do not agree on what policies should be passed or who should be elected, then large numbers of that group will necessarily end up on both the winning and the losing side. Second, the majority group—or white voters in this case—must be cohesive. If the white majority is fairly evenly divided, then nonwhite minorities will be able to influence the outcome of many elections. There can be no tyranny of the majority without a clear majority preference. Finally, the preferences of the minority and majority groups must diverge. The interests of white and nonwhite voters must be opposed. If most voters agree on which candidates should be elected, regardless of their race or ethnicity, then clearly there is no tyranny of the white majority.
In the next two tables, I examine the vote by race and ethnicity across elections in American democracy to see how well these conditions are met. The results suggest that the American electorate is divided by race and that blacks are uniquely disadvantaged by these bloc voting patterns.
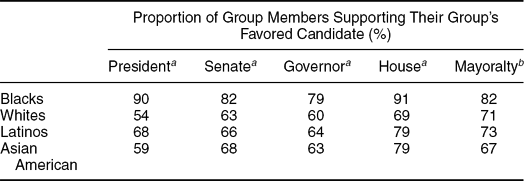
Cohesion. The figures in Table 4 indicate the degree to which each racial and ethnic community votes as a bloc. To measure the cohesiveness of a group, I measured the proportion of the voters from each racial group that supported their group's most favored candidate. If a group was wholly united and all voted for one candidate, the measure would equal 100. A totally divided community that evenly split their vote between two candidates would score 50. All of the elections for a given office are averaged together.
The first conclusion to emerge from this analysis is that African Americans do tend to vote as a bloc—very much raising the possibility of tyranny of the majority. In a typical electoral contest, the vast majority of black voters end up on the same side. Despite arguments about the declining significance of race in American politics and life and growing class divisions within the black community, electoral politics still appears to bring blacks together. In presidential contests, for example, 90% of all black voters support the same candidate in the typical contest. Black cohesion is as high or almost as high in senate, gubernatorial, and House elections. Black unity in mayoral contests suggests that this black cohesion is not just a function of partisan labels or partisanship. In the mayoral contests, the vast majority of which are nonpartisan, blacks are still exceptionally cohesive. On average, 82% of black voters support the group's favored mayoral candidate. In short, it is generally clear who the “black” candidate is, and the vast majority of the community supports that candidate.
Unfortunately for African American voters, white voters are also somewhat cohesive. Although white cohesion does not come close to matching black cohesion, in all but one set of elections at least 60% of whites voted together. In mayoral elections, the figure rises to 71% cohesion. Only in presidential contests where 54% of white voters favor their group's preferred candidate are whites close to evenly divided. These patterns suggest that if blacks favor candidates that the white majority opposes, they are likely to lose heavily in most contests.
Another interesting conclusion that emerges out of Table 4 is that it is possible to talk about Asian American and Latino voting blocs. Even Asian Americans, generally the least cohesive group, vote together much more than chance would suggest. In the typical senatorial contest, for example, 68% of Asian Americans voted together. In other contests, Asian American cohesion ranges from 59% to 79%. Latinos are slightly more apt to vote together. Across the five types of elections, between 64% and 79% of Latino voters supported the same side on average. This suggests that the Asian American and Latino communities are often able to at least partially overcome differences of national origin group, immigration status, and socioeconomic status. We still cannot think of Asian Americans and Latinos as monolithic voting blocs, but we should probably consider them as more of a voting bloc than some recent accounts suggest.
Division. It is also clear that American elections generate considerable racial and ethnic division. Table 5 presents figures for the average divide between each set of racial and ethnic groups across the different types of contests. The table shows the average difference in the percentage favoring the winning candidate. As Table 5 illustrates, American democracy often pits racial and ethnic groups against each other. Across the entire set of elections, the smallest average divide is 10 percentage points between whites and Asian Americans in presidential contests. The typical racial divide is over a 20-percentage-point gap. Racial and ethnic communities are not only voting cohesively, they are also voting against each other.
The more important story revealed by Table 5—at least in terms of understanding the poor outcomes for black voters in American democracy—is the especially sharp divide between black and white voters. On average, the black vote for the winner differs from the white vote by between 34 and 50 percentage points. With few exceptions, the black community and the white community are not supporting the same candidates. This clearly explains why African Americans are ending up more regularly than other groups on the losing side of democracy. Voting cohesively and voting against the white majority seal the fate of the black community in American democracy.
A more detailed look at Table 5 suggests that African American voters do not just disagree with white voters over whom to elect, they also often differ from Latino and Asian American voters. The racial gaps here are much smaller, but the black-Latino divide is still 20 points or higher for every case but House elections. In the mayoralty where partisanship is much less of a factor, the black-Latino divide grows to 43 points. Similarly, the black-Asian American divide averages between 18 and 33 percentage points. If the black community was hoping to form a coalition with other racial and ethnic minorities, their hopes have clearly not been fulfilled. In short, African American voters are finding themselves somewhat isolated in the American political arena. We can now more fully understand the electoral losses that black voters are incurring.Footnote 34
The flip side of the distinctiveness of the black vote is the possibility for coalition building among the other three racial and ethnic groups. Judging by the vote across this wide range of elections, whites, Latinos, and Asian Americans appear to be the three groups most likely to form a viable rainbow coalition. The divides between the three groups are, relatively speaking, small. Across most of the different types of contests, the Latino-Asian American divide was either the smallest intergroup divide or close to it. But whites and Asian Americans appeared to coalesce almost as often. In mayoral elections, for example, the white-Asian American divide averaged only 13 points. To a certain extent, American democracy is pitting African American voters against voters from the three other racial or ethnic groups.
When Do Blacks Lose?
The results so far are somewhat discouraging for those interested in the representation of African Americans. These results to this point do, however, only provide a general overview of black success rates. These aggregate patterns hide considerable variation across time and context. If we can garner a better understanding of where and when black voters are successful, we may be able to identify reforms that could lead to greater balance in American democracy.
One of the starkest differences in outcomes for blacks is one that we have already seen—greater success in House elections. These House elections are, of course, the only elections in which electoral boundaries are regularly manipulated. The fact that blacks (and Latinos) appear to be doing much better in the one area of democracy where the drawing of district lines affects outcomes reinforces the view that gerrymandering can strongly benefit minority voters. Importantly, the success of black voters in House elections points not only to black success in majority-black districts but also to black success in majority-white places. Since around 70% of black voters in House elections live in majority-white districts, the present results imply that even in predominantly white districts outcomes regularly favor black voters. One likely explanation is that black voters are being grouped with liberal or Democratic white voters who help elect minority-favored candidates. The larger implication is that minority interests may be more fully incorporated in democracy if district lines can be drawn so that minority voters are paired with other minority voters or like-minded members of the majority group.
There are also important variations in black success across time and context. In Table 6, I attempt to show how different contexts affect the success of black voters in senatorial and gubernatorial elections—two of the cases where blacks fare the worst.Footnote 35 Each of the two regressions examines the role of a series of state-level factors that have in the past been linked to black representation (Huckfeldt and Kohfeld Reference Huckfeldt and Kohfeld1989; Key Reference Key1949; Manza Reference Manza2006).Footnote 36 In particular, I assess the role of state politics and partisanship (percent Democrats, percent Republicans, and mean citizen ideology), key state demographics (percent black, percent black squared, and percent with only a high school degree), and measures of institutional barriers to voting (whether a state is under the jurisdiction of Section 5 of the Voting Rights Act, level of felon disenfranchisement, how long before the election voters must register, and eligible voter turnout).Footnote 37 To gauge how electoral outcomes vary for blacks over time, I also include the year of the election.Footnote 38 Finally, to determine if black failure is restricted to certain types of black voters, I incorporate typical measures of individual socioeconomic status and individual political orientation. The dependent variable is the same—whether the respondent ended up on the losing side of the election. All predicted probabilities below vary the variables of interest from the 10th to the 90th percentile.
Where and When Do Black Voters Lose?

Logistic Regression. ** p < .01. * p < .05.
Source: VNS Exit Polls, 1994–2006.
The results tell a largely familiar story. Black voters are more successful when they live in states that are more Democratic, more liberal, and less Republican. The effects are dramatic. All else equal, black voters in more liberal, Democratic states are 74% less likely to lose in Senate elections (38% more likely to lose in gubernatorial contests) than black voters in more conservative, Republican states. Black success in American democracy rests substantially on the willingness of their neighbors to support a liberal, Democratic agenda.
Also as expected, the size of the black population matters. The relationship is, however, a complex one as the significant and oppositely signed coefficients on percent black and percent black squared. Mirroring other studies of black-white relations, there is an inverse U-shaped relationship between the proportion of the state's population that is black and electoral outcomes (Blalock Reference Blalock1967). Black voters in Senate elections are quite successful when the black population is small (only 44% lose in states that are 7% black) but as the black population grows, white resistance to black interests grows. Black failure peaks in about the median state (15% black) where the likelihood of losing grows to 65%. Then as blacks become a more numerous and decisive voting bloc, the likelihood of ending up on the losing side of the vote declines to 58% (in states with a 29% black population). In gubernatorial elections, the benefits of living in a state with a large black population are even more pronounced. The likelihood of losing drops from 58% in the median state to 32% in states with a large black population. It is not just the racial makeup of the population that matters. In line with research showing that less-educated Americans are more intolerant and less prone to support pro-black policy, the analysis here indicates that black voters in Senate elections are 8% more likely to end up winners in more educated states (Schuman et al. Reference Schuman, Steeh, Bobo and Krysan1997).
The last critical factor for black voters is whether they reside in a state that is covered under Section 5 of the Voting Rights Act (Black and Black Reference Black and Black1987; Menifield Reference Menifield2001).Footnote 39 States with a history of disenfranchising African Americans continue to have reduced black representation today. Even after controlling for the partisan leanings, the racial makeup, and the educational attainment of a state's population, blacks in these Voting Rights Act states are 15% more likely to be defeated in Senate elections. In gubernatorial elections, the VRA gap grows to 26%.
Unfortunately, for activists interested in reform, identifiable institutional levers appear to be much less consequential for African American representation.Footnote 40 Contrary to concerns about the anti-black implications of harsh felon disenfranchisement laws (Manza Reference Manza2006), these laws have no consistent effects on black outcomes. The effect of registration deadlines on outcomes for blacks is also mixed. Alternative tests further indicate that a range of reforms that attempt to make voting easier and more open (e.g., allowing early voting, mailing sample ballot, and voting by mail) have no clear effect on black representation. This parallels results that demonstrate that these reforms have at best a marginal impact on turnout (Blais Reference Blais2006; Gronke, Galanes-Rosenbaum, and Miller Reference Gronke, Galanes-Rosenbaum and Miller2007). It may be, as some have argued, that reforms in recent decades have so reduced the ability of states to set their own registration procedures and alter their electoral institutions that state laws today are of little consequence to democratic outcomes (Highton Reference Highton2004a).
CONCLUSION
The results presented here reveal a mixed story about recent outcomes in American democracy. On one hand, a count of winners and losers suggests that most racial, demographic, and political groups win more often than they lose in most types of electoral contests. Even in the worst case, it is clear that a completely cohesive majority is not winning out over the objections of united minorities.
On the other hand, there are groups that end up as winners more regularly and groups that end up as losers more regularly and these differences seem more than anything else to be related to race. White voters, as one would expect, are in many ways the most privileged voters in American democracy. When election results have been posted, their preferences are much more likely to triumph than to be defeated. African American voters stand at the other end of the spectrum. The black community is, in fact, the only community that was consistently more likely to end up on the losing side of democracy. The fact that African American interests are regularly rejected in the broad array of electoral contests in American democracy raises serious concerns about the health of that democracy and the degree to which it truly incorporates minority interests. If we were not concerned about black interests in American democracy before, we probably should be now.
Exactly how we respond to this new information is more difficult to say. Some of the analysis here points to the benefits of district gerrymandering and the importance of placing minority voters with like-minded white voters. Other comparative work has highlighted the negative implications of majoritarian systems for minority interests (Taagepara and Shugart Reference Taagepara and Shugart1989). In the American context, advocates of proportional representation, cumulative voting and a number of other alternatives have also offered compelling theoretical motivations for change and even some empirical evidence of the merits of these alternative institutions (Bowler, Donovan, and Brockington Reference Bowler, Donovan and Brockington2003; Guinier Reference Guinier1994). But before serious efforts at reform commence, we will need to do more to understand variations in minority representation across different contexts. Before acting, it is also important to see how the patterns presented here differ for earlier time periods.
The other main contribution of this article is to illustrate the potential of counting winners and losers in American democracy. Given the hyperbole surrounding discussions of minority rights and the limited ability of researchers to come up with a comprehensive assessment of minority influence, this new measure can provide an informative new statement about where minorities stand in American democracy. Given the intuitive logic of counting winners and losers, the close correlation between losing and core legal concepts like minority vote dilution, and the ability to use this new measure to assess almost the entire array of elections in American democracy, it should be seen as an important additional tool in the arsenal of scholars who are interested minority representation. A count of winners and losers is neither perfectly accurate nor definitive but if we consider outcomes across a broad set of elections, a count of winners and losers should provide real insight into the democratic fortunes of different groups. Losing in a single election is by no means a clear sign of democratic exclusion but losing consistently across a wide range of elections—as blacks have done in recent years—is surely going to diminish one's voice in democracy and could, if not addressed, lead to disillusionment with the democratic process.Footnote 41
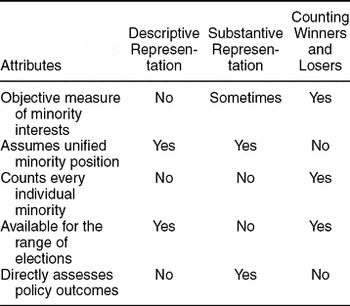
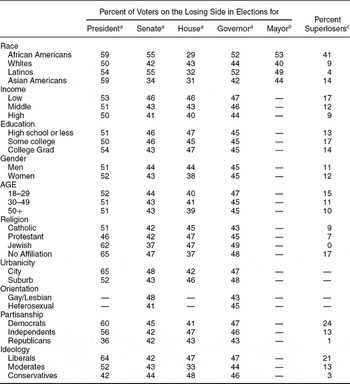
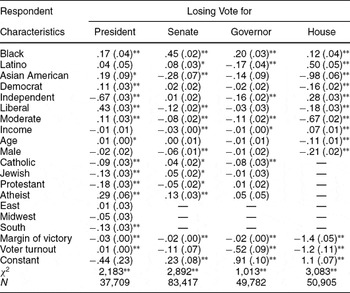
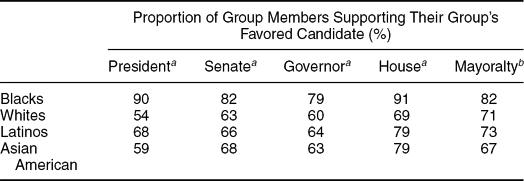
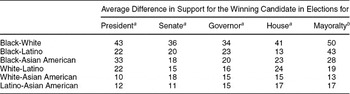
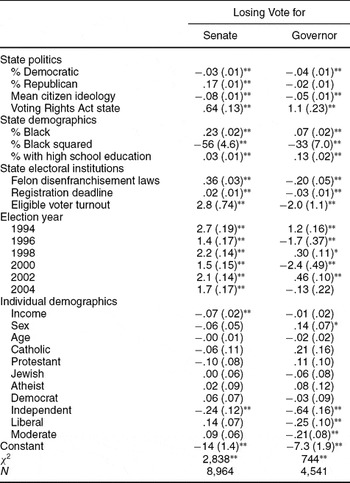



Comments
No Comments have been published for this article.