1 Introduction
An evaporating drop of a multicomponent liquid has attracted considerable attention not only because of its use in a wide range of applications, e.g. ink-jet and printing technologies (Park & Moon Reference Park and Moon2006; Mishra et al. Reference Mishra, Barton, Alleyne, Ferreira and Rogers2010; Kong et al. Reference Kong, Tamargo, Kim, Johnson, Gupta, Koh, Chin, Steingart, Rand and McAlpine2014; Kuang, Wang & Song Reference Kuang, Wang and Song2014; Talbot et al. Reference Talbot, Yow, Yang, Berson, Biggs and Bain2015), but also because it poses challenging transport questions in fluid mechanics. For instance, when a whisky droplet evaporates, it leaves a distinct, nearly uniform deposit (Kim et al. Reference Kim, Boulogne, Um, Jacobi, Button and Stone2016), which is significantly different from the well-known coffee-ring pattern (Deegan et al. Reference Deegan, Bakajin, Dupont, Huber, Nagel and Witten1997). During the evaporation of a whisky droplet, we observe self-triggered complex vortices driven by solutal Marangoni effects, which are likely created by the local concentration variations between ethanol and water that are generated by selective evaporation of the more volatile component (Bennacer & Sefiane Reference Bennacer and Sefiane2014; Kim et al. Reference Kim, Boulogne, Um, Jacobi, Button and Stone2016). An even more complex case of multicomponent liquid droplets, such as ‘Ouzo’, which contains ethanol, water and oils, has also been studied. When this mixture evaporates, there is a phase transition because of the different volatilities and limited miscibility of the components (Tan et al. Reference Tan, Diddens, Lv, Kuerten, Zhang and Lohse2016). In addition, there are recent experimental and numerical studies to investigate internal flow structures in an evaporating droplet containing a binary mixture (Diddens et al. Reference Diddens, Kuerten, van der Geld and Wijshoff2017a ; Karpitschka, Liebig & Riegler Reference Karpitschka, Liebig and Riegler2017; Sáenz et al. Reference Sáenz, Wray, Che, Matar, Valluri, Kim and Sefiane2017). However, the distribution of liquid components in a binary mixture droplet during evaporation is not known. In this paper, we will show how the relative mixture ratio between two liquid components having different volatilities evolves in time and space, however, for conditions that are diffusion dominated and in which Marangoni effects are small.
It is well known that when a single-component liquid droplet of radius
 $R$
, e.g. a water droplet, on a solid substrate evaporates with a contact angle
 $\unicode[STIX]{x1D703}<\unicode[STIX]{x03C0}/2$
, the evaporative flux is non-uniform along the radial direction, i.e. near
 $r\approx R$
, the diffusively dominated flux
 $J(r)\propto (R-r)^{(-\unicode[STIX]{x03C0}-2\unicode[STIX]{x1D703})/(2\unicode[STIX]{x03C0}-2\unicode[STIX]{x1D703})}$
(Deegan et al.
Reference Deegan, Bakajin, Dupont, Huber, Nagel and Witten1997). If several liquid components are pre-mixed, it is expected that each liquid component evaporates independently. For example, for a multicomponent liquid droplet, selective evaporation is one of the key features that suppresses the coffee-ring pattern. Specifically, if a droplet containing a mixture of ethanol and water is placed on a solid substrate, the local mass fraction of ethanol near the contact line is lower than that in the middle of the droplet due to the non-uniform evaporation profile. Thus, for a nearly isothermal system, the effective interfacial tension near the contact line is higher than the interfacial tension at the apex of the droplet because the surface tension of ethanol is lower than that of water, so that there is an outward radial flow along the air–liquid interface and an inward radial flow along the substrate (Bennacer & Sefiane Reference Bennacer and Sefiane2014; Kim et al.
Reference Kim, Boulogne, Um, Jacobi, Button and Stone2016; Tan et al.
Reference Tan, Diddens, Lv, Kuerten, Zhang and Lohse2016). Recently, Diddens et al. (Reference Diddens, Tan, Lv, Versluis, Kuerten, Zhang and Lohse2017b
) performed three-dimensional numerical computations to investigate the evaporation of a binary or ternary-component droplet, which showed the internal flow and relative concentration ratio in the droplet.
On the other hand, there is as yet no direct experimental measurement of the selective evaporation because of the difficulty of visualization of the mass distribution or volume fraction in a droplet containing multiple chemical species. In order to properly design a multicomponent mixture for applications, e.g. biochemical applications (Dugas, Broutin & Souteyrand Reference Dugas, Broutin and Souteyrand2005; Brutin et al. Reference Brutin, Sobac, Loquet and Sampol2011; Bahmani, Neysari & Maleki Reference Bahmani, Neysari and Maleki2017), controlled deposition of various materials for applications in the food and cosmetic industries, ink-jet printing of light-emitting diodes (LED) (de Gans, Duineveld & Schubert Reference de Gans, Duineveld and Schubert2004; Kong et al. Reference Kong, Tamargo, Kim, Johnson, Gupta, Koh, Chin, Steingart, Rand and McAlpine2014), organic LED devices and electronics (Sirringhaus et al. Reference Sirringhaus, Kawase, Friend, Shimoda, Inbasekaran, Wu and Woo2000; Paul et al. Reference Paul, Wong, Ready and Street2003), it is important to understand mass (or volume) fraction changes in a liquid mixture as evaporation occurs. Modelling is, of course useful, but inevitably involves assumptions, so a direct experimental approach can provide insights, which we achieve here.
Direct optical measurement techniques have been developed extensively: (i) measurement of molecular structures by electrometry (Ruggeri et al. Reference Ruggeri, Zosel, Mutter, Różycka, Wojtas, Ożyhar, Schuler and Krishnan2017), diffraction measurement methods (Dixit et al. Reference Dixit, Crain, Poon, Finney and Soper2002) and X-ray emission spectroscopy (Guo et al. Reference Guo, Luo, Augustsson, Kashtanov, Rubensson, Shuh, Ågren and Nordgren2003); (ii) measurement of flow fields by particle image velocimetry (PIV), particularly tomographic PIV to determine the full three-dimensional, three components of the velocity vectors of turbulent (Jodai & Elsinga Reference Jodai and Elsinga2016) and micro flows (Kim et al. Reference Kim, Große, Elsinga and Westerweel2011); and (iii) direct visualization in the cross-sectional area of non-transparent objects by transmission X-ray microscopy (Park et al. Reference Park, Weon, Lee, Lee, Kim and Je2014). However, it is very challenging to measure small-scale features in a relatively large system – such as the chemical distribution of molecules in a millimetre-sized droplet – while simultaneously investigating the global drying mechanisms of the binary mixture droplet.
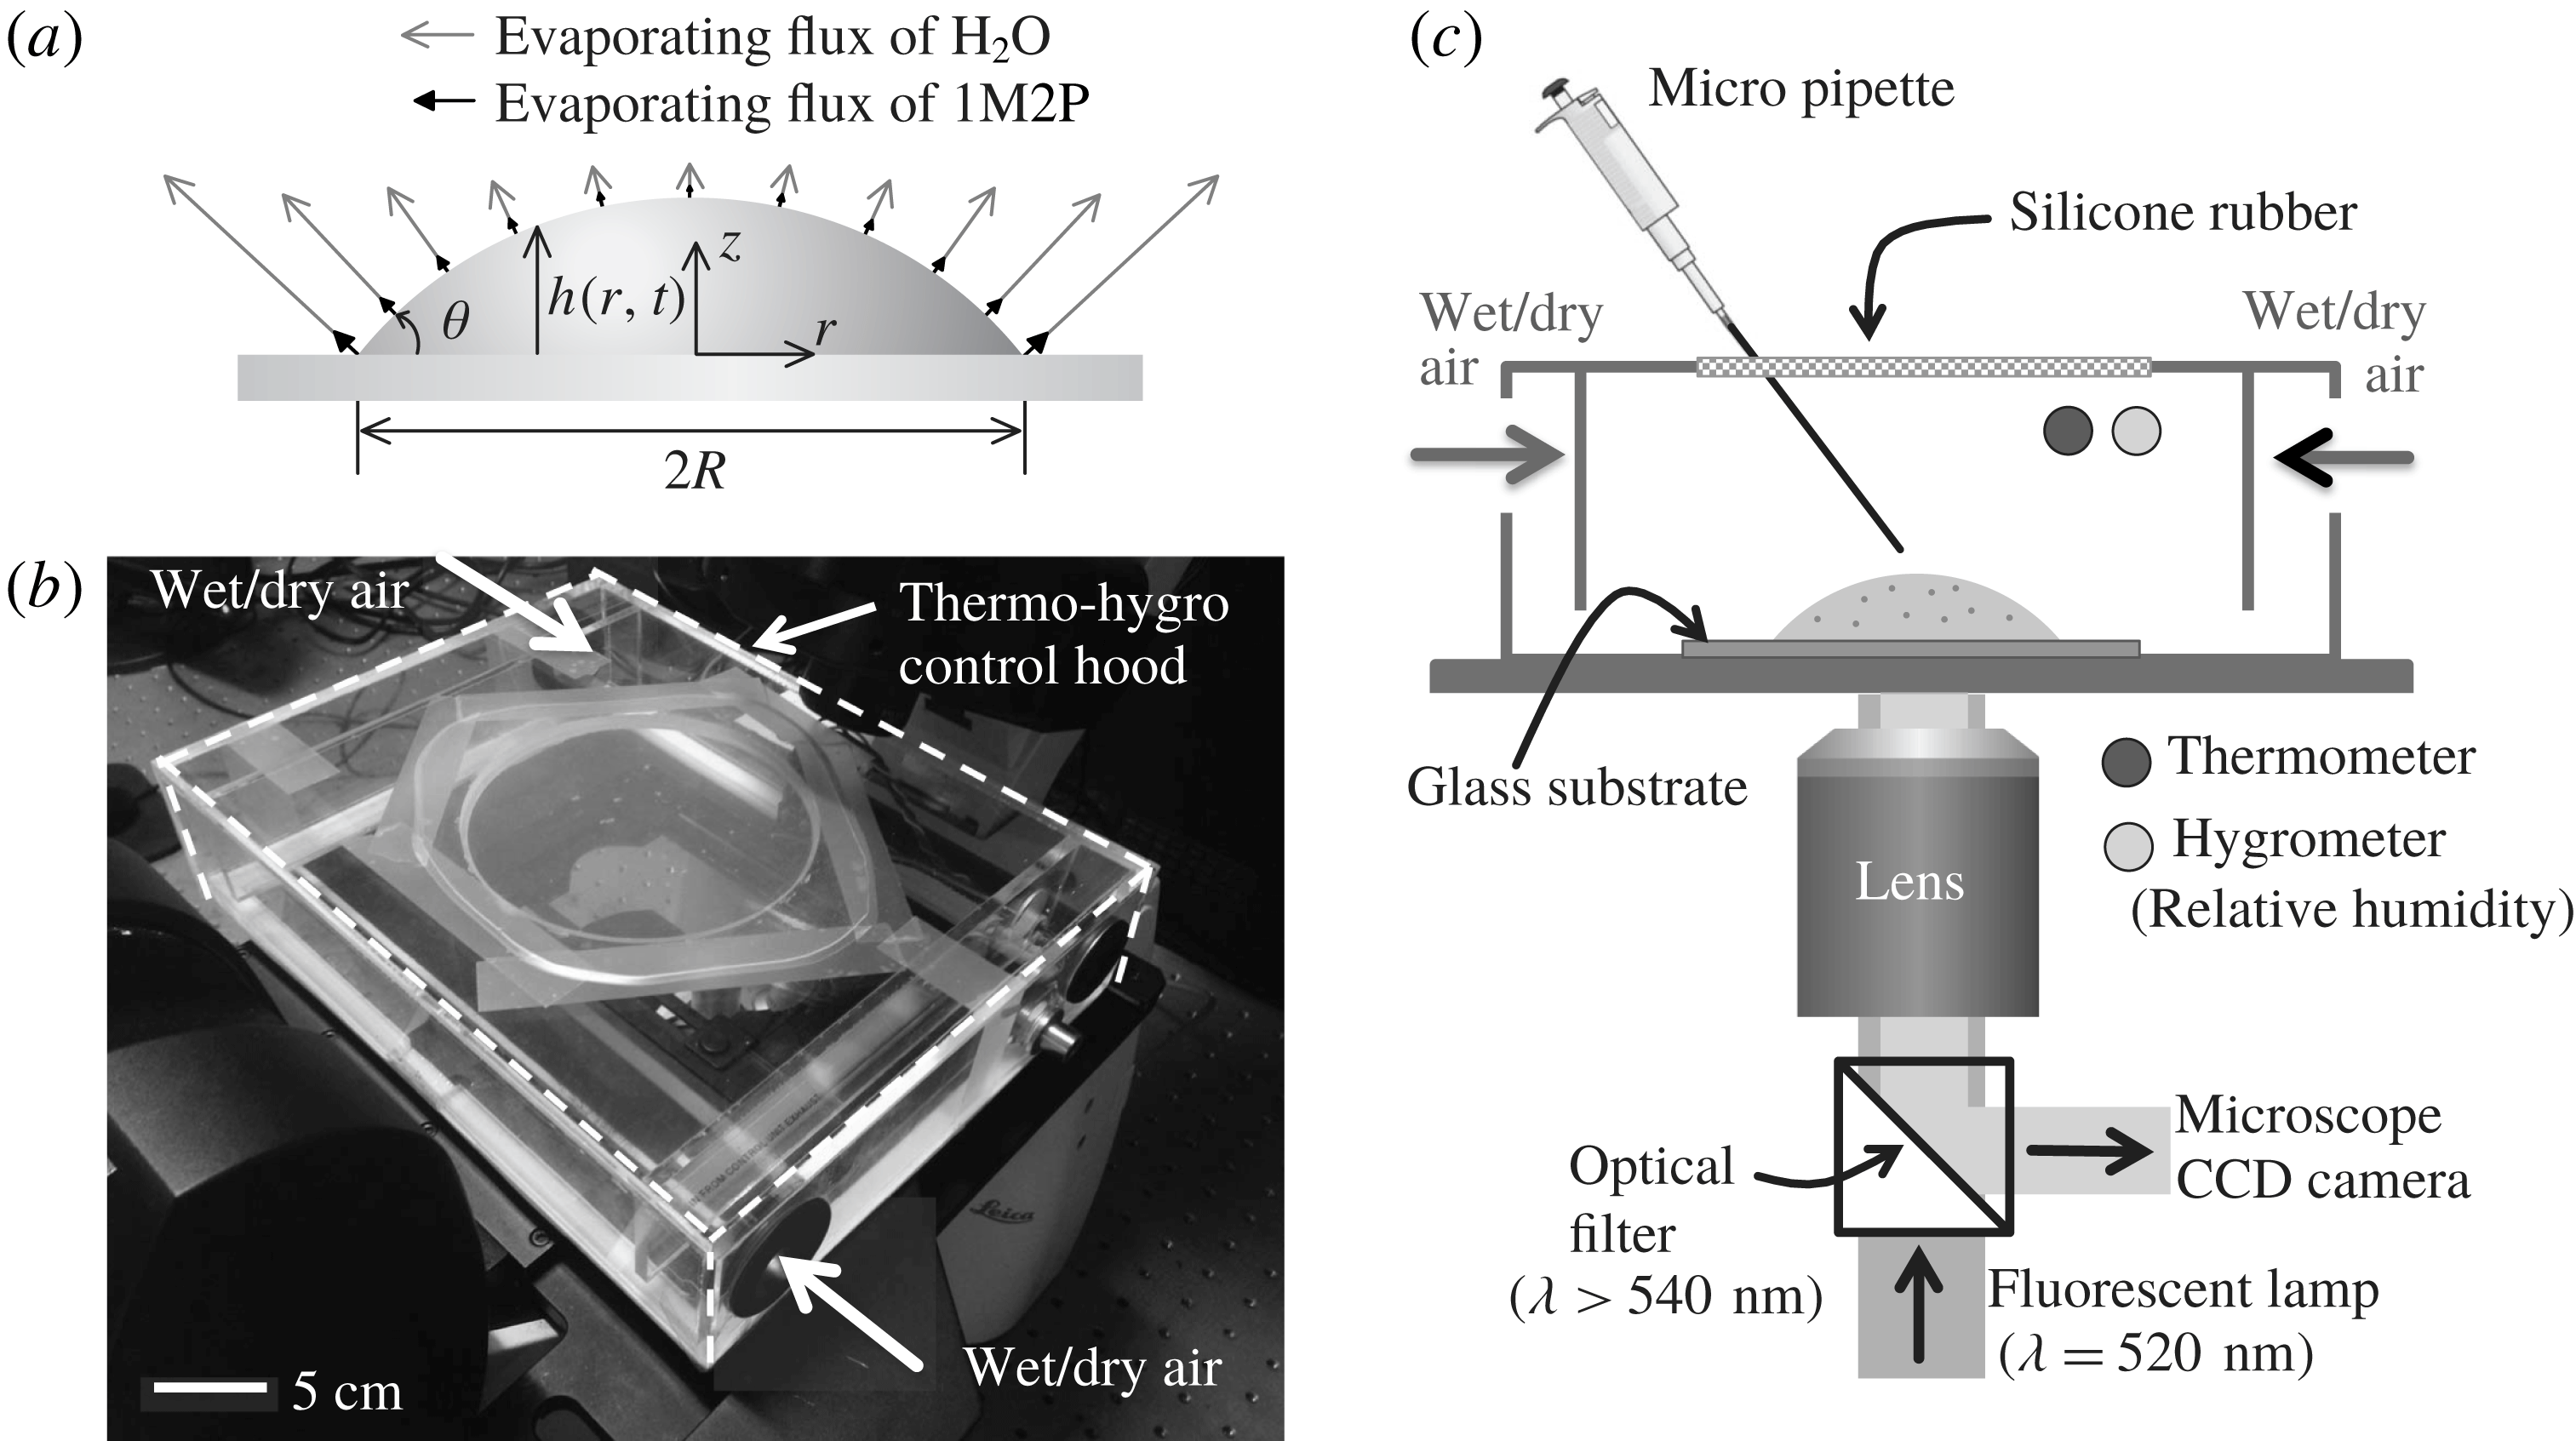
In this study, we explore the evaporation of a mixture (see figure 1
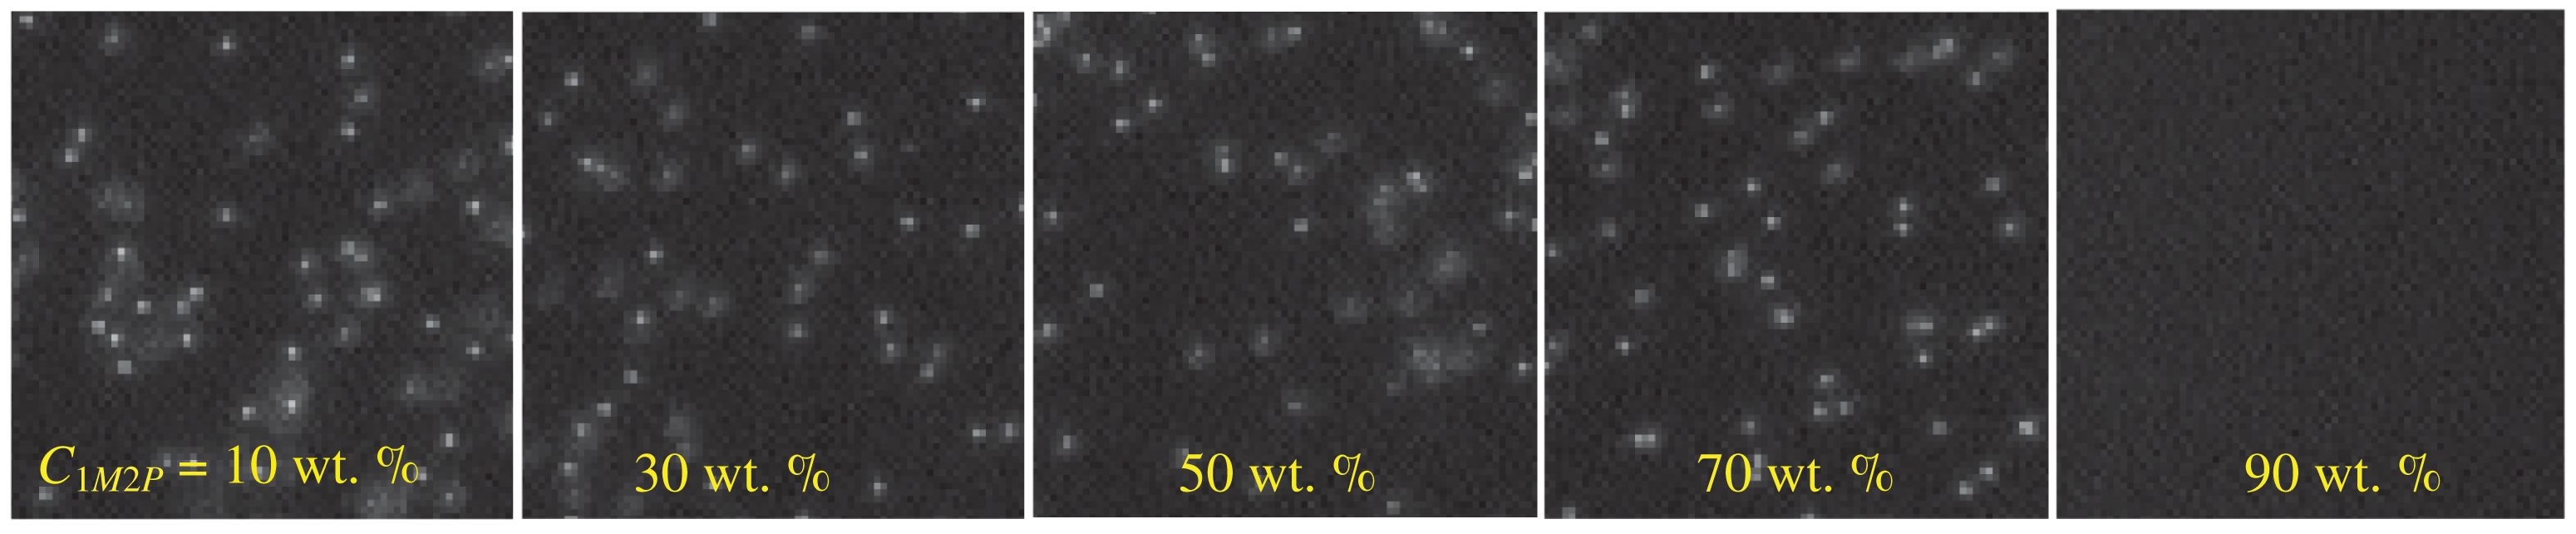
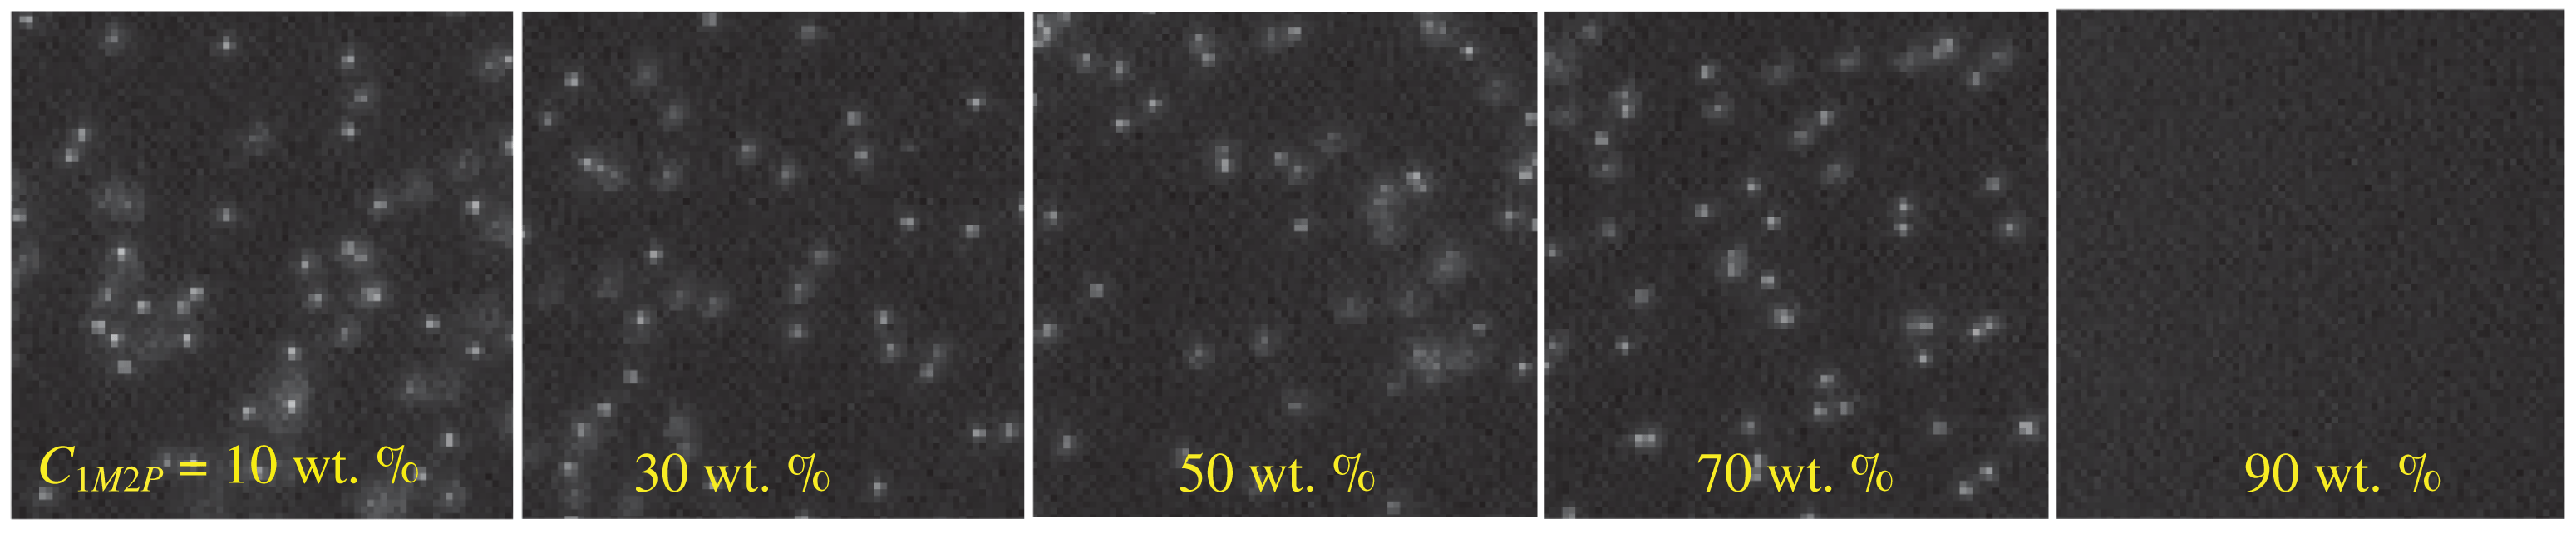
a) using a novel method that visualizes the selective evaporation of two components having different volatilities by opting for a specific mixture that produces a concentration-dependent dissolution of suspended particles. The solution contains 1-Methyl 2-Pyrrolidinone (1M2P) and deionized (DI) water. We observe that when the local concentration of 1M2P in the mixture exceeds 90 wt.%, the mixture dissolves polystyrene particles completely (see figure 2). We observe that the suspended particles disappear near the contact line where the contact angle is small (
 $\unicode[STIX]{x1D703}<90^{\circ }$
), which imposes a higher evaporative flux at the contact line than towards the middle of the drop (Deegan et al.
Reference Deegan, Bakajin, Dupont, Huber, Nagel and Witten1997). As a result, we document the selective evaporation where the relative local concentration of a volatile liquid (water) near the contact line decreases as evaporation occurs. We expect that the experimental idea introduced and demonstrated here will enable visualization of hidden features that have not been explored before. Additionally, we note that Li et al. (Reference Li, Lv, Diddens, Tan, Wijshoff, Versluis and Lohse2018) have recently studied an analogous problem and although their physical system and measurements are different from those considered here, they reach similar conclusions regarding the underlying dynamics and chemical segregation.
Experimental set-up. (a) Sketch of a liquid drop evaporating on a solid substrate where the maximum evaporative flux is located at the contact line. The relative lengths of the grey and black arrows qualitatively indicate the strength of the flux of water and 1-Methyl 2-Pyrrolidinone solvent, respectively. (b) Picture of the experimental set-up on top of an inverted microscope. (c) Schematic of the experimental set-up. The relative humidity is controlled by supplying wet and dry air. To measure the movements of Rhodamine-B labelled fluorescent particles, the particles are illuminated with a green light (
 $\unicode[STIX]{x1D706}=520$
nm) and a fluorescent particle signal (
 $\unicode[STIX]{x1D706}>540$
nm) is captured by a CCD camera on the microscope.

Fluorescent particle imaging in water–1M2P mixtures. The polystyrene particles (
 $1~\unicode[STIX]{x03BC}\text{m}$
diameter) are dispersed in solutions with different concentration ratios (wt.%) between DI water and 1M2P solvent. The 1M2P concentration of the mixture increases from left to right (10–90 wt.%) where the mixture was fully stirred and mixed. Illumination is performed with a fluorescent light (
 $\unicode[STIX]{x1D706}=532$
nm).
Furthermore, for diffusion-dominated dynamics and assuming an axisymmetric configuration, we develop an analytical model in § 3.2. Although the model is simplified, we show that the analytical results are in good agreement with experimental measurements.
2 Experimental methods
2.1 Preparation of the mixture
For the binary solution, we used a mixture consisting of 1-Methyl 2-Pyrrolidinone (Sigma-Aldrich, USA) and DI water (Millipore MilliQ, USA). 1-Methyl 2-Pyrrolidinone has density
 $\unicode[STIX]{x1D70C}=1030~\text{kg}~\text{m}^{-3}$
, viscosity
 $\unicode[STIX]{x1D707}=1.65\times 10^{-3}$
Pa s, surface tension
 $\unicode[STIX]{x1D6FE}=40~\text{mN}~\text{m}^{-1}$
and vapour pressure
 $p_{va}=38.6$
Pa at
 $T=293$
K. Deionized (DI) water has
 $\unicode[STIX]{x1D70C}=1000~\text{kg}~\text{m}^{-3}$
,
 $\unicode[STIX]{x1D707}=10^{-3}$
Pa s,
 $\unicode[STIX]{x1D6FE}=72.0~\text{mN}~\text{m}^{-1}$
and
 $p_{va}=2.34$
kPa at
 $T=293$
K. The boiling temperatures of water and the solvent are 373 K and 475 K, respectively. For the individual measurements, we prepared a solution containing fluorescent polystyrene particles at an initial concentration of
 $6.67\times 10^{-4}$
vol.%. In the petrochemical and plastics industries, 1M2P is used since it is non-volatile, non-toxic and dissolves diverse materials. (Harreus et al.
Reference Harreus, Backes, Eichler, Feuerhake, Jaekel, Mahn, Pinkos and Vogelsang2000). To check the stability of the fluorescent polystyrene particles in the mixture, after preparing the solution with particles, we set the samples aside and then one or two weeks later we examined the same solution and counted the number of particles under a microscope. We observed that there were no differences between the two experiments. Although we recognized that solutions below the critical concentration do not dissolve particles over a couple of days, we prepared a new solution for each experiment and completed the experiment on the same day.
We can also provide some suggestions to design a mixture to visualize the selective evaporation: (i) the two components are fully soluble in each other, (ii) the vapour pressure of the two liquids are significantly different and (iii) at a certain concentration ratio, the mixture dissolves a suspended material (e.g. particles in this study).
2.2 Substrate preparation
Cover (VWR, USA) glasses were cleaned for 5 min in an acetone solution in an ultrasonic bath, rinsed multiple times with DI water (Millipore MilliQ, USA) and dried using nitrogen gas. Before the experiments, the substrate was dried by keeping it in an oven for 30 min at 333 K. Apparent contact angles of approximately
 $60\pm 3^{\circ }$
and
 $37\pm 3^{\circ }$
were measured, respectively, for droplets of DI water and 1M2P solvent on cover glasses.
2.3 Temperature and humidity control hood
The temperature and humidity control hood is illustrated in figure 1(b,c). The size of the hood is
 $26~\text{cm}\times 20~\text{cm}\times 6~\text{cm}$
. The relative humidity is regulated by a controller (ETS Microcontroller Model-5100, Glenside, PA, USA). During the experiments, the temperature is set to
 $\text{T}=300\pm 1$
K and the uncertainty of the relative humidity value is approximately
 $\pm 2\,\%$
for each set value.
2.4 Fluorescent particle image acquisition
The
 $1~\unicode[STIX]{x03BC}\text{m}$
diameter Rhodamine-B fluorescent particles (carboxylate-modified polystyrene particles, Invitrogen, USA) were illuminated with a green light source (wavelength
 $\unicode[STIX]{x1D706}=520$
nm). The fluorescent signals from the particles (
 $\unicode[STIX]{x1D706}>540$
nm) were captured at a frame rate of 10 frames per second (f.p.s.) by a CCD camera having a resolution of
 $1392\times 1040$
pixels and a 12-bit dynamic range, which is built into a Leica microscope (Leica DFC 300 FX, Wetzlar, Germany).
2.5 Measurement of physical properties
Physical property measurements were performed at
 $T=298$
K. In particular, surface tension measurements were performed by means of the pendant droplet method. To calculate the surface tension from the drop shape, we used an in-house MATLAB code, which is validated by comparing with experimental results obtained with a conventional goniometer (Theta Lite, Biolin Scientific). The viscosity of all liquids was measured with a rheometer (Anton-Paar MCR 301, USA) with a sand-blasted cylinder system (CC27 geometry). Also, weights were measured with a Mettler Toledo XS105 scale.
2.6 Side view measurements of an evaporating droplet
A Nikon D5100 camera with an AF-S Nikkor 70–200 mm f/4G lens was installed to observe the side view of an evaporating droplet. We recorded the side view of a drop deposited on a cover glass. The contact angle was determined from a fit to the liquid interface data within a distance of
 $50~\unicode[STIX]{x03BC}\text{m}$
from the corner tip of the droplet. In this study, we observed that there is a single apparent contact angle during evaporation although the local concentration ratio of the mixture in the vicinity of the contact line changes. We only measure contact angles above
 $10^{\circ }$
; the angles were determined using image processing based on in-house codes using MATLAB 2016a.
3 Results
3.1 Measurement of the local concentration of a binary mixture
We observe that at a specific concentration of the 1M2P in water, the mixture dissolves polystyrene materials. In particular, we prepared a solution containing
 $1~\unicode[STIX]{x03BC}\text{m}$
diameter fluorescent particles. By varying the organic solvent weight fraction in the mixture (e.g. 10–90 wt.%), we find a critical condition,
 $C_{1M2P}>88\pm 2$
wt.%, above which the polystyrene particles dissolve in the mixture (see figure 2). Here, the vapour pressure of the organic solvent is much lower than that of water, i.e.
 $p_{va,1M2P}/p_{va,water}\approx 0.02$
. Therefore, we assume that the evaporation of 1-Methyl 2-Pyrrolidinone is negligible compared to the evaporation of water.
When a sessile droplet evaporates on a solid surface, the evaporative flux profile is non-uniform along the surface; see figure 1(a) (Deegan et al. Reference Deegan, Bakajin, Dupont, Huber, Nagel and Witten1997). Therefore, the local concentration varies mainly along the radial direction and, because of the small aspect ratio of the drop, is weakly dependent on the vertical direction. As shown in figure 2, the polystyrene particles disappear if the local concentration of the organic solvent reaches a critical concentration. Thus, by detecting the boundary where fluorescent particles disappear in the water–1M2P mixture, we can estimate the critical local concentration of the organic solvent.
For the droplet experiments, a liquid volume
 $0.6\pm 0.1~\unicode[STIX]{x03BC}\text{l}$
is deposited on top of a solid substrate (see the experimental set-up in figure 1) and all experiments are performed in a closed container where the temperature and humidity are controlled. The system is observed from below using an inverted microscope (Leica DMI5000 M). By controlling the relative humidity inside the experimental set-up, we control the evaporation rate of water while the evaporation rate of 1M2P solvent is extremely low compared to water because of its low vapour pressure.
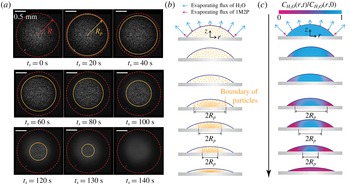
Evaporation of a droplet containing a binary mixture (water : 1M2P – 30 : 70 wt.%). (a) Snapshots from a movie recorded at a frame rate of 10 frames per second (f.p.s.) (see supplementary movie 1 available at https://doi.org/10.1017/jfm.2018.472). The droplet evaporated under 10 % relative humidity of air. The images were recorded from below and the focal plane was placed near the glass substrate. The red-dashed circles indicate the wetted area of the deposited droplet. The orange circles show the boundary where the individual particles are detected.
 $t_{s}=0$
is defined when the particles begin to disappear. The apparent contact angle
 $\unicode[STIX]{x1D703}$
is about
 $42\pm 1^{\circ }$
until
 $t_{s}=150$
s. The scale bars are 0.5 mm. (b) Sketch of the particle distribution during evaporation. We observed that at the centre of the droplet the speckle particle images away from the focal plane (i.e. near the solid substrate) remain while the critical local concentration boundary invades the centre of the drop, which indicates that the particles mainly disappear in the radial direction (see supplementary movie 2). (c) Sketch of the relative concentration (referring to the weight fraction) of water (blue) in the evaporating droplet. The blue and purple arrows represent quantitatively the evaporation rate of water and 1M2P, respectively.

Due to the selective evaporation of the binary mixture, we observed that the polystyrene particles disappear from the region near the contact line and the boundary (
 $R_{p}(t_{s})$
) recedes, as shown in figure 3(a), where the initial concentration ratio between the DI water and 1M2P is 30 : 70 wt.% and the environment has a relative humidity of approximately 10 %. We set the time
 $t_{s}=0$
when the fluorescent polystyrene particles start to disappear at the contact line. Based on the experimental results (figure 3
a), we sketch the particle distribution and local concentration of water in figures 3(b) and 3(c), respectively.
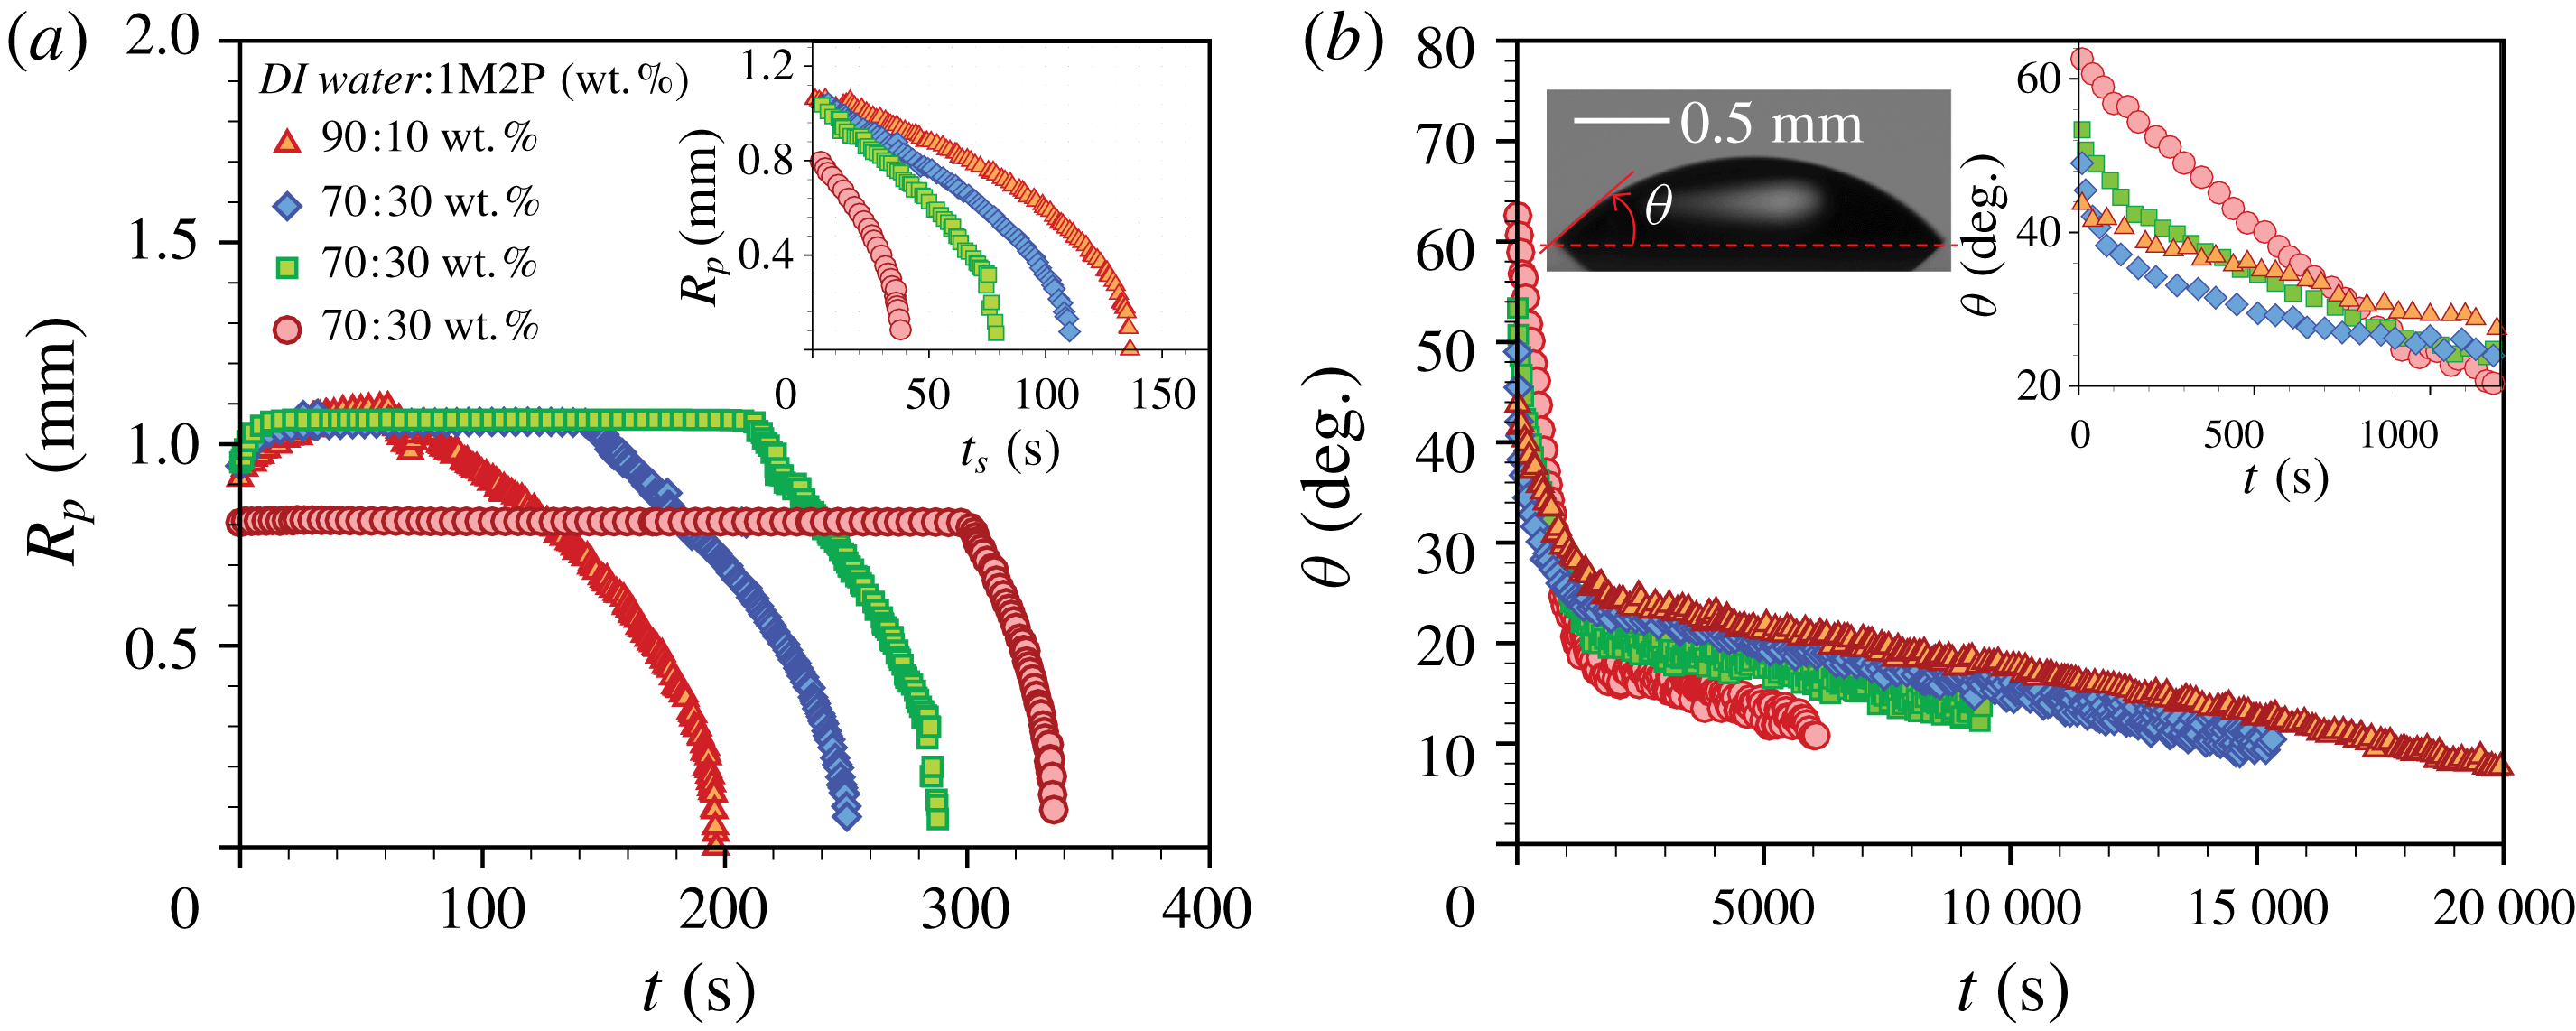
We performed experiments to measure the radial boundary (
 $R_{p}$
) of the fluorescent particles by varying the initial weight fraction of water in the droplet, as shown in figure 4(a). We observed that the initial wetting area and contact angle varied with the initial concentration. After placing a liquid droplet on the solid substrate, initially it slowly spreads (see figure 4
a) and the contact line is pinned after a few tens of seconds. The concentration of water in the vicinity of the contact line rapidly decreases as the binary mixture drop evaporates, which we believe affects the pinning mechanism of the contact line at these early times. Depending on the initial concentration of water in the mixture, the time duration of the constant
 $R_{p}$
phase varied. We observed that at relatively higher weight fractions of water in the mixture it takes more time to shrink the boundary of the signal of the fluorescent particles compared to the other cases, as shown in figure 4(a).
Experimental results. (a) Time-dependent
 $R_{p}$
for different mixture concentrations where
 $t=0$
when the droplet is deposited on the substrate. The droplets evaporated in an environment with a relative humidity of 10 % or smaller. The inset presents the time-dependent
 $R_{p}(t_{s})$
, which indicates the boundary of the disappearing particles for different cases where the fluorescent polystyrene particles begin to disappear at the contact line. (b) Time-dependent apparent contact angle
 $\unicode[STIX]{x1D703}(t)$
for different mixture concentrations. The left inset is a side view of a droplet at the initial time where the water and 1M2P concentrations are 30 and 70 wt.%, respectively. The right inset presents the time-dependent
 $\unicode[STIX]{x1D703}(t)$
for the early times.

The apparent contact angle (
 $\unicode[STIX]{x1D703}$
) was measured from a side view and results are presented in figure 4(b). The initial apparent contact angle ranges from
 $40^{\circ }$
to
 $60^{\circ }$
, which depends on the initial concentration of the water. We observed two different slopes of
 $\unicode[STIX]{x1D703}$
versus
 $t$
because of the different volatilities of the components (see figure 4
b). The initial sharp decrease of the angle is due to the evaporation of water. After the water has almost completely evaporated (typically
 $t<1000$
s), the 1M2P evaporates and the total drying time is approximately
 $O(10^{4}{-}10^{5})$
s.
3.2 Theoretical model
The concentration distribution in a binary mixture droplet is denoted
 $C(r,z,\unicode[STIX]{x1D703},t)$
. Motivated by the results of the experiments described above, we simplify a mathematical model representing the unsteady convection–diffusion equation of a two component, axisymmetric, evaporating sessile droplet. Here, we assume that the droplet radius is always constant due to the pinning of the contact line during evaporation. In cylindrical coordinates, considering the vertically averaged concentration through the thickness
 $h(r,t)$
and denoting the evaporative mass flux
 $J_{i}(r,t)$
of component
 $i$
across the air–liquid interface, we have
 $$\begin{eqnarray}\frac{\unicode[STIX]{x2202}C_{i}}{\unicode[STIX]{x2202}t}=\underbrace{\unicode[STIX]{x1D735}\boldsymbol{\cdot }(D_{i}\unicode[STIX]{x1D735}C_{i})}_{\text{diffusion}}-\underbrace{\unicode[STIX]{x1D735}\boldsymbol{\cdot }(\boldsymbol{u}C_{i})}_{\text{convection}}-\underbrace{\frac{1}{\unicode[STIX]{x1D70C}}\frac{J_{i}(r,t)}{h(r,t)}}_{\text{evaporation}},\end{eqnarray}$$
where
 $D_{i}$
is the diffusivity of component
 $i$
in the liquid phase,
 $\unicode[STIX]{x1D70C}=998~\text{kg}~\text{m}^{-3}$
is the liquid density and
 $C_{i}$
is the concentration (here, referring to the weight fraction) of either species. The component
 $i=1,2$
is for H2O or 1M2P, respectively, and
 $\boldsymbol{u}$
is the fluid velocity.
In this study, the organic solvent has a lower vapour pressure compared to water. Consequently, we assume that the evaporation of 1-Methyl 2-Pyrrolidinone is negligible compared to the evaporation of water. Additionally, for the sake of simplicity, we assume that the evaporative flux of water at the air–liquid interface is constant in time and mainly varies with space. In this problem, initially
 $h(r,0)/R<1$
and
 $h(r,t)/R$
becomes smaller as the droplet evaporates. So, we use the lubrication approximation for a thin drop and then the evaporative flux can be described as
 $J\approx J_{H_{2}O}\approx (2D_{va}\unicode[STIX]{x0394}C)/(\unicode[STIX]{x03C0}[R^{2}-r^{2}]^{1/2})$
(Deegan et al.
Reference Deegan, Bakajin, Dupont, Huber, Nagel and Witten2000; Hu & Larson Reference Hu and Larson2005; Popov Reference Popov2005; Marín et al.
Reference Marín, Gelderblom, Lohse and Snoeijer2011), where
 $D_{va}\approx 2.4\times 10^{-5}~\text{m}^{2}~\text{s}^{-1}$
is the diffusivity of water molecules in vapour and
 $\unicode[STIX]{x0394}C=C_{s}(1-H_{R})$
, where
 $C_{s}\approx 0.023~\text{kg}~\text{m}^{-3}$
is the saturation concentration of vapour and
 $H_{R}$
is the relative humidity.
The droplet deposited on the substrate takes the shape of a spherical cap, which for small contact angles has a shape
 $h(r,t)=((R^{2}-r^{2})/2R)\unicode[STIX]{x1D703}(t)$
. The corresponding volume is
 $V(t)=\int _{0}^{R}2\unicode[STIX]{x03C0}rh(r,t)\,\text{d}r$
. Then, the change of the droplet volume due to evaporation is
 $\text{d}V/\text{d}t\cong -(2\unicode[STIX]{x03C0}/\unicode[STIX]{x1D70C})\int _{0}^{R}J_{H_{2}O}(r,t)r\,\text{d}r$
. From these equations, we obtain
 $$\begin{eqnarray}\unicode[STIX]{x1D703}(t)\cong \frac{16D_{va}\unicode[STIX]{x0394}C}{\unicode[STIX]{x03C0}\unicode[STIX]{x1D70C}R^{2}}(t_{f}-t)+\unicode[STIX]{x1D703}_{1M2P},\end{eqnarray}$$
where
 $\unicode[STIX]{x1D703}_{1M2P}$
is the contact angle of the drop of the remaining organic solvent after water has completely evaporated, so
 $\unicode[STIX]{x1D703}(t_{f})\approx \unicode[STIX]{x1D703}_{1M2P}$
, where
 $t_{f}$
is the ‘final’ time after which the particles have disappeared completely throughout the drop. Here
 $t_{f}$
is determined from the experimental results where
 $R_{p}(t_{f})=0$
(see figure 4
a,b).
Mass transport in an evaporating binary droplet is governed by two possible mechanisms. First, convection could occur along the radial direction due to Marangoni effects driven by temperature and/or solute concentration gradients. Second, diffusion in the liquid phase occurs along both the
 $r$
- and
 $z$
-directions. For each transport process, we estimate the time scale as
 $$\begin{eqnarray}\unicode[STIX]{x1D70F}_{d}\sim \frac{R^{2}}{D}\approx O(10^{3}~\text{s}),\quad \unicode[STIX]{x1D70F}_{c}\sim \frac{R}{U}\approx O(10^{3}~\text{s}),\quad \text{and}\quad \unicode[STIX]{x1D70F}_{e}\sim \frac{\unicode[STIX]{x1D70C}h^{2}}{D_{va}C_{s}}\approx O(10^{2}~\text{s}),\end{eqnarray}$$
where
 $\unicode[STIX]{x1D70F}_{d}$
,
 $\unicode[STIX]{x1D70F}_{c}$
and
 $\unicode[STIX]{x1D70F}_{e}$
are, respectively, the characteristic times for diffusion along the
 $r$
-direction, convection along the droplet radius and diffusion along the
 $z$
-direction. Diffusion along the
 $z$
-direction is mainly driven by evaporation across the air–liquid interface. Here, the typical droplet radius
 $R\approx 1$
mm and the height
 $h\leqslant 100~\unicode[STIX]{x03BC}\text{m}$
. The diffusion coefficient (
 $D$
) in the liquid phase is estimated from the Stokes–Einstein model, which does not predict the details perfectly but it does capture the trend that can explain the main mechanism of our observations. Using particle image velocimetry (PIV), we measured the maximum evaporation-driven velocity magnitude
 $U\approx 1~\unicode[STIX]{x03BC}\text{m}~\text{s}^{-1}$
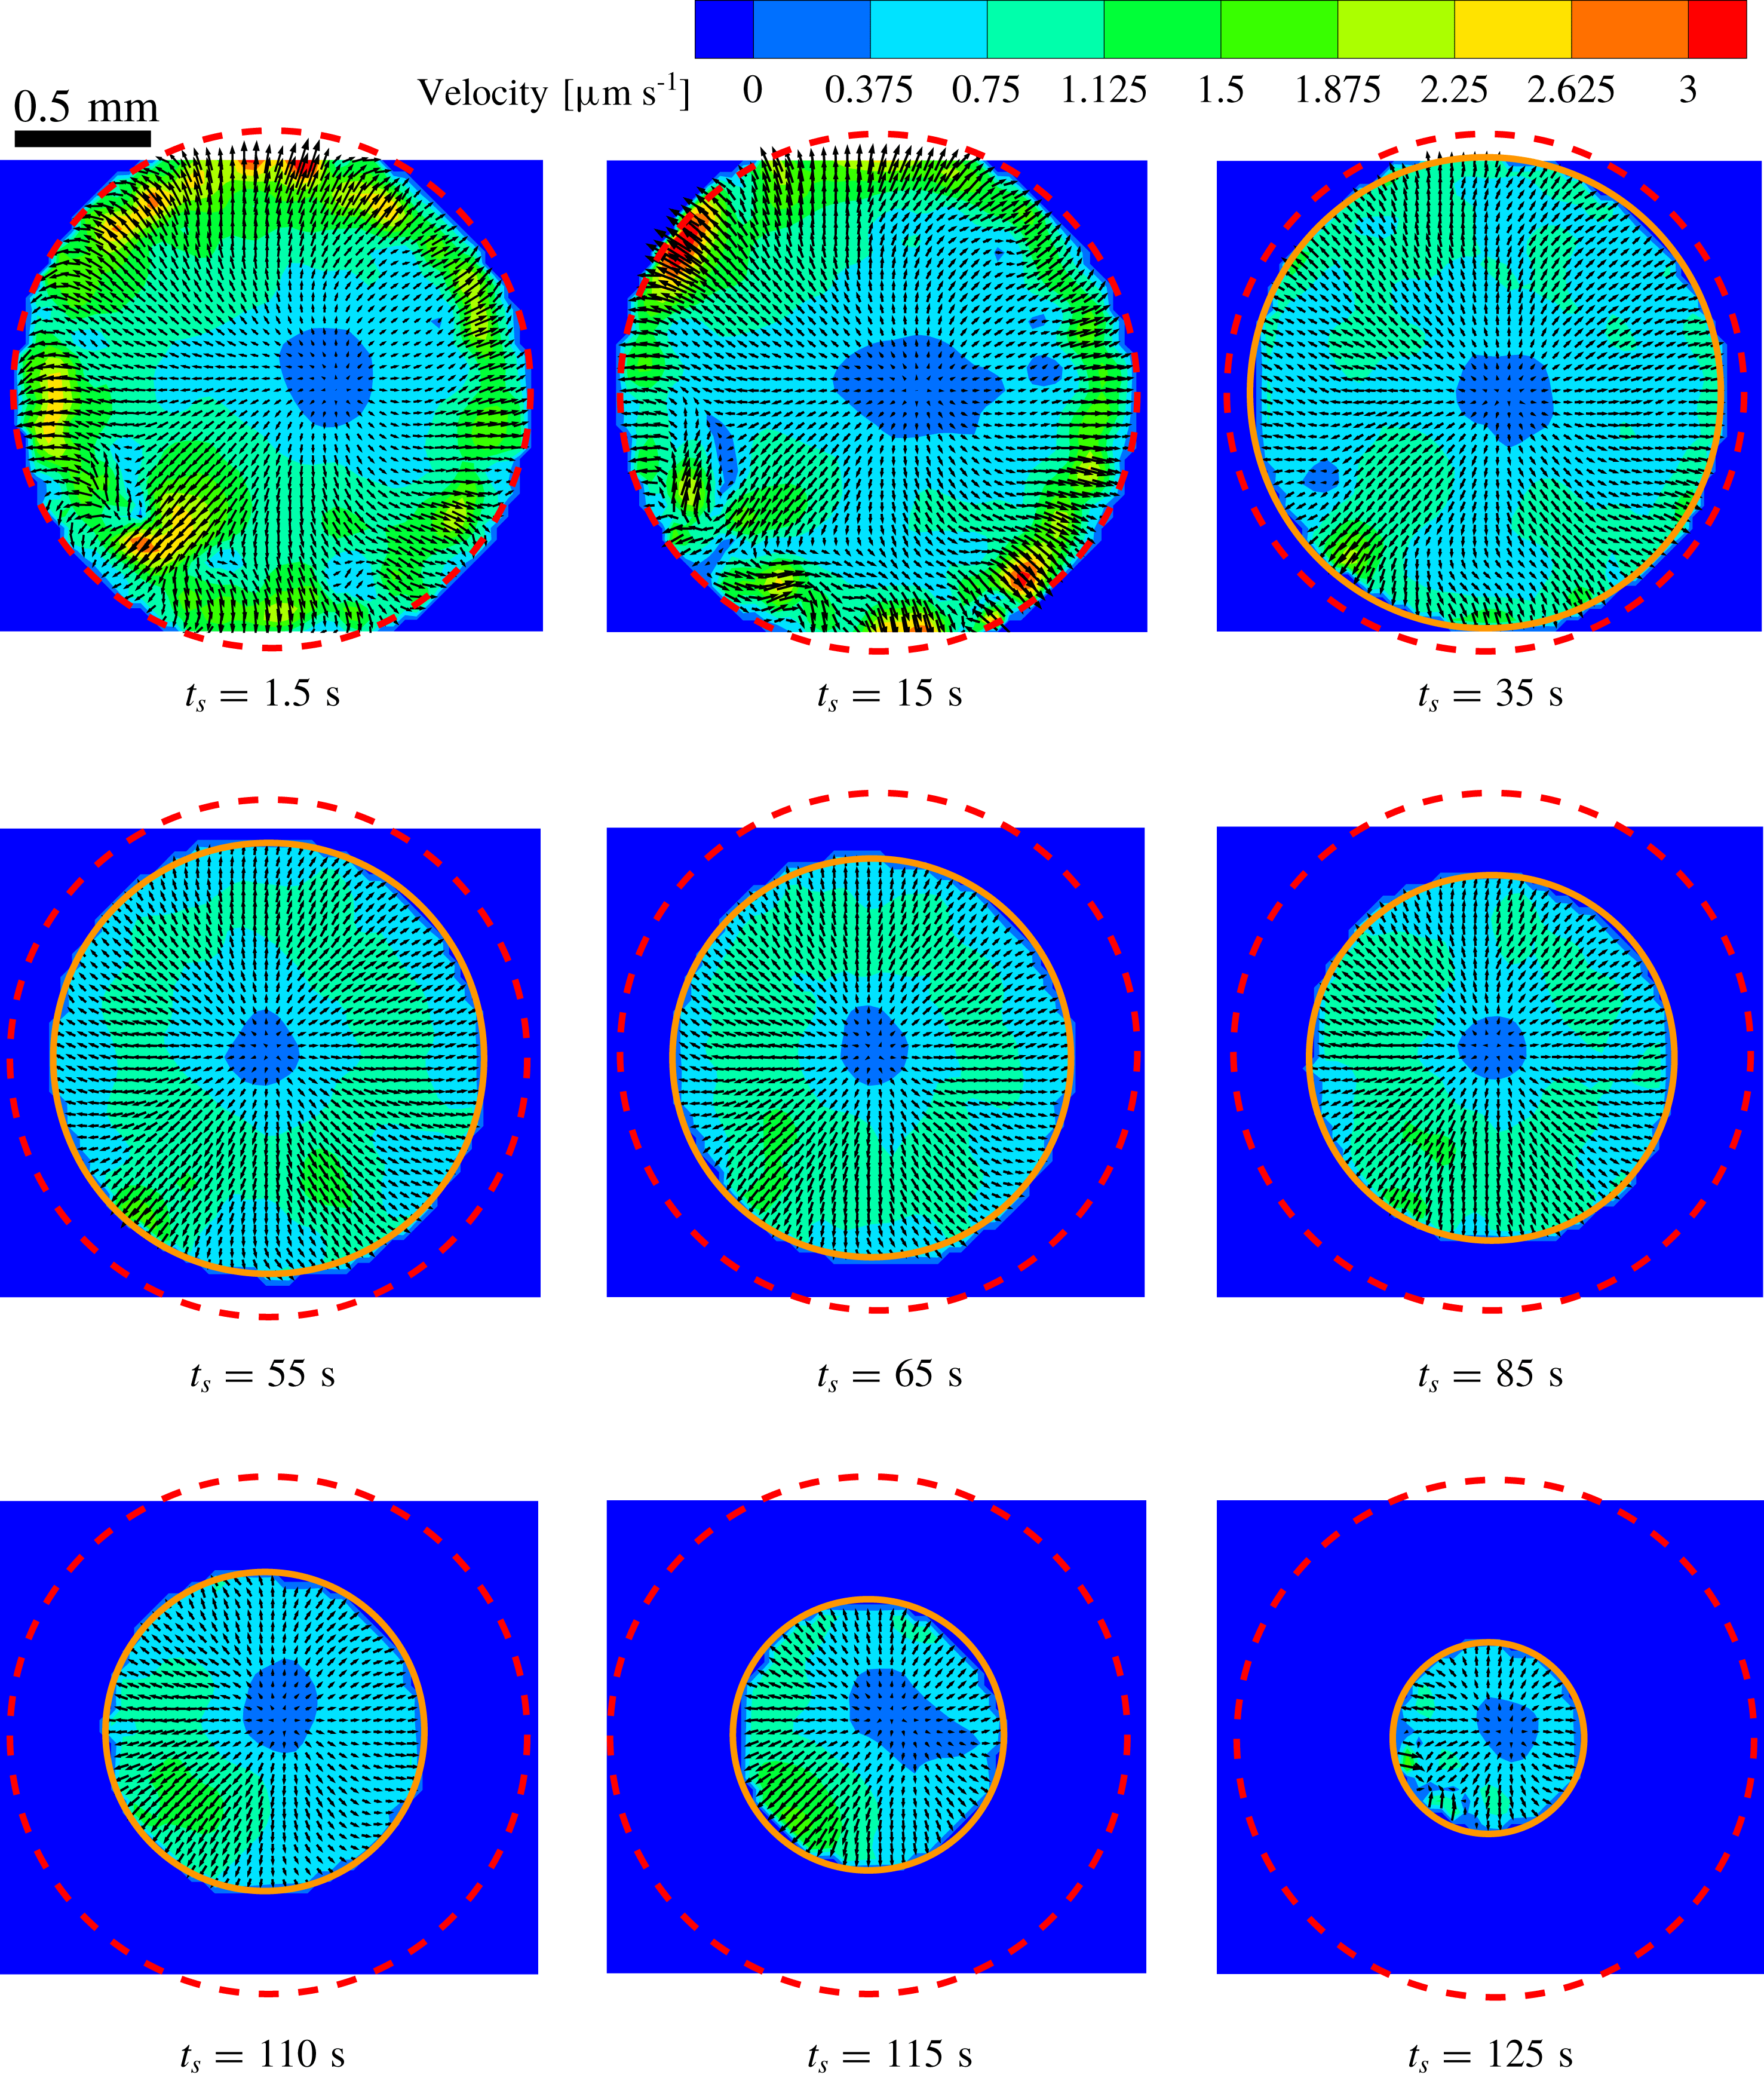
(see the flow fields in figure 7 of Appendix and supplementary movie 1). Then, we expect that evaporation across the air–liquid interface is dominant as
 $\unicode[STIX]{x1D70F}_{d}/\unicode[STIX]{x1D70F}_{e}>1$
and
 $\unicode[STIX]{x1D70F}_{c}/\unicode[STIX]{x1D70F}_{e}>1$
. Furthermore, in this problem, the Péclet number
 $Pe=(h^{2}U)/(RD)\ll 1$
. Thus, equation (3.1) for the chemical concentration (the weight fraction) in the droplet simplifies to an unsteady one-dimensional model for the water mass fraction, i.e.
 $$\begin{eqnarray}\frac{\unicode[STIX]{x2202}C_{H_{2}O}}{\unicode[STIX]{x2202}t}\cong -\frac{J_{H_{2}O}(r)}{\unicode[STIX]{x1D70C}R}\left(\frac{2}{1-(r/R)^{2}}\right)\frac{1}{\unicode[STIX]{x1D703}(t)},\end{eqnarray}$$
where the time-dependent contact angle is determined from (3.2). Then, integrating once more, the concentration profile in the evaporating droplet is given by
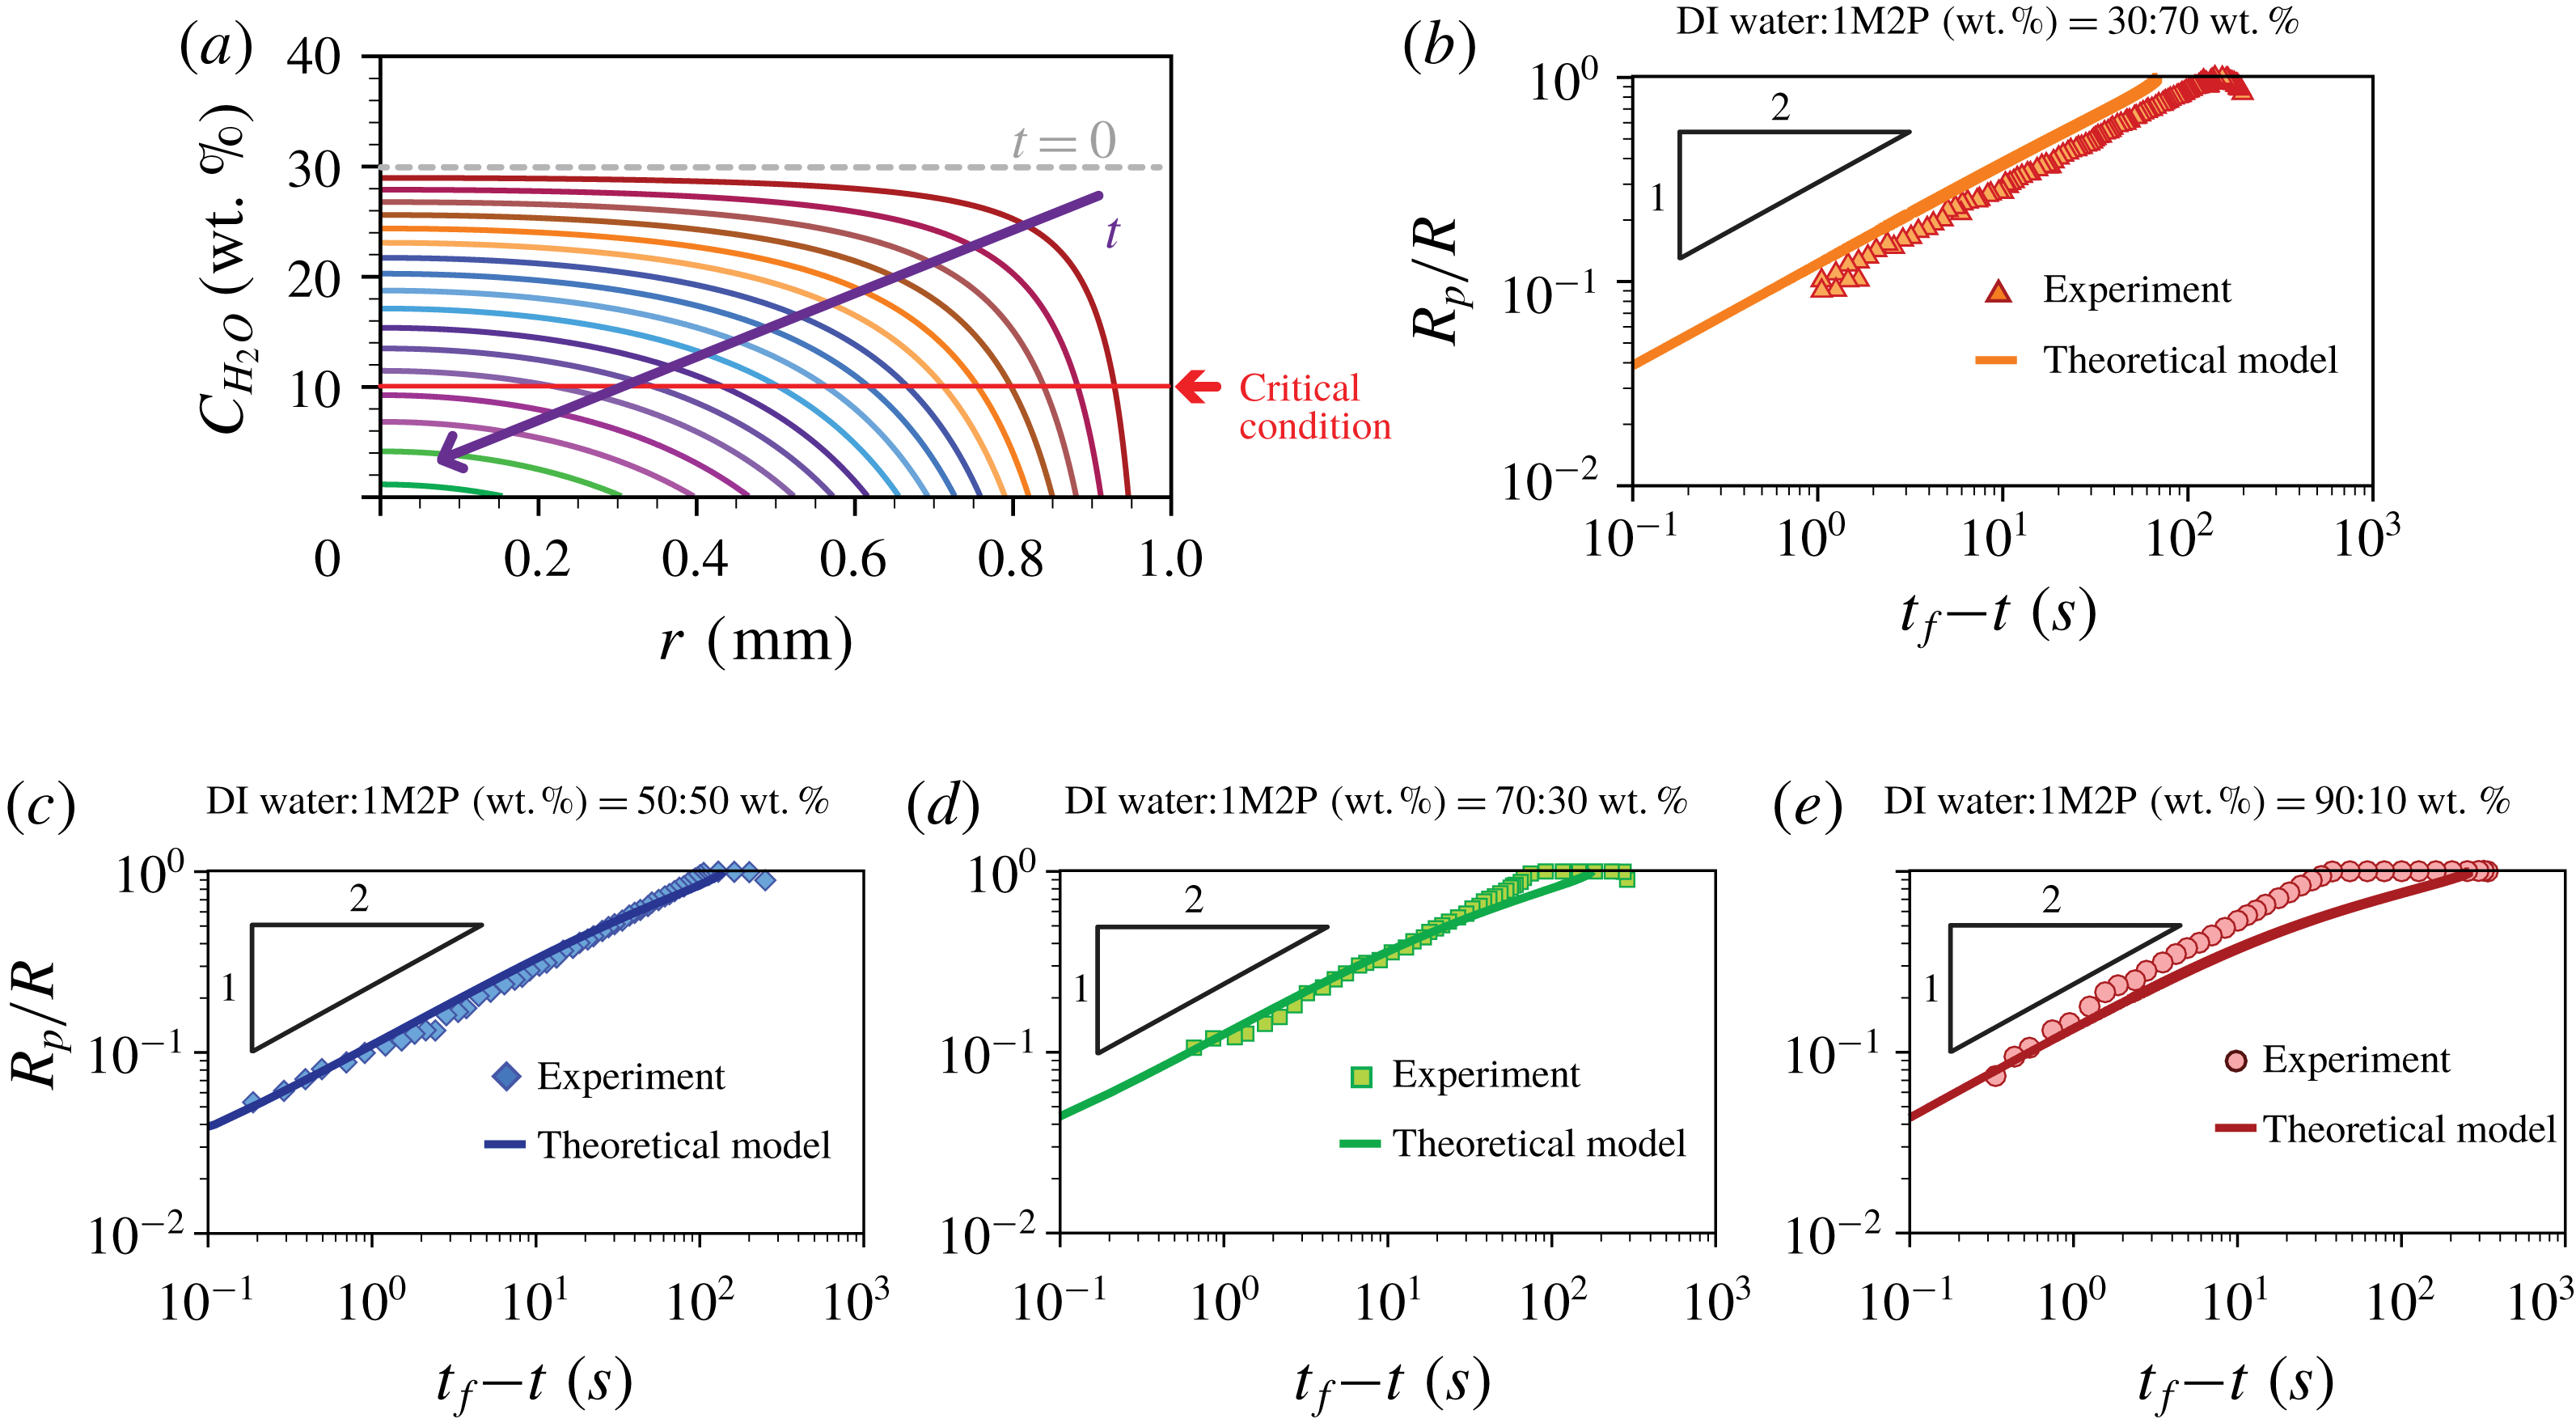
 $$\begin{eqnarray}C_{H_{2}O}(r,t)\cong C_{H_{2}O}^{\ast }+\frac{1}{4[1-(r/R)^{2}]^{3/2}}\ln \left|1-\frac{t}{\left({\displaystyle \frac{\unicode[STIX]{x03C0}\unicode[STIX]{x1D70C}R^{2}}{16D_{va}\unicode[STIX]{x0394}C}}\right)[\unicode[STIX]{x1D703}(0)-\unicode[STIX]{x1D703}_{1M2P}]}\right|,\end{eqnarray}$$
where
 $C_{H_{2}O}^{\ast }$
(
 $=C_{H_{2}O}(r,0)$
) is the initial water concentration (the weight fraction) in the drop. The time-dependent, spatially non-uniform water concentration is plotted in figure 5(a) and illustrates quantitatively how the high vapour pressure component is present at lower concentrations in the vicinity of the contact line compared to the centre of the drop (Karpitschka et al.
Reference Karpitschka, Liebig and Riegler2017).
Comparison between theoretical and experimental results. (a) Time evolution of the water concentration profiles along the
 $r$
-direction based on the theoretical model (3.5). The initial concentration of water in the mixture is 30 wt.%. The purple arrow represents increasing time. We assumed that during evaporation the contact line is pinned at
 $R=1$
mm. (b–e) Comparison of
 $R_{p}/R$
versus
 $t_{f}$
–
 $t$
between the theoretical (solid line) and experimental results (symbols) depending on the initial concentration ratios where
 $t_{f}$
is the final time after which the particles have disappeared completely throughout the drop. (b) DI water-1M2P (30 % : 70 % by weight). (c) DI water-1M2P (50 % : 50 % by weight). (d) DI water-1M2P (70 % : 30 % by weight). (e) DI water-1M2P (90 % : 10 % by weight).

We note that an evaporating multicomponent droplet constitutes a fully three-dimensional unsteady mass and heat transfer problem (Diddens et al. Reference Diddens, Tan, Lv, Versluis, Kuerten, Zhang and Lohse2017b ) that includes several effects, e.g. the time-dependent droplet shape including a surface profile and contact angle, time- and space-dependent diffusion coefficient, convection effects, etc. However, here we made several assumptions concerning the dominant physical effects that are consistent with our experimental measurements: (i) the evaporative flux is only a function of the radial position, (ii) the internal flow is axisymmetric, (iii) the droplet has a spherical cap shape and (iv) thermo-capillary effects, (v) fluid convection and (vi) diffusive mixing along the radial direction are negligible. To investigate the importance of any individual effect, further numerical investigations are necessary.
To compare the particle dissolution rates between the experimental and analytical results, we rescaled the particle distribution
 $R_{p}(t)/R$
as a function of time
 $t_{f}-t$
, where
 $R$
is the fully spread droplet radius (maximum wetted area) and
 $t_{f}$
is the time when all of the particles have disappeared throughout the droplet.
 $R$
and
 $t_{f}$
are determined from an individual experiment. The results are presented in figure 5(b–e) for four different initial compositions. We observe that the theoretical model can predict well the measurements for all times when the initial concentration ratios between DI water and 1M2P are 30 % : 70 % and 50 % : 50 % by weight respectively. We presume for these two cases the evaporation (diffusion) effect across the air–liquid interface is dominant (see figure 5
b,c). On the other hand, figures 5(d) and 5(e) show some discrepancy between experimental and theoretical results for early times, which possibly can be due to effects ignored in this model, e.g. convection and/or gravity, but the theory fits the experimental data at later times.
In order to examine the time evolution of the local concentration, we considered the regime where the boundary of the fluorescent particles changes, i.e.
 $\text{d}R_{p}/\text{d}t\neq 0$
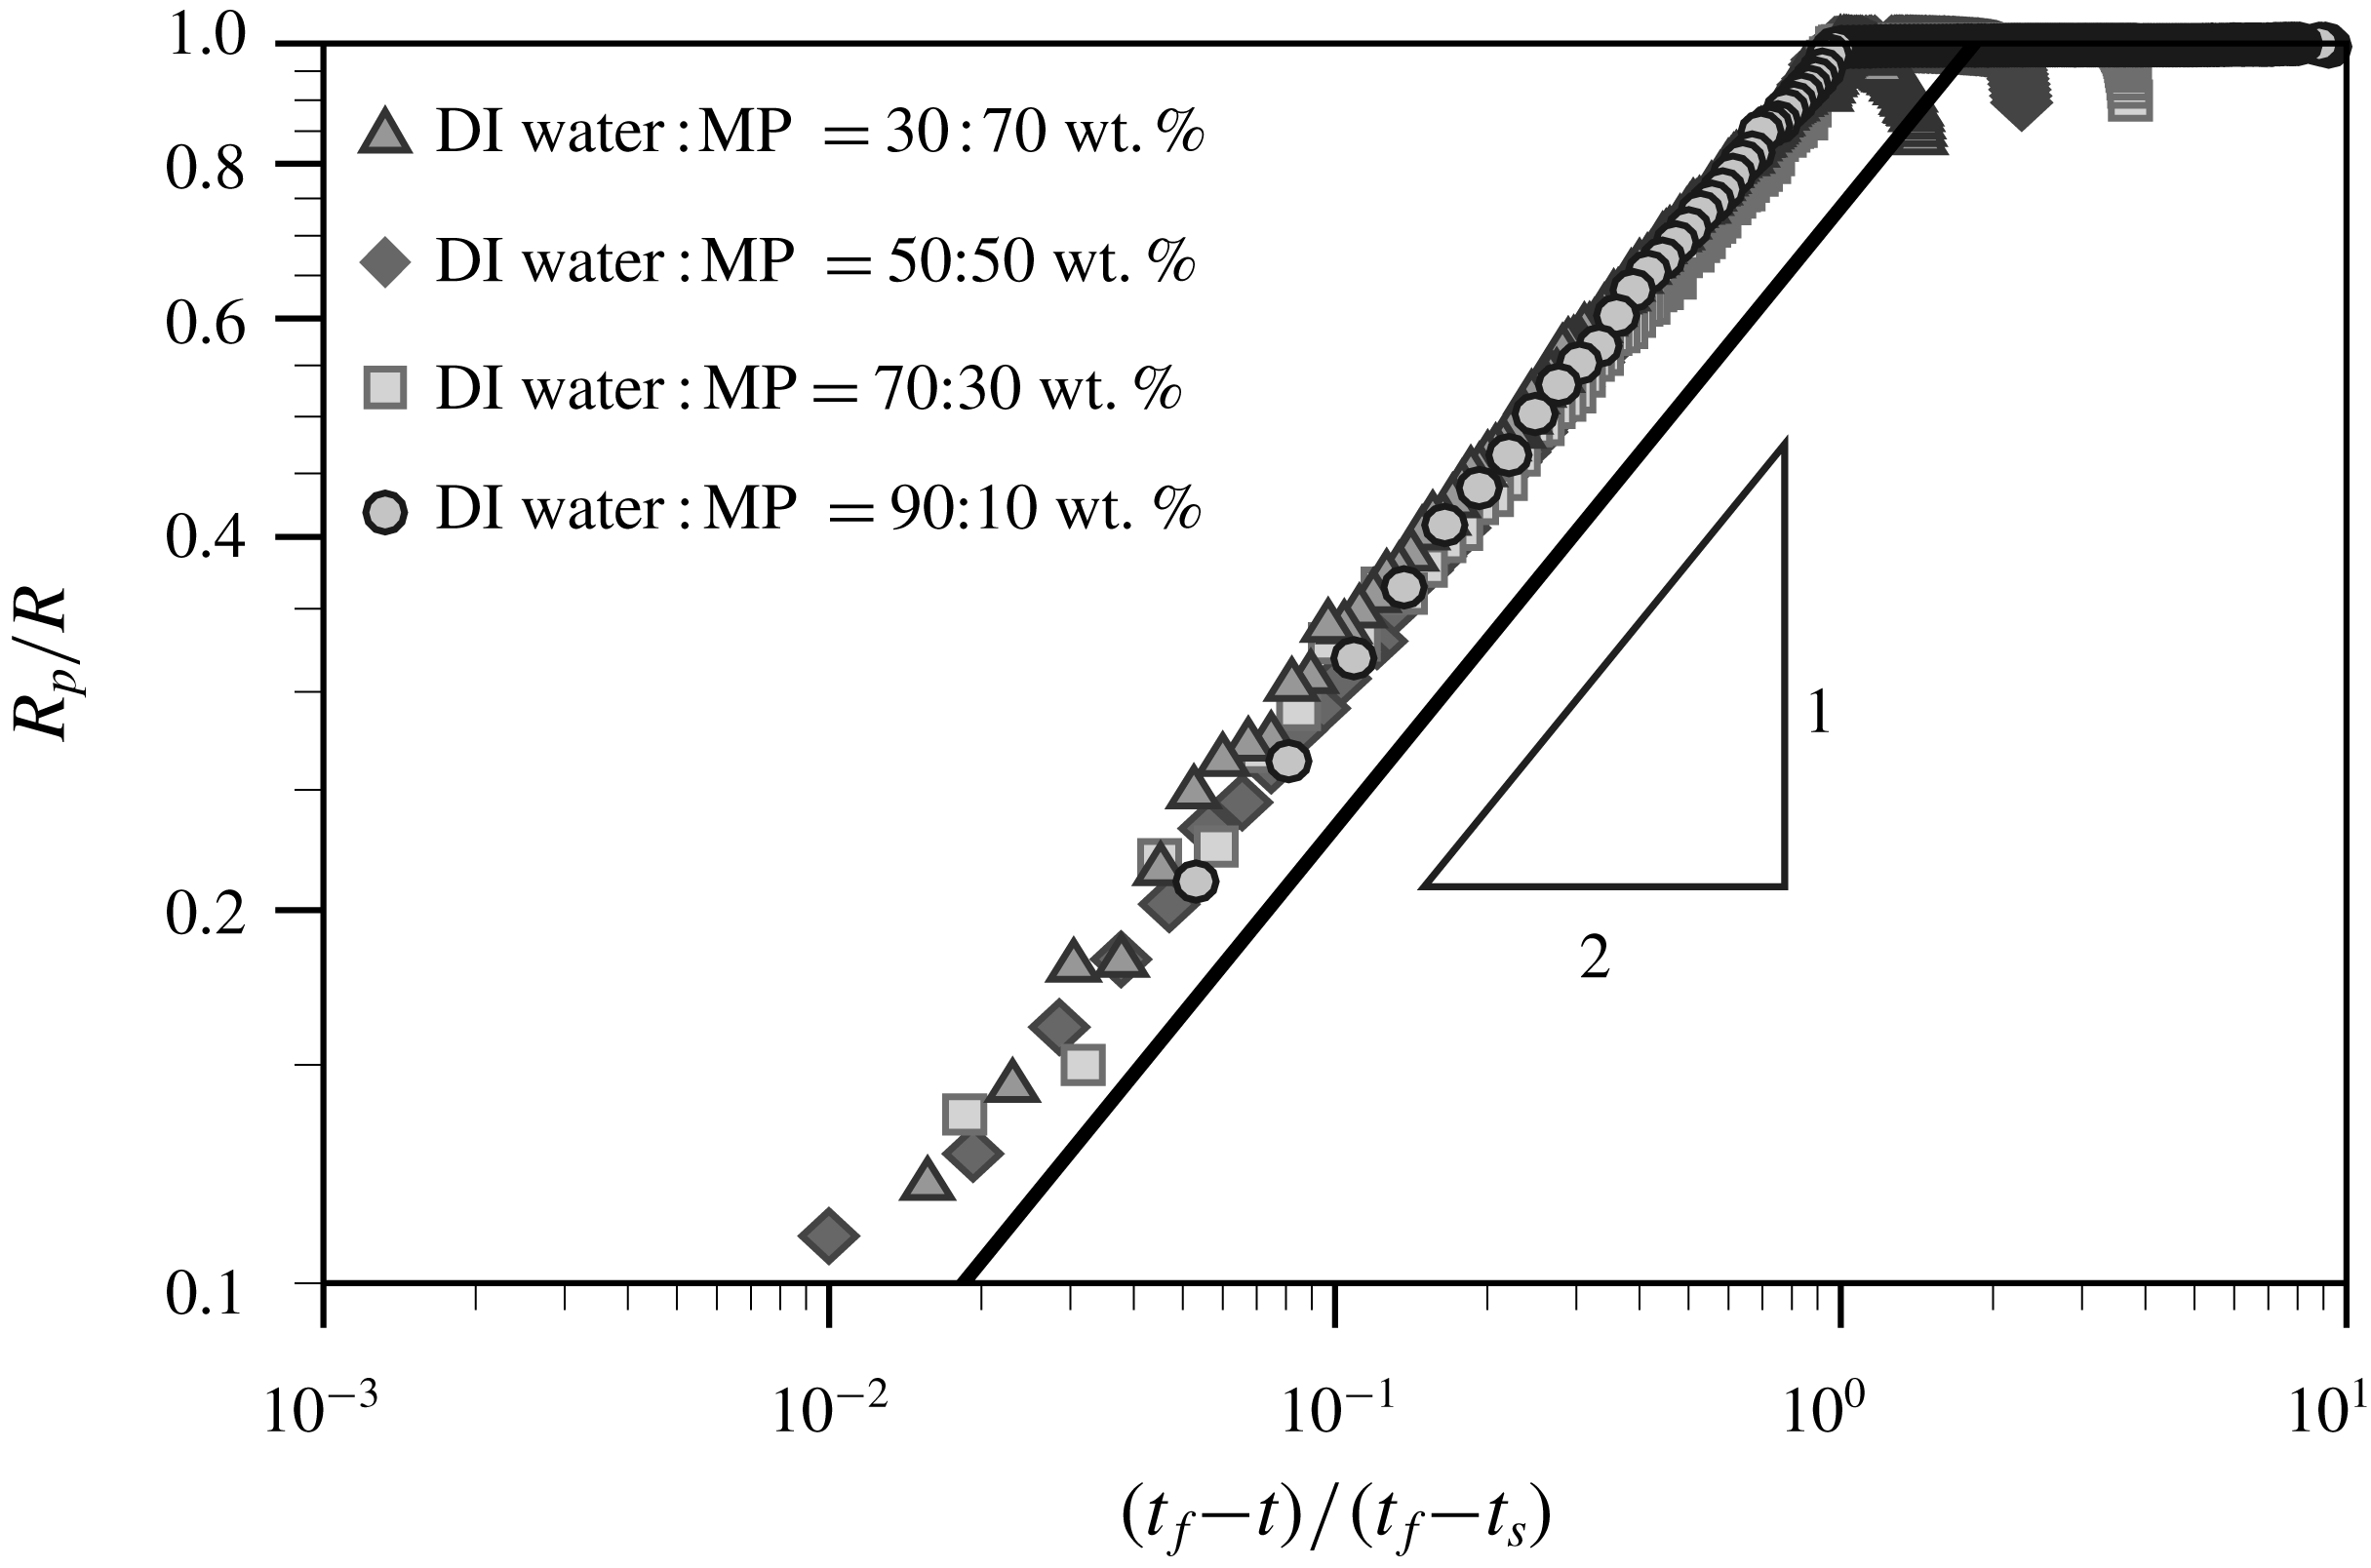
, which represents how the critical local concentration of the solvent (i.e. 90 wt.% 1M2P) evolves in time and space. Thus, we replot the experimental data, as shown in figure 6, where the relative time
 $t_{f}-t$
is normalized with
 $t_{f}-t_{s}$
, where
 $t_{s}$
is the time when the particles begin to disappear from the contact line. All the experimental results are collapsed on top of each other and show a power-law behaviour
 $R_{p}/R\sim [(t_{f}-t)/(t_{f}-t_{s})]^{1/2}$
.
Time evolution of particles distribution from the experimental results, i.e.
 $R_{p}/R$
versus
 $(t_{f}-t)/(t_{f}-t_{s})$
.
 $t_{s}$
is the time when the fluorescent polystyrene particles start to disappear at the contact line. The power-law slope is obtained from (3.6).

To explain this trend, we further simplify the model. During the evaporation regime, while water evaporates, 1M2P mostly remains in the drop due to the large difference in vapour pressure. Then, we assume volume loss is mainly due to the loss of water. Thus, from figure 4(b), we assume that
 $\unicode[STIX]{x1D703}(t)\sim C_{H_{2}O}(t)$
for the early time period where water mainly evaporates. Then, using equation (3.4) we obtain the concentration profile (referring to the weight fraction) in the evaporating droplet
 $$\begin{eqnarray}C_{H_{2}O}(r,t)\sim \left[C_{H_{2}O}(r,0)^{2}-\frac{8D_{va}\unicode[STIX]{x0394}C}{\unicode[STIX]{x03C0}\unicode[STIX]{x1D70C}R^{2}(1-[r/R]^{2})^{3/2}}t\right]^{1/2}.\end{eqnarray}$$
This result is in agreement with the power-law behaviour in figure 6. From this result, we document that the relative evaporation speed of the highly volatile liquid component in the binary mixture droplet can be explained by the diffusion-dominated evaporation process.
4 Conclusions
In this study, we experimentally show how a volatile component in a droplet containing a binary mixture quickly evaporates compared to a relatively less volatile component, which highlights selective evaporation. The liquid mixture consisting of water and 1-Methyl 2-Pyrrolidinone (1M2P) dissolves suspended fluorescent polystyrene particles at a specific concentration (90 wt.% of 1M2P in the mixture). By detecting the fluorescent particle signals, we observe the rate at which the critical local concentration boundary (
 $R_{p}(t)$
) invades the centre of the drop. Independently, and very recently, Li et al. (Reference Li, Lv, Diddens, Tan, Wijshoff, Versluis and Lohse2018) have investigated a similar problem, and they have concluded that the fast evaporation of a relatively more volatile component in a binary mixture droplet leads to chemical segregation, consistent with the results we have documented. Although the two studies have investigated different physical systems using different measurement methods, the selective evaporation observed is similar for both cases.
Additionally, we developed a diffusion-dominated theoretical model to predict the experimental results. Although we simplify the theoretical model by making several assumptions (see detailed assumptions in § 3.2), we show that there is good agreement between experimental results and theory where the diffusion mechanism along the radial direction is dominant (see figure 5
b,c). Then, we find that the time-dependent critical local concentration boundary profile shows a power-law behaviour,
 $R_{p}\sim (t_{f}-t)^{1/2}$
, which is validated by the experimental results.
Flow field measurements of the evaporation of a droplet containing a binary mixture (water : 1M2P – 30 : 70 wt.%). The droplet evaporated under 10 % relative humidity of air. The red-dashed and orange circles indicate the wetted area of the deposited droplet and the boundary of the individual particles, respectively.
 $t_{s}=0$
is defined when the particles begin to disappear. The scale bar is 0.5 mm.

Here, owing to the chosen chemical mixture and the accompanying particle dissolution, we directly show the selective evaporation of a two-component drying droplet. The new visualization idea to use characteristics of the chemical composition to influence suspended particles is expected to provide a better understanding and new strategies for the design of experimental systems of multicomponent liquids that are expected to be useful in a myriad of applications, e.g. bio-engineering applications, food and cosmetic industry, ink-jet or three-dimensional printing of light-emitting diode (LED) devices.
Acknowledgements
We thank J. Nunes, S. Afkhami and S. K. Wilson for helpful discussions and D. Lohse for valuable feedback on the first draft of this paper. H.K. thanks the Settlement Research Funds for newly hired tenure track faculty from KAIST (G04170022).
Supplementary movies
Supplementary movies are available at https://doi.org/10.1017/jfm.2018.472.
Appendix. Particle image velocimetry
To measure the flow field inside the evaporating droplet, we performed particle image velocimetry (PIV) for which
 $1~\unicode[STIX]{x03BC}\text{m}$
carboxylate-modified polystyrene fluorescent particles are seeded into the solution. The Rhodamine-B fluorescent particles were illuminated with a green light source (
 $\unicode[STIX]{x1D706}=520$
nm). The fluorescent signals from the particles (
 $\unicode[STIX]{x1D706}>540$
nm) are recorded using a microscope CCD camera. The focal plane was located at approximately
 $50~\unicode[STIX]{x03BC}\text{m}$
above the substrate where the depth of focus was approximately
 $100~\unicode[STIX]{x03BC}\text{m}$
. For PIV images, we removed the out-of-focus blurred particle images far from the solid substrate by using a high-pass filter and subtracting the background noise. Then, a
 $3\times 3$
Gaussian smoothing was applied to reduce noise of the particle images. This process is necessary to obtain the particle image mainly near the solid substrate (i.e. the focal plane).
The flow field near the substrate was measured using PIV to obtain in-plane velocity vectors. To obtain the velocity vector field, we performed iterative two-dimensional cross-correlations with multiple interrogation window sizes. The first interrogation window used was
 $96\times 96$
pixels with 50 % overlap and then the next interrogation window used was
 $48\times 48$
pixels with 50 % overlap. The velocity vector calculation was performed using an open-source software, PIVlab, which is a time-resolved digital particle image velocimetry tool for MATLAB (Thielicke & Stamhuis Reference Thielicke and Stamhuis2014).
The obtained flow field shows an axisymmetric radial outward velocity profile along the substrate and a radial inward velocity profile along the droplet interface, which is driven by the solutal Marangoni effect. This response is consistent with the preferential evaporation of water in which case the surface tension is lower in the vicinity of the contact line than in the middle of the droplet. The time evolution of flow fields is presented in figure 7.
From the PIV result, we observed the internal flow to be relatively weak and furthermore there is no indication of flow or stirring of the internal concentration distribution during evaporation. Here, the Péclet number is much smaller than unity, i.e.
 $Pe=(h^{2}U)/(DR)\approx 0.01$
, where the droplet height
 $h\leqslant 100~\unicode[STIX]{x03BC}\text{m}$
, the internal flow speed
 $U\leqslant 3~\unicode[STIX]{x03BC}\text{m}~\text{s}^{-1}$
, the diffusion coefficient
 $D\approx 10^{-9}~\text{m}~\text{s}^{-1}$
and the radius of the wetted area
 $R\approx 1$
mm. Thus, in this problem, the evaporation mechanism of the water–1M2P mixture droplet is diffusion dominated.