Do our models of political behavior bear any resemblance to reality? Forecasting elections is one opportunity to assess whether our models of voting behavior are accurate. Over the past few decades, political scientists have been willing to put themselves out there to forecast elections. Explaining a past event allows us the ability to retrofit our models before we make them available to the broader community. In short, forecasting elections provides us the opportunity to develop humility. The forecasting community has done a reasonable job over the past few elections. Aside from 2000, forecasters have been largely accurate. Even in 2000, the forecasting community can claim a modest victory. The community was right about the popular vote winner; it just happened that the popular vote winner lost the election that counts—the Electoral College.
Despite the difficulties in forecasting, it still has a great deal of utility.Footnote 1 Assuming we move beyond the simplistic and silly World Series, the longest name, and tallest candidate rules, we can actually test our hypotheses concerning voting behavior. Moreover, a forecast that is made well in advance of an event presumably has more benefit to those who might make use of the forecast. A forecast a day or two before an event does not offer much insight beyond what we can get from the news the night before the election. The earlier the forecast, the greater the value. Compare a weather forecaster who offers the forecast of a hurricane that will strike in minutes to one who provides the forecast hours or days in advance. Similarly, look at those who forecast the outcome of baseball games. One forecaster waits until the top of the ninth inning. Another forecasts before the start of the game. Which one has done a better job? Which one has provided a more useful service? The forecaster who waits until the last minute has not really provided a service of any utility. We cannot make use of the forecast in our decisions. Simply put, it is not terribly impressive when a forecaster announces the outcome of an election the night before Election Day.
INFLUENCES ON ELECTION OUTCOMES
Several factors influence election outcomes. An impressive and long-standing body of literature argues that voters look to the economy and vote accordingly (Fiorina Reference Fiorina1981; Key Reference Key1966; Lewis-Beck Reference Lewis-Beck1988; Lockerbie Reference Lockerbie2008). Although many of these analyses focus on retrospective evaluations, there is a growing argument within this community that voters are looking to the future as well. Unfortunately, the retrospective item and the prospective item are too highly correlated to include in a single equation, especially with such a small number of cases.Footnote 2 The prospective economic item measured from the average of the responses to the item from the second quarter of the election year is: “Now looking ahead—do you think you (and your family living there) will be better off or worse off financially a year from now, or just about the same as now?” This item is clearly focused on the individual and the future. It does suffer, however, from the problem that there is no attribution of responsibility. The respondents could think that their finances will change because of their own efforts, the actions of their employer, or the actions of the government. Kramer (Reference Kramer1983) and Lockerbie (Reference Lockerbie1992, Reference Lockerbie2008) argue that there should be some sense of attribution to political actors for these items to influence political evaluations and behavior. We can take some solace that the problem with this item makes it less likely to find a relationship. Of course, we should also be aware that this problem might undermine the efficacy of the forecast.
Aside from the economy, we should also consider the length of time the incumbent party has controlled the White House. As Mueller (Reference Mueller1973) has argued, the longer a party has held the White House, the greater the opportunity to upset an increasingly large portion of the electorate. Abramowitz (Reference Abramowitz, Campbell and Garand2000) further argues that regardless of the president's popularity or the state of the economy, there is a desire among the electorate to change the party in power. When a president gets into office, he must make some decisions quickly. Those who had given the president the benefit of the doubt may see their support wane. When the president's tepid supporters peel away, the president's basis of support consists of the hardcore who are more difficult to pull away from the incumbent party. Accordingly, I make use of logged time in the White House for a party as my measure here.Footnote 3
One item I do not include in my equation is presidential approval. Although many scholars include this item as a summary measure of support for the president that takes into account the economy, as well as other areas of performance, I specifically exclude it for two reasons. First, the same factors that lead to the approval of the president also lead to the election or defeat of an incumbent party. One could build a causal model, but heat that might be a bit unwieldy with such a small N. Second, putting presidential approval in the equation is akin to putting a lagged version of the dependent variable on the right-hand side of the equation. It will boost the R-squared, but does it add substantive explanatory power?
PRESIDENTIAL ELECTION RESULTS
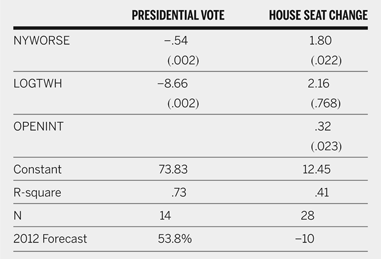
The first equation in table 1 shows the results of a robust regression equation of the incumbent party's share of the two-party vote on the prospective economic item and logged time in the White House.Footnote 4 The high R-squared (.73) demonstrates that the model does a solid job of forecasting presidential election outcomes. The coefficient for the economic item shows that for each percentage point increase in the number of people responding that they expect the next year to be worse for them financially leads to more than a half-point loss for the incumbent president's party. The logged time in the White House similarly works as expected. The longer a party has controlled the White House, the less pleased with it voters tend to be.
Forecasting Equations

The numbers above the parentheses are the robust regression coefficients. The numbers in the parentheses are the two-tailed significance levels. See the appendix for the coding and the values of the independent variables.
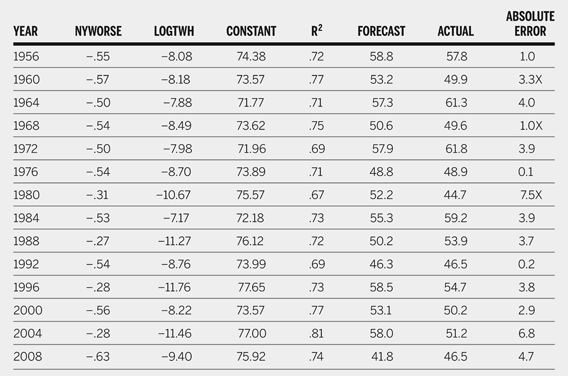
Given the small sample size, it is possible that one case dominates the results. Also, be sure that the event is not used to predict itself. Table 2 shows the out-of-sample forecasting. Each equation is the same as discussed previously, except that the listed year's data are removed from the analysis. The resulting coefficients from the equation generate a prediction for the excluded year.
Out of Sample Forecasting Equations: Presidential Elections

Note: With the exceptions to follow Next Year Worse, everything is significant at the .01 level two-tailed. Next Year Worse is significant at the .08 level one-tailed for 1980 and 1988; significant at the .06 level one-tailed for 1996 and 2004.
The prospective economic item retains its significance. In most years, the economic item is significant at .01, or better. In the years when it is not significant at the conventional levels, it is significant at the .08, one-tailed-level, or better. The out-of-sample forecasts miscall three elections. The equation forecasts a Richard Nixon victory and a Hubert Humphrey victory in 1968. In both cases, the elections were exceptionally close. In 1980, the model is off by more and induces some humility. The equation forecasts the reelection of Jimmy Carter. In fact, he lost. The average absolute forecasting error is 3.34 percentage points.
Looking at 2012, what should we expect? In short, we should see a victory by the incumbent Barack Obama for two reasons. First, the Democrats have only controlled the White House for one term. Second, the American electorate is not terribly pessimistic about their economic future. While the American electorate is not extremely positive, they are not as negative about their economic future as they have been. In 1980, more than a quarter of the electorate were negative. In 2008, just less than a quarter were pessimistic. This year, 2012, only 15% are pessimistic. Putting these two pieces of information into the model yields a forecast of 53.8% for Barack Obama. Given that the election is forecast to be relatively close and taking the size of the errors into account, the chance that the model incorrectly forecast an Obama victory is less than 43%.
US HOUSE ELECTIONS
The US House of Representatives elections can be forecast by applying the same model that we apply to presidential elections (see table 3). In addition to the items we expect to be related to presidential election outcomes, we should take the influence of incumbency into account for the House. In House elections, the incumbent has an amazingly high likelihood of being victorious (Alford and Hibbing Reference Alford and Hibbing1981; Collie Reference Collie1981; Erikson Reference Erikson1972; Ferejohn Reference Ferejohn1977; Fiorina Reference Fiorina1977). Even in 1994, an election year mythologized as an electoral tsunami, more than 90% of the incumbents who sought reelection won reelection. In 2010, more than 85% of the incumbents who sought reelection won reelection. When forecasting seat changes in the House, we can safely assume that most incumbents will win. Most seat pickups will occur in the open seats. Knowing the number of open seats is not enough; we want to know if one party is favored.
Out of Sample Forecasting Equations: House Elections

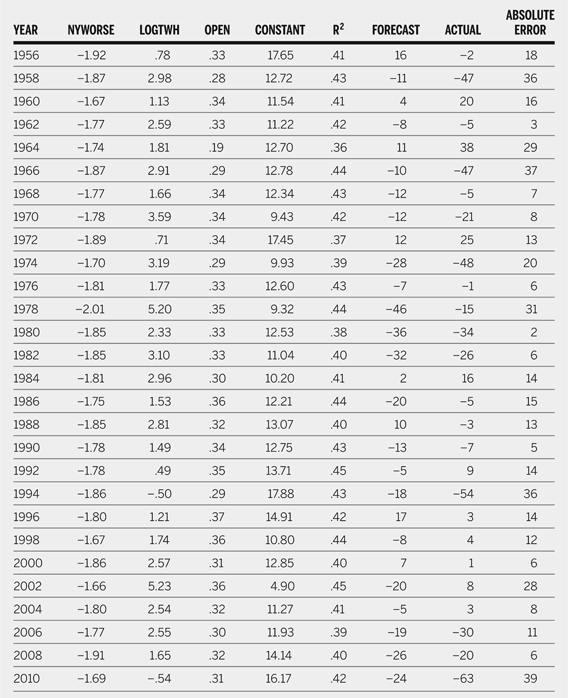
Note: LOGTWH is not significant in any equation. The other items are significant at the .05 level, one-tailed in every equation except for 1964. Here the OPENINT item is significant at .06, one-tailed.
How do we assess whether a year is favorable for one party? Although there are a couple of aberrant cases in recent years, we can safely say that midterm elections tend to be bad for the incumbent president's party. On-year contests are a bit more problematic. We cannot simply say the on-year presidential races were good for the victor's party. If for no other reason, we do not know the victor until after the race. Consequently, we cannot use that information in the forecast. We want information that is available well before the election. We can use reelection information, such as whether people overwhelmingly forecast one party to be victorious. To take into account whether an on-year race is good for one party, we can simply observe whether a tremendously large share (60%+) of the electorate forecast a victory for one party. If so, it is a good year for that party. If more than 60% forecast a victory for the incumbent party, the number of open seats is the score for the variable. If more than 60% forecast a victory for the opposition party, the number of open seats is multiplied by −1. If the percentage is less than 60, the item is scored 0.
How well does the modified presidential model do with House elections? Looking back at table 1, we see that it does reasonably well. As with the presidential model, the prospective economic item is significant. For every percentage point increase in the number of people who are negative about the future, the president's party loses just less than 2 seats in the House of Representatives. Unlike the presidential model, the time the incumbent party has controlled the White House is not related to the change in the number of House seats. The item is not close to statistical significance, and it is in the opposite direction of what one would expect. The open-seat item is powerful. If it is a bad (good) year for the incumbent, every three open seats will lead to a one-seat loss (pick-up) for the incumbent party. How good a job does the equation do in forecasting House elections? The R-squared of .41 is respectable, but not as high as that for the presidential election equation.
As with the presidential forecasting equations, it is important to examine the out-of-sample equations to evaluate the model. Here, the prospective economic item is significant at the .05 level in every equation. The logged time in the White House is still amazingly insignificant; in no equation does it approach statistical significance. The open-seat item is significant in every equation except the one that excludes 1964. The average absolute value of the forecasting errors is 14.6. Overall, the House equation does a good job, but not quite as good as the presidential equation.
What does the model forecast for the 2012 House elections? Taking the values of the independent variables (open-seat is scored 0, as there is no overwhelming forecast of the presidential election) into account, the model forecasts the Democratic Party will lose 10 seats.
CONCLUSION
This and other forecasts shows that presidential and House elections are predictable events. Moreover, these can be forecast well in advance of the election, as these forecasts were generated on June 29. With relatively few variables, we can forecast elections with reasonable accuracy. Individual-level models of voting behavior find support in these analyses. The evidence across the equations shows that the economic expectations are related to presidential and House elections.
APPENDIX
Independent Variables for Presidential and House Elections