1. Introduction
Rural households in developing countries continuously face weather-related risks with potentially strong effects on agricultural output (Mendelsohn et al., Reference Mendelsohn, Basist, Kurukulasuriya and Dinar2007; Nepstad et al., Reference Nepstad, Stickler, Soares-Filho and Merry2008). In smallholder-dominated rural landscapes, households may derive about two-thirds of their incomes directly from living resources, either cultivated or from the wild, including agriculture and livestock, and from foraging natural forests and other wildlands. The latter share of environmental incomes in total household income – for subsistence or cash – may in forested tropical and subtropical landscapes be comparable to that of crops (Angelsen et al., Reference Angelsen, Jagger, Babigumira, Belcher, Hogarth, Bauch, Börner, Smith-Hall and Wunder2014).
Climate change with increasing weather fluctuations will also predictably increase risks to poor rural livelihoods over time – especially for those depending heavily on natural resources (Hallegatte et al., Reference Hallegatte, Bangalore, Bonzanigo, Fay, Kane, Narloch, Rozenberg, Treguer and Vogt-Schilb2016).Footnote 1 Ecosystems may become permanently altered, with systemic impacts such as changed water availability. Weather events such as heavy rains, storms or droughts could permanently shrink the natural resource base, for example through accelerated soil erosion (Porter et al., Reference Porter, Xie, Challinor, Cochrane, Howden, Iqbal, Lobell, Travasso, Field, Barros, Dokken, Mach, Mastrandrea and White2014). Seasonal variations could also become more unpredictable, thus increasing the risk of crop harvest failures. Both agricultural and forest-based production systems will be affected, depending on their site-specific capacity to adapt to the new conditions.
In agriculture, the expected climatic changes with warmer future temperatures, changing rainfall patterns, and increased frequency and/or severity of extreme weather events are all forecasted to reduced average crop yield but increase yield variability, threatening global food security (Wheeler and von Braun, Reference Wheeler and von Braun2013). While in colder and temperate climates, higher temperature combined with the fertilizing effects of higher atmospheric CO2 concentrations can cause net increases in crop production (Rosenzweig and Parry, Reference Rosenzweig and Parry1994), the predicted impacts across tropical and subtropical crops are almost invariably negative (Thornton and Cramer, Reference Thornton and Cramer2012). Beyond of the direct effects on agricultural output, climate change may also increase price volatility in low-income countries (Haile et al., Reference Haile, Wossen, Tesfaye and von Braun2017). Rural incomes, investments, and development trajectories would directly and indirectly suffer (Nelson et al., Reference Nelson, Rosegrant, Palazzo, Gray, Ingersoll, Robertson, Tokgoz, Zhu, Sulser, Ringler, Msangi and You2010).
Forests and their livelihood contributions tend to be more resilient than specialized cropping systems, but are also far from immune to climate change (Locatelli et al., Reference Locatelli, Kanninen, Brockhaus, Colfer, Murdiyarso and Santoso2008). Droughts, wildfires, flooding or pests can potentially not only diminish the returns to forest-extractive activities, but also eventually threaten forest integrity. This, in turn, would reduce the adaptive functions forests can perform in landscape, regions, and continents. For instance, if Amazon forests were to dry up beyond a tipping point, large-scale die-back and ‘savannization’ could occur, especially in the eastern parts and along forest edges, potentially causing significant climatic changes across the Americas (Malhi et al., Reference Malhi, Roberts, Betts, Killeen, Li and Nobre2008; Nepstad et al., Reference Nepstad, Stickler, Soares-Filho and Merry2008). Recent El Niño–Southern Oscillation (ENSO) induced events have already raised the frequency of tropical forest fires (Locatelli et al., Reference Locatelli, Kanninen, Brockhaus, Colfer, Murdiyarso and Santoso2008). Strongly modified and/or degraded forests are less resilient to climate change than near-natural, biodiversity-rich forests (Thompson et al., Reference Thompson, Mackey, McNulty and Mosseler2009). The Amazon and other tropical forests have served as important long-term net carbon sinks (Schimel et al., Reference Schimel, Stephens and Fisher2015), but this vital climate-change mitigation function may be declining (Brienen et al., Reference Brienen, Phillips and Feldpausch2015).
In sum, natural resource-dependent sectors and income sources are thus both sizeable and directly susceptible to changes in temperature or precipitation, including their variability. Nevertheless, the degree of climate and weather resilience predictably varies widely across our two income-generating sectors, agriculture and forestry. Two distinguishing factors are particularly relevant: the greater resilience of diverse ecosystems such as natural forests, and the stock versus flow dependency of the two sectors.
First, diverse ecosystems are generally more resilient to weather shocks than less diverse ones (Thompson et al., Reference Thompson, Mackey, McNulty and Mosseler2009; Isbell et al., Reference Isbell, Craven, Connolly, Loreau, Schmid, Beierkuhnlein and Ebeling2015). Natural forests in particular are among the most diverse ecosystems in the world (MEA, 2005). Hence, we can also expect environmental incomes to be more climate- and weather-resistant than cropping incomes (Nøstbakken and Conrad, Reference Nøstbakken, Conrad, Weintraub, Romero, Bjørndal and Epstein2007). A diverse set of species allows forests to exist in a wide variety of climatic conditions. We therefore suggest that, on a cross-sectional gradient, forest extraction should provide relatively higher, and crop production relatively lower, incomes in extreme climates. Furthermore, in response to weather shocks, incomes from biologically diverse forests are likely to be less at risk than incomes from a monoculture cropping system.
Second, rural households in developing countries typically use assets such as savings and livestock to cope with negative income shocks (Deaton, Reference Deaton1989; Rosenzweig and Parry, Reference Rosenzweig and Parry1994). Households can sell these assets when facing income shortfalls to smooth consumption (Wunder et al., Reference Wunder, Börner, Shively and Wyman2014b). Here, we argue that forests partially can have a similar role for income smoothing. In contrast to crop production that is mainly based on annual biomass growth, most forest products such as timber and firewood rely on biomass growing over multiple years.Footnote 2 For those, fluctuations in annual biomass growth therefore tend to average out over the years. We thus expect forest extraction on average to be more resistant to weather shocks than crop production.Footnote 3
Bearing in mind these two differences, we scrutinize to what extent rural households use forests to compensate for weather-related income shocks, and how crops versus forest incomes change relatively along the climate gradients. To answer these questions, we use a unique data set of around 8,000 rural households from across the tropics and subtropics, with a large spatial coverage, and detailed information about income sources. This socioeconomic data, combined with gridded temperature and precipitation data, allows us to estimate the impact of weather and climates on forest and crop incomes. In the estimation, we allow the impact of weather shocks on income to vary with the baseline climate. For example, our specification takes into account that a warm year in a cool climate may benefit crop yield while in hot climates it may harm crops.
Our study relates to the body of literature estimating the impact of weather and climate on agricultural production (e.g., Mendelsohn et al., Reference Mendelsohn, Nordhaus and Shaw1994, Reference Mendelsohn, Basist, Kurukulasuriya and Dinar2007; Kurukulasuriya et al., Reference Kurukulasuriya, Mendelsohn, Hassan, Benhin, Deressa, Diop, Eid, Fosu, Gbetibouo, Jain, Mahamadou, Mano, Kabubo-Mariara, El-Marsafawy, Molua, Ouda, Ouedraogo, Séne, Maddison, Seo and Dinar2006; Deschênes and Greenstone, Reference Deschênes and Greenstone2007; Dell et al., Reference Dell, Jones and Olken2012; Burke and Emerick, Reference Burke and Emerick2016). However we feature particularly the reallocation of factors across sectors, comparable to, for example, Colmer (Reference Colmer2017) and Emerick (Reference Emerick2016), who consider the impact of agricultural shocks on manufacturing in India. Our research complements these studies by focusing on extractive natural resources in coping with climate shocks.Footnote 4
The remainder of this paper is organized as follows. Section 2 outlines our conceptual framework on both the ecological and the household economics side. Section 3 describes the socioeconomic and climate data that we are to combine, while section 4 gives the descriptive statistics. Section 5 outlines the empirical estimation strategy for the econometrics, followed by the multivariate regressions results in section 6. We conclude and discuss in section 7.
2. Conceptual framework
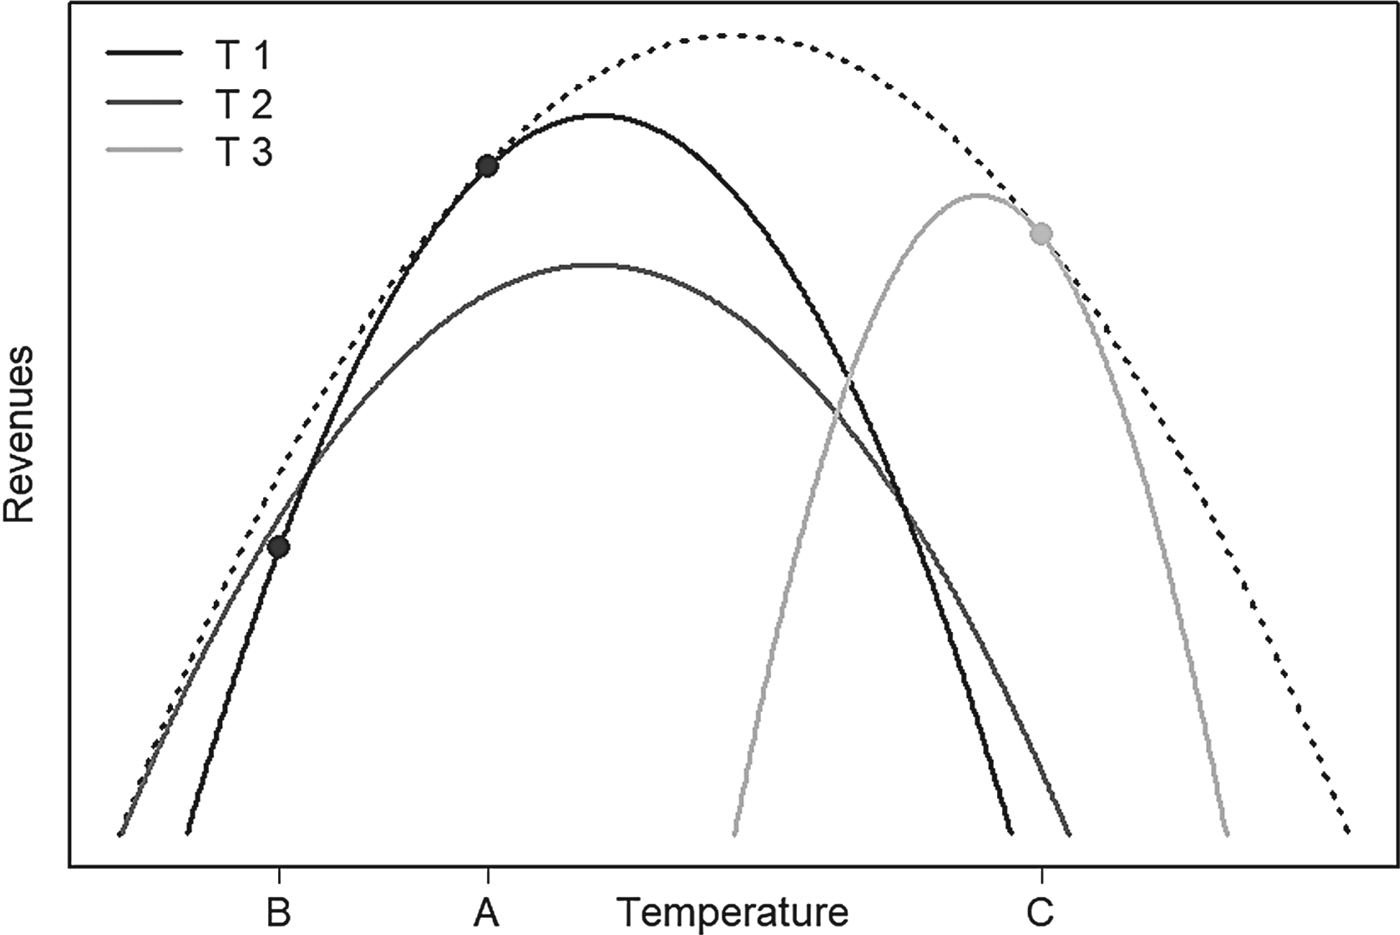
In this section, we describe our theoretical framework, which is then used to derive testable predictions and to develop our empirical specifications. Consider a rural household making production choices based on weather expectations or climate and weather realizations. Building on Mendelsohn et al. (Reference Mendelsohn, Nordhaus and Shaw1994), we consider the technology choice of rural households to depend on the long-term climate, but differ conceptually by assuming that households can reallocate some production factors after having observed weather realizations. We therefore not only consider expected temperature and precipitation levels as climate variables, but also observed deviations from the expected levels to understand household responses. Following Burke et al. (Reference Burke, Hsiang and Miguel2015), we assume that the global production frontier, defined as the maximum attainable profits for a given climate and an optimal technology choice, is concave and has an interior maximum. We further assume that the same holds true for all individual production technologies. Profit-maximizing households choose technologies that are tangential to the global production frontier. From these assumptions it follows that production technologies are tangential to the left of their individual maxima in areas below the maximum of the global production frontier, and to the right in areas above the maximum of the global production frontier (see figure 1). Hence, a weather shock that moves the weather closer to the global optimum, such as a warm year in cold climates or a cold year in warm climates, will always increase profits for profit-maximizing households.
Global production frontier (dotted line) and production frontiers for technologies T1, T2, T3 (black, dark grey and light grey line, respectively) in dependence of temperature levels.

Production technologies not only differ in their maxima with respect to temperature and precipitation, but also in their sensitivity to variations in weather and climate. Forests may be more resilient to climate variations than crops, yielding positive revenues for a larger range of temperature and precipitation levels. Less climate-sensitive production technologies may therefore gain comparative advantage in extreme climates and after large weather shocks. Figure 1 illustrates this stylized relationship between rural production and climate, using temperature as an illustrative example. The dotted black line demarcates the global production frontier for an infinite number of production technologies; a smaller selected set T1, T2, T3 (e.g., wheat, forest, livestock) is shown by the black, dark grey and light grey lines, respectively.
Consider now a region with temperatures below the global optimum. This region is represented by the mean temperature A in figure 1. For the mean temperature level A, technology T1 (e.g., wheat) yields the highest returns. A negative temperature anomaly curbing temperature to the level B reduces the output from technology T1. The technology T2 (e.g., forest), is less temperature-sensitive, and yields higher returns for the realized temperature level B. A factor reallocation from technology T1 to technology T2 would increase revenues for the temperature realization level B. At the same time, a small temperature increase from temperature level A would increase the yields of T1. However, for higher temperatures T1 may lose comparative advantage, and the household may want to reallocate production factors to more heat-tolerant technologies. To the right of the global production maximum at a mean temperature level C, T3 (e.g., livestock) maximizes the expected revenues and households prefer T3 over T1. For all temperature levels above the global maximum, such as level C, the responses of yields and factor reallocations to weather anomalies are reversed, compared to the temperature levels below the global optimum.
So far, we have discussed the relation between yields, technology choices, climate and weather realizations for risk-neutral households and the single technology case. In reality, risk-averse households may invest in portfolios of technologies. The same reasoning for single technologies also applies to portfolios of production technologies within their common support.Footnote 5 First, more climate robust technologies gain comparative advantage in extreme climates and under weather anomalies that move the weather further from the global optimum. For example, crops yield expectedly higher incomes in intermediate climatic conditions, where they would dominate. Forest incomes would be more resistant to climate extremes and weather anomalies, due to their larger species diversity, and harvestable accumulated biomass stocks. Forest extraction thus gains comparative advantage over crop income in extreme climates, and under weather anomalies that increase the distance of weather from the global optimum.
Second, the impact of weather anomalies on revenues depends on the baseline climate. For example, positive temperature deviations have positive impacts revenues in areas with expected temperatures below the global temperature optimum, and negative impacts on revenues in climates above the temperature optimum. We will test these predictions in the following sections.
3. Data
3.1 Household income and socioeconomic conditions
Our income data draw on the pan-tropical Poverty and Environment Network (PEN) database, from the Center for International Forestry Research (CIFOR) (http://www1.cifor.org/pen/). Data gathered covered 24 countries, spread over Sub-Saharan Africa, Asia, and Latin America, with 59 sites, 334 villages, and more than 8,000 households. The PEN sample can be regarded as representative of rural smallholders in developing countries with decent access to forests (Angelsen et al., Reference Angelsen, Jagger, Babigumira, Belcher, Hogarth, Bauch, Börner, Smith-Hall and Wunder2014; Wunder et al., Reference Wunder, Angelsen and Belcher2014a).Footnote 6
Notably, PEN data collection featured four quarterly income surveys, enabling short recall periods (1–3 months) and analysis of seasonal income patterns. Household adult equivalent units (AEU) enabled adequate welfare comparisons across households, with different compositions of productive earners versus non-earners, and size-dependent economies of scale in the per-capita provision of intra-household services.Footnote 7 All incomes are transformed to US dollar (US$) purchasing power parity (PPP) rates of the survey year.Footnote 8
Environmental income is defined as incomes from the harvesting of resources provided through natural processes, not requiring intensive management. It includes income from natural forests (forest environmental income) and non-forest wildlands such as grass-, bush- and wetlands, fallows, but also wild plants and animals harvested from croplands (non-forest environmental income). Forests are defined as by FAO (2000), and all forest income but plantation income is environmental income. On average, the households in the PEN sample generate 27.5 per cent of their income from environmental resources (Angelsen et al., Reference Angelsen, Jagger, Babigumira, Belcher, Hogarth, Bauch, Börner, Smith-Hall and Wunder2014).
Correspondingly, crops refer to production values generated with intensive management efforts. Obviously, some borderline cases exist. Agroforestry, including silvipasture, is defined as agriculture, following FAO definitions (FAO, 2000).
3.2 Climate data and contextual variables
To relate these household data to climatic conditions, we use the gridded climate data of the Climate Research Unit of the University of East Anglia (CRU TS3.21). The CRU data contain monthly time series of temperature, precipitation and other climate variables spanning from 1901 to 2012, and global coverage with 0.5 × 0.5 degree resolution, based on analysis of over 4,000 individual weather station records (Harris et al., Reference Harris, Jones, Osborn and Lister2014). Many of the more remote sites do not have close-by weather station data; linear extrapolations are used. We compute village-level climate and weather data using linear interpolations from surrounding grid cells. Interpolations may not always be precise, but the data are commonly used in economic studies (Auffhammer et al., Reference Auffhammer, Hsiang, Schlenker and Sobel2013; Dell et al., Reference Dell, Jones and Olken2014).
We use annual means of precipitation and temperatures for the reference period (1981–2010). We chose the ending year so as to coincide with the last year of PEN data collection. Our squared climate terms account for nonlinear responses of income to climate fluctuations (Mendelsohn et al., Reference Mendelsohn, Nordhaus and Shaw1994, Reference Mendelsohn, Basist, Kurukulasuriya and Dinar2007; Kurukulasuriya et al., Reference Kurukulasuriya, Mendelsohn, Hassan, Benhin, Deressa, Diop, Eid, Fosu, Gbetibouo, Jain, Mahamadou, Mano, Kabubo-Mariara, El-Marsafawy, Molua, Ouda, Ouedraogo, Séne, Maddison, Seo and Dinar2006). Temperature anomalies were calculated using the mean temperature of the survey year (temp_survey) minus the average temperature of the reference period (temp_mean), dividing the difference by the standard deviation (SD) of temperature in the reference period (temp_sd) (e.g., Lobell et al., Reference Lobell, Schlenker and Costa-Roberts2011), as shown in equation (1):
 $$\hbox{temp}\_\hbox{anomaly} = \displaystyle{{\hbox{temp}\_\hbox{survey}-\hbox{temp}\_\hbox{mean}}\over{\hbox{temp}\_\hbox{sd}}}.$$
By dividing the deviation by the SD, we obtain a relative anomaly indicator, i.e., relative to the historical fluctuations in temperature in the area. The precipitation anomalies are calculated correspondingly. We define the survey year as the year that starts with the surveyed period.Footnote 9 In contrast to Mendelsohn et al. (Reference Mendelsohn, Nordhaus and Shaw1994), using seasonal climate variables, we use annual climate variables, since the timing of the cropping seasons may vary greatly between sites located across the tropics and subtropics, many of which have year-round crop production.
We employed other contextual variables to control for their impacts on agricultural returns and other income-generating processes. Soil data are from the Harmonized World Soil Database v. 1.2 (Nachtergaele et al., Reference Nachtergaele, van Velthuizen, Verelst, Batjes, Dijkshoorn, van Engelen and Prieler2008). Distance to the nearest city, as indicator of market remoteness, was calculated from ESRI's 2008 world cities shape file (http://www.baruch.cuny.edu/geoportal/data/esri/esri_intl.htm). Similarly, for distance to major roads, we used the world data on major roads shape file available online (http://www.vdstech.com/world-data.aspx). The distance in km refers to both secondary and primary roads in the datasets.Footnote 10
4. Descriptive statistics
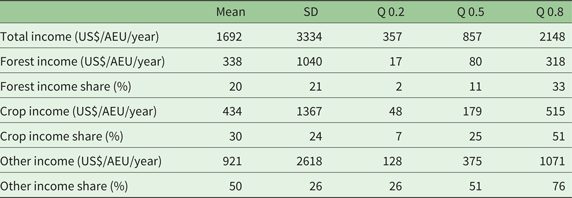
In this section, we summarize both the income and climate data. Table 1 shows the mean, standard deviation (SD), the lowest (Q20), median (Q50) and the highest quintile (Q80) of sector and total income – all in 2005 US$ PPP per AEU/year. The mean income in our sample is US$1,692; the median is US$857. More than one-fifth of our sample households earn less than US$1 per day and per AEU. The mean forest income share is 20 per cent, while the median share is 11 per cent, implying a fairly skewed forest income distribution. However, high forest income shares are associated with low absolute household income; thus forest income (and environmental income more generally) reduces overall income inequality (Angelsen et al., Reference Angelsen, Jagger, Babigumira, Belcher, Hogarth, Bauch, Börner, Smith-Hall and Wunder2014).Footnote 11 For comparison, the mean and median crop income shares are 30 per cent and 25 per cent, respectively.
Income summary

Source: PEN data.
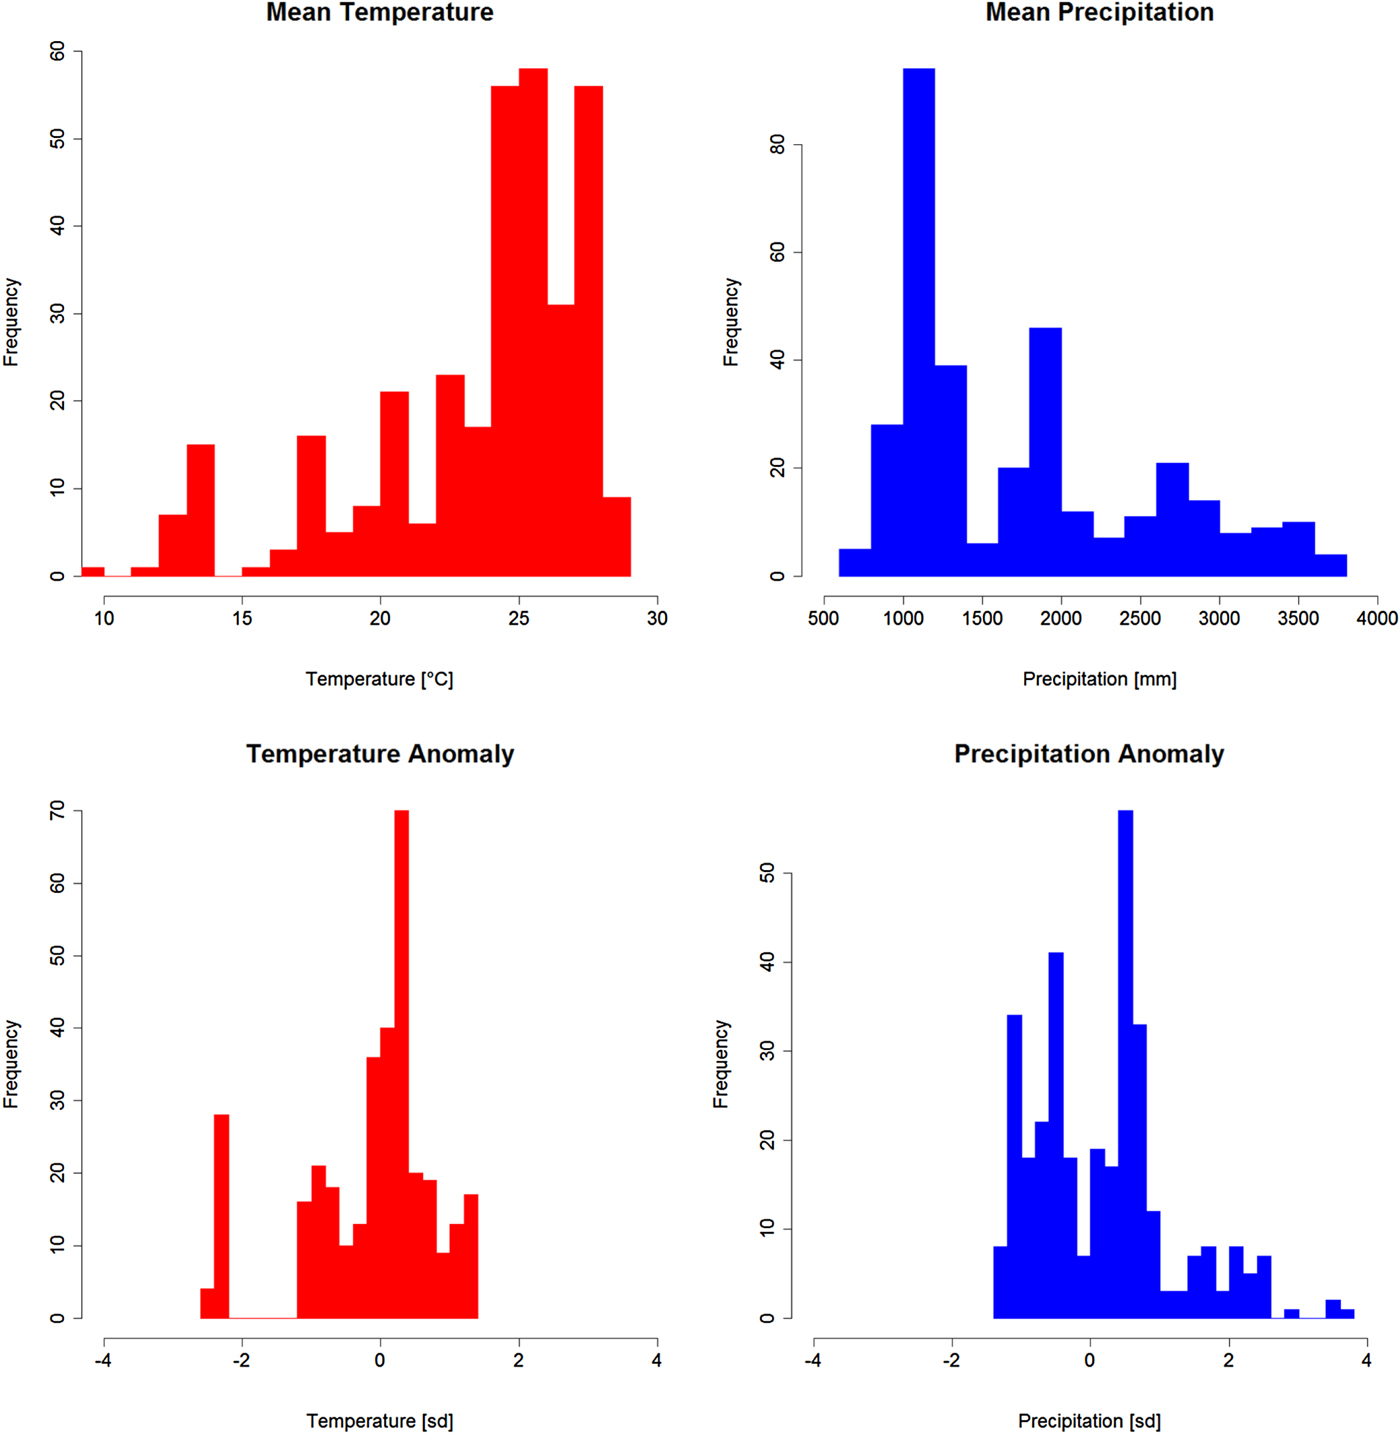
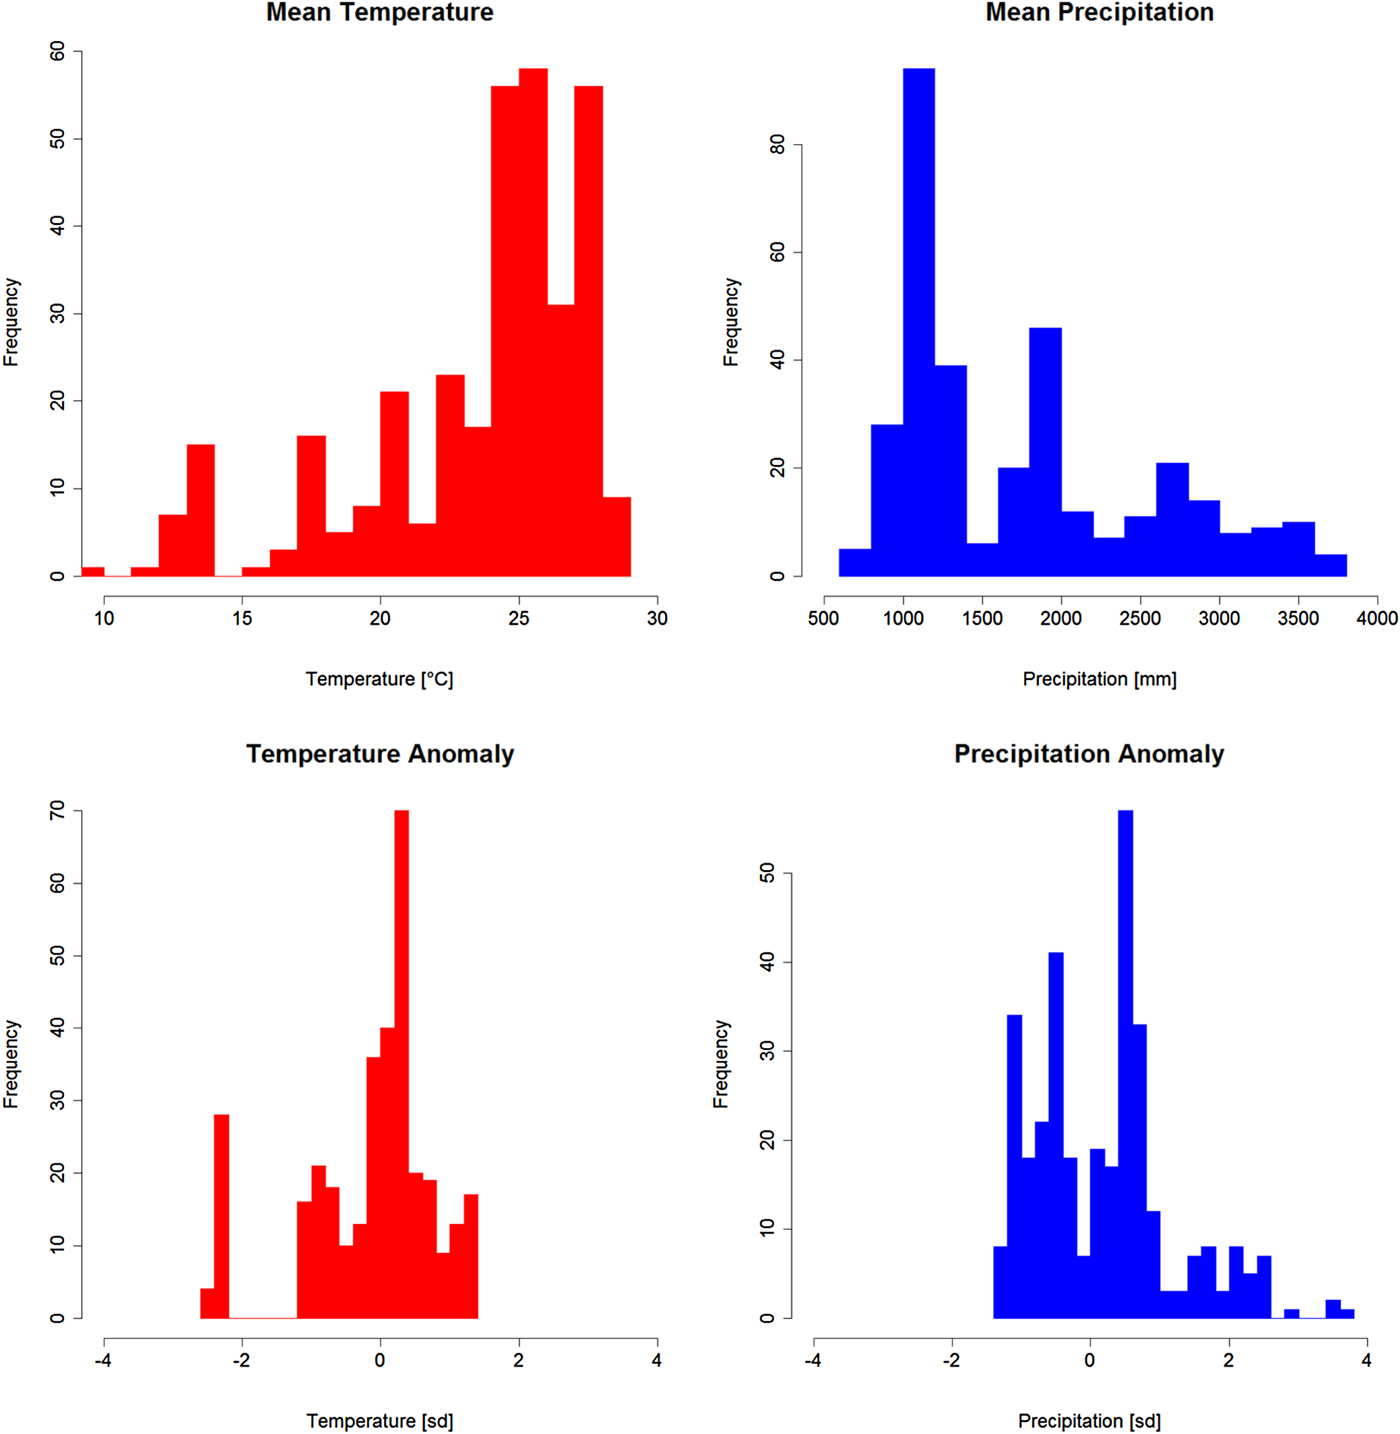
Figure 2a–d shows the distribution of climate and weather in our sample villages. The mean annual temperature of sites (top left panel) ranges between 9 and 30°C, and the distribution is right-skewed: most sites are hot, yet the average is pulled down by some low-temperature locations at high elevations (mostly >2,000 m.a.s.l.). Precipitation ranges (top right panel) are between 500 and 4,000 mm, and the distribution is left-skewed: more sites have low mean rainfall, yet a long right-hand side tail of high-precipitation sites increases the mean. Most temperature (bottom left panel) and precipitation anomalies are smaller than 2 SD, yet exceptions exist especially for precipitation (bottom right panel).
Distribution of climate means (top panels) and weather anomalies (bottom panels) in the sample villages.
5. Estimation strategy
This section presents our regression framework for estimating the impact of climate and weather anomalies on forest, crop and total income, using cross-sectional data. Our approach rests on the assumption that no omitted variables bias the estimates. The standardization of weather anomalies roughly equalizes their probability of occurrence across space. The occurrence of weather anomalies may therefore be treated as random. Climate may be correlated with historic events that have shaped current economic environments of geographical regions. We therefore only use climatic variations within regions to estimate the effects of climate on rural production.
Based on the discussion in the previous section, we include climate variables as second-order polynomials to account for nonlinear responses of income to climate (see also, for example, Mendelsohn et al., Reference Mendelsohn, Nordhaus and Shaw1994). As described in our conceptual framework, we also allow the impact of weather anomalies to differ depending on the baseline climate by interacting the weather anomalies with the climate means. We estimate the following regression equation:
 $$\matrix{ {y_{ijk}} \hfill & { = \alpha _1T_{jk} + \alpha _2T_{jk}^2 + \alpha _3P_{jk} + \alpha _4P_{jk}^2 + \alpha _5Ap_{jk} + \alpha _6Ap_{jk} \times P_{jk} + \alpha _7At_{jk} + \alpha _8At_{jk}} \hfill \cr {} \hfill & {\quad \times T_{jk} + X_{jk} + \gamma _k + \varepsilon _{ijk},} \hfill \cr } $$
where y ij is the sector income of household i in village j in World Bank region k; T jk is the 30 year average temperature level of village j; P jk is the 30 year average precipitation level; Ap jk denotes precipitation anomalies and At jk temperature anomalies; and X jk are village-level controls including soil types,Footnote 12 distance to nearest road, distance to nearest city, and elevation. World Bank regions' fixed effects are denoted by γk, while εij denotes the error term. We cluster the standard errors on village level as most explanatory variables are measured at this level and errors within villages may therefore be correlated.Footnote 13
The dependent variables – forest, crop, and total income – were inverse hyperbolic sine (ihs) transformed, to account for the log-normal distribution of incomes and zeros in sector incomes (Burbidge et al., Reference Burbidge, Magee and Robb1988). The interpretation of the coefficients as semi-elasticities is similar to regressions with log-transformed dependent variables.
Parameters α1 to α4 measure the impacts of climate on sector incomes, given household optimization with respect to expected weather or climate. Parameters α5 to α8 measure the impact of weather shocks on incomes for given production technologies (set of crop types, forest composition, etc.). An interior climate optimum for production implies that α1 > 0, α2 < 0, α3 > 0, and α4 < 0, so that the production frontier becomes inverted U-shaped in the two-dimensional temperature-precipitation space. The predictions from our theoretical framework are further that the marginal impact of a positive weather shock on production declines with the mean temperature and precipitation levels, i.e., that α5 > 0, α6 < 0, α7 > 0 and α8 < 0. Such a parameter combination implies that a wet year increases production in dry climates, but reduces production in wet climates, and vice versa.
We have further argued that forest extraction is less affected by climate anomalies than crop production. If households, as a coping response to the weather shock, allocate more labor and other production factors to the less declining, more stable forest sector, the impact on absolute forest income becomes indeterminate. However, in relative terms we would expect forest income to increase when crop incomes decline, so we would see opposite signs on α5 to α8 for the temperature and precipitation shocks. Further, if crop income has a comparative advantage in intermediate climates while forest production is more robust with respect to climate extremes, we would expect that forest incomes increase towards the climate extremes relative to crop incomes. Again, the absolute effect of climate on forest income is undetermined as the effect of increasing comparative advantage may be opposite to the direct effect of climates on forest production.
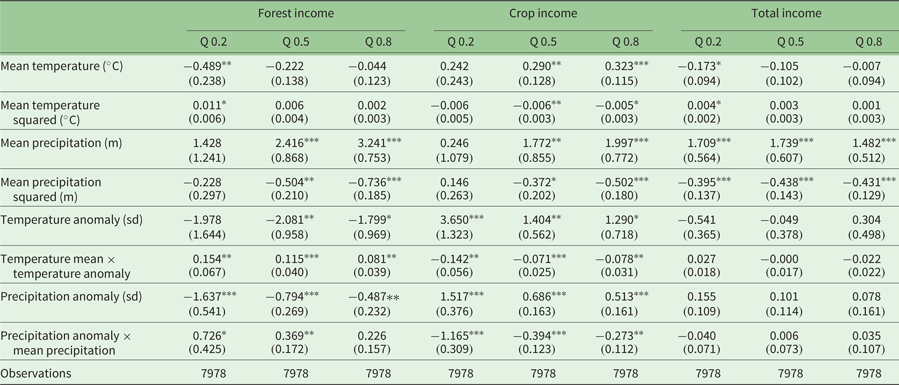
Climate and weather shocks may affect poor and rich households differently. We therefore estimate the impact of weather and climate on income quantiles using quantile regressions.Footnote 14 Again, we cluster the standard errors on village level to account for the correlation of error terms.
6. Regression results
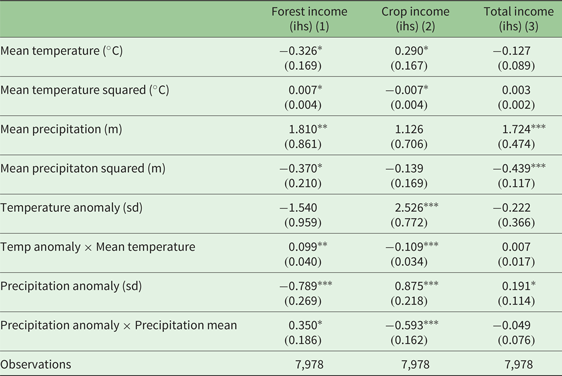
The results from the baseline regressions are presented in table 2, with the absolute sectoral (forest, crops) and total incomes as dependent variables. The parameter estimates for the climate variables (first four lines) confirm our expectations from section 2: crop income proves to have an interior temperature optimum, estimated at 20.7°C.Footnote 15 Conversely, we note that absolute forest income increases towards the temperature extremes: a negative coefficient is estimated for the linear, and a positive coefficient for the squared term, with the minimum forest income occurring at around 23°C. Forest income has the opposite and bell-shaped pattern with respect to precipitation, peaking at around 2,500 mm. For crop income, both precipitation coefficients are insignificant. Total income is bell-shaped in precipitation, and estimated to have an interior peak at about 2,000 mm, while the temperature coefficients are insignificant.
Climate and weather impacts on household incomes. OLS regression

Notes: Regression specification includes soil characteristics, infrastructure variables, elevation, and region-fixed effects as controls. Standard errors are clustered at the village level. ***Significant at 1% level, **significant at 5% level, *significant at 10% level.
The results for temperatures suggest that crop and forest incomes may be partial substitutes, and that forests gain comparative advantage as we move towards temperature extremes (the coefficients for forest and crop income have opposite signs). The effect of precipitation means on incomes is less clear. The statistically insignificant impact of precipitation on crop incomes seems surprising, as yield is heavily affected by water availability. However, water availability is a function of both precipitation and evapotranspiration, with the latter being highly dependent on temperature. As a result, the impact of water availability may be captured by the temperature, rather than the precipitation coefficients.
Moving to weather anomalies and sector incomes (last four lines in table 2), all coefficients of the interaction terms of weather anomalies with climate are significant. This indicates, as we had expected in section 2, that the effects of temperature and precipitation anomalies depend on the average temperature and precipitation levels in the area. Notably, the effects are again opposite for forest and crop incomes. To calculate the marginal effects of anomalies, we take the partial derivative of equation (2) with respect to anomalies. Note that the marginal effect is a function of climate. Above-normal hot years in cool climates increase crop income, while forest incomes are being reduced. Conversely, hot years in warm climates are harmful to crop production, but increase absolute forest incomes. The two opposed effects partially cancel out, such that the impact of temperature anomalies on total income is insignificant. The same is true for precipitation shocks. These findings, in particular the opposed signs between crop and forest estimates, suggest that the direct effects on production (which would indicate the same sign for both) are being dominated by substitution effects in forestry, most likely through the reallocation of production factors from cropping to forest extraction.
However, one might expect that the effect of weather on incomes may depend on household income: households with high incomes may have better means to adapt, making them less susceptible to both weather and climate impacts than poor households. In table 3 we thus replicate the model from table 2, but using quantile regressions for the lowest income quintile, the median and the highest income quintile. We use bootstrapping to estimate the standard errors using 500 replications clustered at the village level (Hagemann, Reference Hagemann2017). While the coefficients expectedly are estimated with the same signs as in table 2, we see that lower-income households are more sensitive to weather- and climate-induced effects: most coefficients are larger in absolute terms (and typically more significant) for lower than for higher income households.
Climate and weather impacts on household incomes. Quantile regression

Notes: Regression specification includes soil characteristics, infrastructure variables, elevation, and region-fixed effects as controls. Standard errors are clustered at the village level. ***Significant at 1% level, **significant at 5% level, *significant at 10% level.
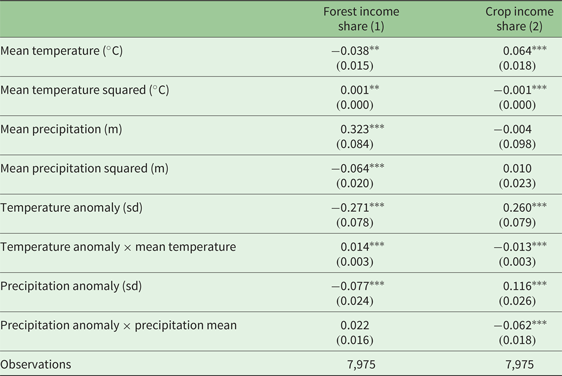
In the following we report the estimates of equation (2) with income shares as dependent variables. This specification therefore addresses the question of relative changes, i.e., whether forest income is more or less affected by climate variations and weather shocks than crop income. Table 4 shows our regression results with crop and forest income shares as dependent variable. The results are even clearer than in table 2 with log of absolute income as dependent variables: all eight pairs of climatic variables are estimated with opposed signs between the two sectors (13 out of 16 coefficients are significant). Again, the forest income share increases towards the temperature extremes, and peaks at 2,500 mm annual precipitation under normal weather conditions. It increases with weather anomalies that intensify the climate extremes in our sample. Generally, the reverse is true for the crop income share, although the estimates for precipitation are statistically insignificant. These results cannot be explained by ecological reasoning as forest productivity may suffer – similar to crop productivity – from weather extremes, but are rather due to the way humans adapt to climatic extremes, and cope with weather shocks.
Climate and weather impacts on household incomes shares. OLS regression

Notes: Regression specification includes soil characteristics, infrastructure variables, elevation, and region-fixed effects as controls. Standard errors are clustered at the village level. ***Significant at 1% level, **significant at 5% level.
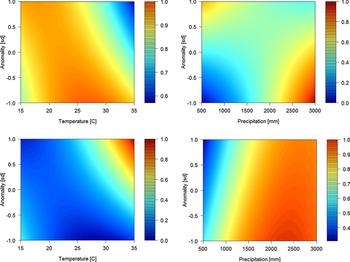
Figure 3 graphically presents the results from table 4. The figure highlights the interaction of climate and weather anomalies. The top panels of the figure depict the impact of climate means and temperature anomalies on crop incomes. Moving from the optimum of around 21°C (see above), warm years in cold climates and cold years in hot climates increase crop production. The effects are similar for precipitation, except for the drier areas where results are mixed. Due to the linear shock terms, incomes either increase monotonously or decline with shocks, which seems only plausible for a restricted range of weather shocks.
The impact of climate and weather on crop (top panels) and forest income shares (bottom panels).

For forest incomes (bottom panels), effects tend to be the opposite: temperature and precipitation anomalies that intensify the climate extremes, such as hot years in warm climates increase forest incomes. The panels show clearly that the response of crop and forest income shares to weather and climate are opposite, as the color pattern reverses from the top panels of the figure to the bottom panels of the figure.
7. Discussion and conclusion
The purpose of this study is to look at the links between climate, weather, and smallholder livelihoods in rural areas of developing countries. For this, we combined 30 years of village-level climate data with a large cross-sectional socioeconomic dataset. In principle, this allowed us also to distinguish between two aspects: the income differences observed across climatic regions with different temperature and precipitation conditions (‘climate gradients’), and the implications of deviations in realized weather from expected climate means in the particular survey year for income generation across sector sources (‘weather anomalies’).
First, with respect to differences in climate across the cross-section dataset (‘climate gradients’), we showed that crop income is relatively more important under intermediate climates that are close to optimal plant growing conditions. In turn, forest income becomes relatively more important for rural households under more extreme climate conditions. These differences are slightly more accentuated for the temperature than for the precipitation variables.
Second, the analysis of impacts from fluctuating weather (‘weather anomalies’) comes out complementarily to the structural climate gradient picture. Other things being equal, households experiencing weather shocks (with negative impacts on crop income) tend to cope by engaging more in forest-foraging activities than households that have faced normal weather conditions. We argue that this pattern emerges because forest extraction is relatively less sensitive to weather variation than crop production, which tends to be a more attractive income source to households close to optimal weather conditions. As explained above, this relative resilience of forests vis-à-vis crops may be due both to their greater biological diversity and to their greater reliance on multi-annually accumulated biomass stocks than annual biomass increments. Consequently, although forest products may also simultaneously face deteriorating biophysical growth conditions in absolute terms, forest extraction might gain attraction under both climate extremes and in coping with negative weather shocks, inducing households to allocate more production factors such as labor to it. This pattern was found to be particularly relevant to the poorest income quintile of households, which are likely more exposed to climatic variations (e.g., by living in environmentally more fragile areas) and/or have lesser material means and assets to adapt to climate change and shocks.
In terms of policy implications, our analysis of anomalies could thus also be relevant to future climate change, which, inter alia, is predicted to cause higher average temperatures, changes in precipitation regimes, and generally more unpredictable weather. Weather anomalies, so we find, seem to matter most when they accentuate climatic conditions that are already fairly detached from mean temperatures and mean precipitation, compared to levels that are nearly optimal for crop production. Our results suggest that forests and extractive resources, typically managed as common pool resources, can potentially be important coping mechanisms, especially for poor rural households with little access to formal insurance.Footnote 16 This coping function will likely gain importance under the threat of future climate change.
This resilience of forest incomes compared to crop income stresses the potential importance of maintaining vital forest resources in developing countries under the threat of climate change. Rural households that face less favorable climate conditions might compensate some crop losses by increasing forest production. However, a large increase in forest-based extraction might often not be sustainable. Another recently published study, drawing also on the PEN data set, found that greater pressure on forest resources, including that due to a greater number of people relying on their extraction, is typically increasing forest degradation levels. This happens over a fairly short time span of just five years, significantly diminishing the availability of key forest products in these villages (Hermans-Neumann et al., Reference Hermans-Neumann, Gerstner, Geijzendorffer, Herold, Seppelt and Wunder2016). Extractive systems thus can probably not provide a large supply increment to long-term climate change, in line with what our cross-section based models predicted that a forest ‘subsidy from nature’ could be in response to crop damages. That is, increased extraction from the environment could in some cases likely be a temporal pathway of adaptation to temporal shocks and in coping with incipient effects of climate change, but it is much less likely that forests can serve as medium- or long-term income substitutes. In this study, we cannot make any informed temporal extrapolation.
This also raises a caveat regarding the arguably most important limitation of our results: we derive our conclusions from a cross-sectional snapshot, rather than observing impacts of climate change over time in the same sites. Of course, there is always considerable interest in interpreting the former for predicting the latter, including as we have seen for the Environmental Kuznets Curve literature on pollution or deforestation (Mather et al., Reference Mather, Needle and Fairbairn1999; Bhattarai and Hammig, Reference Bhattarai and Hammig2004; Stern, Reference Stern2004). While it is tempting to also use our results for a prediction of climate change effects, this interpretative transition may be particularly controversial. Many projected damaging effects of climate change will occur through the disturbance of long-term adapted ecological systems. By ‘walking along a climate gradient’, as we have done here (e.g., from a temperate to a slightly hotter sub-tropical site), we are comparing two near-equilibrium long-term adapted systems with each other. This is bound to differ from what climate change would look like in that temperate site, because the latter will be exposed to systemic shocks and disequilibria, rather than being able to transition smoothly to the adapted hotter site's ecological and production systems. Likewise, the anthropic systems in the warmer site may also have already adapted historically in ways that make it non-comparable to the temperate site, e.g., in terms of population density being lower in the former than in the latter. Finally, as discussed in section 3, the PEN sample has a somewhat less ample coverage in forest-scarce, population dense areas, which is probably where forest-based coping effects are more difficult to achieve.
Nevertheless, our results could help to fine-tune the hypotheses that researchers would want future time-series studies to answer. Notably, a certain degree of substitutive relationship between agricultural and environmental incomes, and between annual biomass increment and perennial biomass production, would be pertinent to expect. We did find several indications that environmental extraction from forests is a less fluctuating and more climate-resilient activity than cropping, providing a potential stabilizing function for the livelihoods of rural smallholders.
If true, three forest policy implications follow. First, conserving the integrity of natural forests and wildlands will be key to rural livelihoods in low-income countries, potentially sustaining an income stream that especially the poorest households rely disproportionally on. Conversely, resource extraction that in many of our sites is already of a degrading nature (Hermans-Neumann et al., Reference Hermans-Neumann, Gerstner, Geijzendorffer, Herold, Seppelt and Wunder2016) might intensify under climate change scenarios where rural people try to make up for crop shortfalls by increasing environmental extraction. This will call for additional conservation efforts. In the future, finer-scale panel data analyses about the role of different leading forest products in different geographic regions could give us a more consolidated diagnosis of what type of ecological pressures we should expect in what places.
Second, future forests should be managed according to precautionary principles. While here we focused on the direct income effects on rural livelihoods, the ecologically protective functions of forests at multiple scales may in addition help rural households adapt to climate change, e.g., in terms of preserving cooler local temperature and/or more regular precipitation patterns. Long-term forest resilience is in turn closely tied to biodiversity conservation at multiple scales (Thompson et al., Reference Thompson, Mackey, McNulty and Mosseler2009). Given the large uncertainties about the degree and effects of climate change, future forest management strategies should preferably mix adaptation and mitigation goals, in ways that are incremental, flexible and, if possible, reversible over time (Millar et al., Reference Millar, Stephenson and Stephens2007).
Third, as a flip side of this coin, securing local people's access to extract, consume, and trade extractive resources will also be important: as our results indicate, too strict conservation policies that completely exclude access could have high costs for local livelihoods, impairing the ability of especially poor households to effectively cope with climate change and fluctuations. It will thus be necessary to walk a fine line of balanced forest conservation and sustainable use strategies to support local livelihoods and biodiversity conservation goals in a future of further global climate change and more local weather anomalies.