INTRODUCTION
The increase in atmospheric carbon dioxide (CO2) concentration has created interest in improving cropping systems and soil management strategies to sequester carbon (C) in the soil and thereby remove significant amounts of CO2 from the atmosphere (Chevallier et al. Reference Chevallier, Woignier, Toucet and Blanchart2010). It is well-documented that conservation tillage can improve soil aggregation by preventing the breakdown of soil macro-aggregates, thereby enhancing C protection and increasing soil organic carbon (SOC) levels (Lopez-Garrido et al. Reference Lopez-Garrido, Madejon, Murillo and Moreno2011) and converting agricultural soils from C sources to C sinks (Paustian et al. Reference Paustian, Andren, Janzen, Lal, Smith, Tian, Tiessen, Van Noordwijk and Woomer1997; Antle et al. Reference Antle, Capalbo, Mooney, Elliott and Paustian2002; Six et al. Reference Six, Ogle, Breidt, Conant, Mosier and Paustian2004). However, studies on the effect of conservation tillage on SOC retention are sometimes contradictory (Franzluebbers & Arshad Reference Franzluebbers and Arshad1996; McCarty et al. Reference McCarty, Lyssenko and Starr1998), especially when the entire soil profile is considered (Fuentes et al. Reference Fuentes, Hidalgo, Etchevers, De Leon, Guerrero, Dendooven, Verhulst and Govaerts2012). In recent years, scientists have started to question whether these conservation tillage measures can really sequester C in terrestrial ecosystems in the long term (Pacala & Socolow Reference Pacala and Socolow2004). Some studies showed that conservation tillage led to significant C sequestration in the top 0·05, 0·1 or 0·2 m of the soil (Liang et al. Reference Liang, Zhang, Fang, Yang and Drury2007; Yang et al. Reference Yang, Drury, Wander and Kay2008; Franzluebbers & Stuedemann Reference Franzluebbers and Stuedemann2010; Liu et al. Reference Liu, Zhao, Mei, So, Li and Li2010; De Sanctis et al. Reference De Sanctis, Roggero, Seddaiu, Orsini, Porter and Jones2012). Puget & Lal (Reference Puget and Lal2005) found that no tillage (NT) increased SOC content in approximately one-fifth of the studies. No tillage increased SOC stock in Western Canada, but not in Eastern Canada (Angers et al. Reference Angers, Bolinder, Carter, Gregorich, Drury, Liang, Voroney, Simard, Donald, Beyaert and Martel1997; VandenBygaart et al. Reference VandenBygaart, Gregorich and Angers2003, Reference VandenBygaart, Bremer, McConkey, Ellert, Janzen, Angers, Carter, Drury, Lafond and McKenzie2011). Jarecki & Lal (Reference Jarecki and Lal2003) discovered that the SOC content approached a new equilibrium after years of constant management. In the short term (⩽10 years), effects of conservation management on SOC are difficult to generalize (Paustian et al. Reference Paustian, Andren, Janzen, Lal, Smith, Tian, Tiessen, Van Noordwijk and Woomer1997; Al-Kaisi et al. Reference Al-Kaisi, Yin and Licht2005). The increase of SOC induced by rapidly decomposing organic materials is generally slower (Fontaine et al. Reference Fontaine, Mariotti and Abbadie2003). Franzluebbers & Arshad (Reference Franzluebbers and Arshad1996) noted that there was little or no detectable increase in SOC in the first 2–5 years, but a large increase was often found 5–10 years or even several decades after converting conventional tillage to conservation tillage (Shrestha et al. Reference Shrestha, McConkey, Smith, Desjardins, Campbell, Grant and Miller2013). Contradictory or inconsistent findings of the above studies might be due to lack of initial data of SOC stock for some of these studies, which is very important to reflect the impact of tillage practices with time. The stratification ratio (SR) is a good parameter for evaluating soil quality due to the importance of surface organic matter in erosion control, water infiltration and nutrient conservation (Franzluebbers Reference Franzluebbers2002; Hernanz et al. Reference Hernanz, Sanchez-Giron and Navarrete2009). Moreover, high SR of the soil C pool could be a good indicator of dynamic soil quality, independent of soil type and climatic regime (Franzluebbers Reference Franzluebbers2002). Lopez-Garrido et al. (Reference Lopez-Garrido, Madejon, Murillo and Moreno2011) suggested that studying the SR of SOC may be more beneficial than total SOC changes caused by conservation tillage. The increase or decrease of SR was induced by different changes in SOC at surface and sub-surface soils. Sá & Lal (Reference Sá and Lal2009) deduced that the SR of SOC is an efficient indicator of C sequestration in the long-term NT management.
Northeast China is a critical agricultural production region for soybean and maize in China. Black soil (Typical Hapludoll, USDA Soil Taxonomy, Soil Survey Staff 1999) is one of main agricultural soils in this region and often called ‘the king of soils’ in China. Unfortunately, wide-scale conversion of natural grassland to cropland with improper management has resulted in serious soil degradation (Yang et al. Reference Yang, Zhang and Wang2005). Soil fertility has declined significantly and SOC content in the 1980s was less than half of the initial SOC content in this area (Jilin General Station of Soil and Fertilizer 1998). Can conservation tillage make restoration of Black soils possible in Northeast China which has a range of soil texture, tillage history and climate conditions? Previous work by Liang et al. (Reference Liang, Zhang, Fang, Yang and Drury2007, Reference Liang, Yang, Zhang, Shen, Shi, Fan and Fang2010) on Black soils in Northeast China showed that 3-year NT did induce a trend in SOC stratification relative to mouldboard plough (MP), but this stratification trend was not significant until 5 years (2001–05) of NT management. The question remains: how will SOC change under long-term conservation and NT management? Is NT a good option for Black soil in Northeast China? There is a great need for chronosequence and paired-field comparisons of SOC, which will help to validate the contribution of conservation tillage based on the field trials with well-documented initial SOC information (Liang et al. Reference Liang, Zhang, Fang, Yang and Drury2007; Franzluebbers & Stuedemann Reference Franzluebbers and Stuedemann2010). The present work collected additional SOC data from 2006 to 2011 on the same experimental site under the same tillage management systems as in previous reports (Liang et al. Reference Liang, Zhang, Fang, Yang and Drury2007, Reference Liang, Yang, Zhang, Shen, Shi, Fan and Fang2010). Based on initial levels of SOC, the objective of the present study was to determine the changes in SOC concentration and stocks and the SR of SOC after 10 years of different tillage practices. This will provide a better understanding of the changes in SOC stock after the transition period (<5 years) of conversion of conventional MP management to conservation tillage management.
MATERIALS AND METHODS
Study site
This tillage study was initiated in 2001 at the Black Soil Experimental Station (44°12′N, 125°33′E; 205 m a.s.l.) of the Northeast Institute of Geography and Agroecology, Chinese Academy of Sciences in Dehui County, Jilin Province, China. The study site lies in the Temperate Zone with a continental monsoon climate. The mean annual temperature was 4·4 °C and the mean annual precipitation was 520 mm with >0·70 of this occurring in June, July and August. This site was located within the Black Soil Zone, a north–south crescent-shaped region in Northeast China, ranging from 42 to 49°N. Mean annual rainfall and temperature differed significantly throughout the region. Although the current experiment was ‘representative’ of the region, obviously differences in the effect of tillage on SOC would be expected due to the differences in not only climate but also quantity and quality of organic matter in the soil within the nearly 800 km from the most southerly to northerly extent of the Black soil region. For example, due to the differences in climate and cultivation time, SOC contents in arable soils were higher in the north than in the south. The soil was a typical Black soil (Chinese Soil Taxonomy) with a clay loam texture (Gong Reference Gong2003). Soil was neutral or slightly acidic. Selected soil physical and chemical characteristics are given in Table 1. The slope of experimental plots was <1°. Prior to establishment of this tillage trial, the land had been used for continuous maize under conventional farming practices for >10 years. Under conventional farming practices in Northeast China, above-ground maize residue (including maize stubble) was removed from the field after harvest and prior to mouldboard ploughing, and stockpiled as feed and/or fuel for home heating and cooking. In the present study, the tillage experiment deviated from this traditional practice, and the maize stubble and above-ground crop residues were retained on the soil from initiation of the experiment in 2001.
Selected air-dried soil physical and chemical properties* in 2001 prior to the tillage experiment

SOC, soil organic carbon; TN, total nitrogen.
* Means ± s.d., n = 4.
† Clay: <0·002 mm, silt: 0·002–0·02 mm, sand: 0·02–2 mm.
Experiment design
The tillage experiment, consisting of MP, NT and ridge tillage (RT), was arranged in a randomized complete block design with four replicates. Each tillage plot was 10·4 × 20 m2 and split into two sub-plots (5·2 × 20 m2) which were under maize (Zea mays L.)–soybean (Glycine max Merr.) rotation with both crops present each year. The MP included one mouldboard ploughing (about 0·2 m deep) after maize harvest, plus disking (0·075–0·1 m deep) and field cultivation in spring. The RT included ridging in June and smashing maize stalks/roots in the autumn (less than one-third of row width). The NT soil had no soil disturbance except for planting using a four-row KINZE-3000 NT planter (Williamsburg, IA, USA: 2000 kg weight) from 2002 to 2009 and a two-row John Deere-7200 NT planter (Moline, IL, USA: 1000 kg weight) since 2010. Crop residues were left on the soil surface after harvest for all treatments. Maize stalks were chopped into pieces about 0·3 m long, leaving 0·3–0·35 m stubble, and then manually spread on the soil surface; soybean residues were returned directly to the soil surface (Zhang et al. Reference Zhang, Li, Lu, Zhang and Liang2013).
For maize, nitrogen (N), phosphorus (P) and potassium (K) were applied (200 kg N/ha, 70 kg P/ha and 90 kg K/ha were applied as starter fertilizer and an additional 135 kg N/ha was applied as top dressing at the 6-leaf (V6) growth stage) (Ritchie et al. Reference Ritchie, Hanway and Benson1986). Starter fertilizers for all plots were applied as side bands (0·05–0·07 m deep and 0·05 m from the seed row) concurrently with planting. For soybean, all fertilizers were applied as starter fertilizer, including 40 kg N/ha, 60 kg P/ha and 80 kg K/ha.
Soil sampling and measurements
Soil samples (seven cores per plot) were collected in the maize phase of maize–soybean rotation plots down to a depth of 0·2 m after harvest (early to mid-October) each year from 2001 to 2011. Crop residues were not included during sample collection. The samples were taken using a hand core auger (0·0264 m internal diameter) and separated into three sections corresponding to 0–0·05, 0·05–0·1 and 0·1–0·2 m depths. Soils from the same depth in each plot were pooled. Soil samples were gently broken, air-dried and weighed. After manually removing visibly identifiable crop residues, c. 20 g of soil was ground to pass through a 0·154 mm sieve for SOC measurement. A sub-sample was oven-dried at 105 °C for 8 h to calculate water content for subsequent calculation of soil bulk density (BD). Total soil C was determined with the dry combustion method using a FlashEA1112 Elemental analyser (Thermo Finnigan, Milan, Italy). Since the soil was free of carbonates, SOC was assumed to be equivalent to total C. An internal laboratory standard developed from a local soil collected from the surface layer was used for quality control of SOC analysis.
Data analysis
The SOC stock was calculated on the basis of equivalent soil mass according to the procedure of Ellert & Bettany (Reference Ellert and Bettany1995). For the remainder of the present paper, the term ‘SOC stock’ refers to SOC stock based on equivalent soil mass. The SR of SOC was calculated from the SOC concentration in the 0–0·05 m layer divided by that in the 0·1–0·2 m layer. Analysis of variance (ANOVA) analyses were performed to compare the treatment effects of tillage, soil depth and year on soil BD, SOC concentration and SOC stock. The least significant difference (LSD) test was used to compare the means of BD and SOC concentrations under different tillage management and in different depths and determine if treatment effects were significant.
In order to show the trends in SOC and SR of SOC with time in response to tillage systems, linear regressions of SOC and SR v. time for each tillage treatment were done. Although the field site had been under the same management for >10 years previously, because the field site was visually uniform and the tillage treatments were randomized within the field, different tillage treatments had different starting SOC levels. In addition, ANOVA of the 2001 data showed no significant differences in either SOC or SR among blocks (data not shown). Therefore, firstly all the data were normalized, thus the three tillage treatments had the same levels of SOC content in 2001. Then the SOC and SR data for each depth were fitted to a regression model with time for each tillage treatment separately. This model forced all three tillage treatments to start at the same point in 2001 and enabled each tillage treatment to have a different slope, i.e. rate of change of SOC or SR with time. Tests of significance were made on the slopes. All analyses were performed using SAS 9.1 (SAS Institute, Cary, NC, USA); the regression analysis was done using the general linear models procedure in SAS.
RESULTS
Effects of tillage practice on soil bulk density
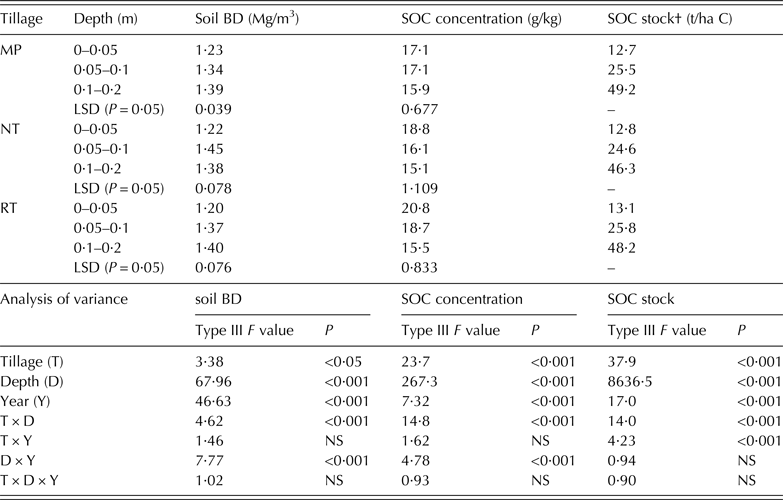
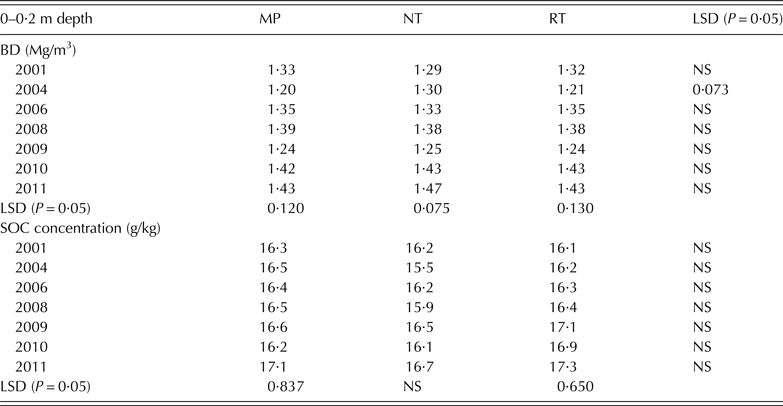
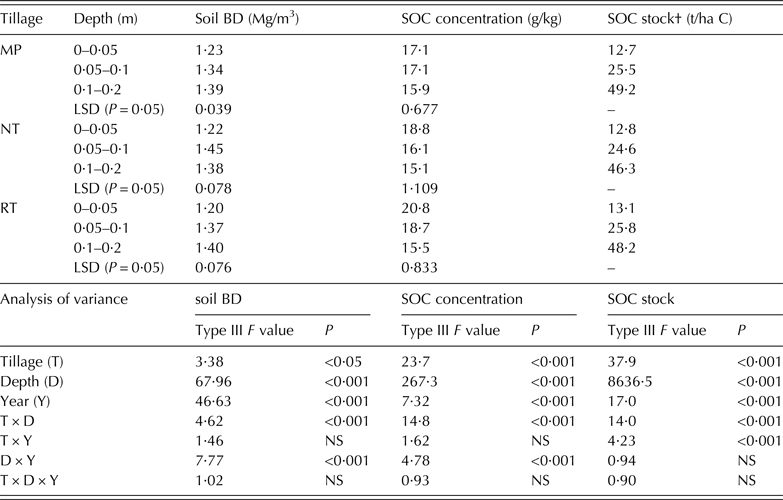
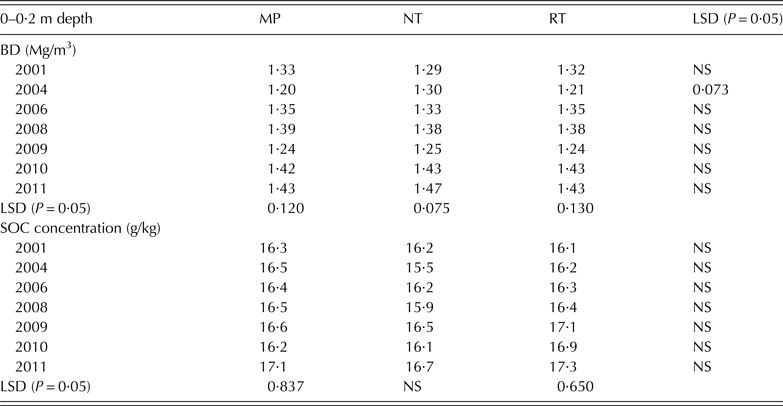
Tillage had a significant impact on soil BD (P < 0·05), and the effect varied with soil depth (Table 2). Soil BD at both 0–0·05 m and 0·05–0·1 m depths decreased from 2001 to 2004 and then increased in the following years for all tillage treatments (Fig. 1). In the first 3 years of tillage practice, the relative changes of soil BD were much less under NT than under MP and RT, and the decrease in the top 0·05 m was much greater than at 0·05–0·1 m depth under NT. In the 0·1–0·2 m layer, there were no obvious changes in BD from 2001 to 2004, but it gradually increased after 2004 with the exception of years 2009 and 2010. In the 0–0·2 m layers average soil, BD showed a remarkable increase with time under all three tillage treatments, but there were no significant differences among tillage treatments within the same year (Fig. 1 and Table 3).
Soil bulk density under tillage treatments from 2001 to 2011. The vertical bars indicate s.e. (n = 4).

Effects of tillage, depth and year on soil bulk density (BD), soil organic carbon (SOC) concentration and SOC stock from 2001 to 2011*
NT, no tillage; MP, mouldboard plough; RT, ridge tillage; LSD, least significant difference; NS, not significant.
* The data presented are averages in 2001, 2004, 2006, 2008, 2009, 2010 and 2011 under MP, NT and RT treatments, respectively (n = 4).
† Values in SOC stock column refer to SOC stock at 0–0·05, 0–0·1 and 0–0·2 m depths under different tillage practices.
Soil bulk density (BD) and soil organic carbon (SOC) concentration in the 0–0·2 m layers under mouldboard plough (MP), no tillage (NT) and ridge tillage (RT) from 2001 to 2011 (n = 4)
LSD, least significant difference; NS, not significant.
Changes in soil organic carbon concentration and storage over time
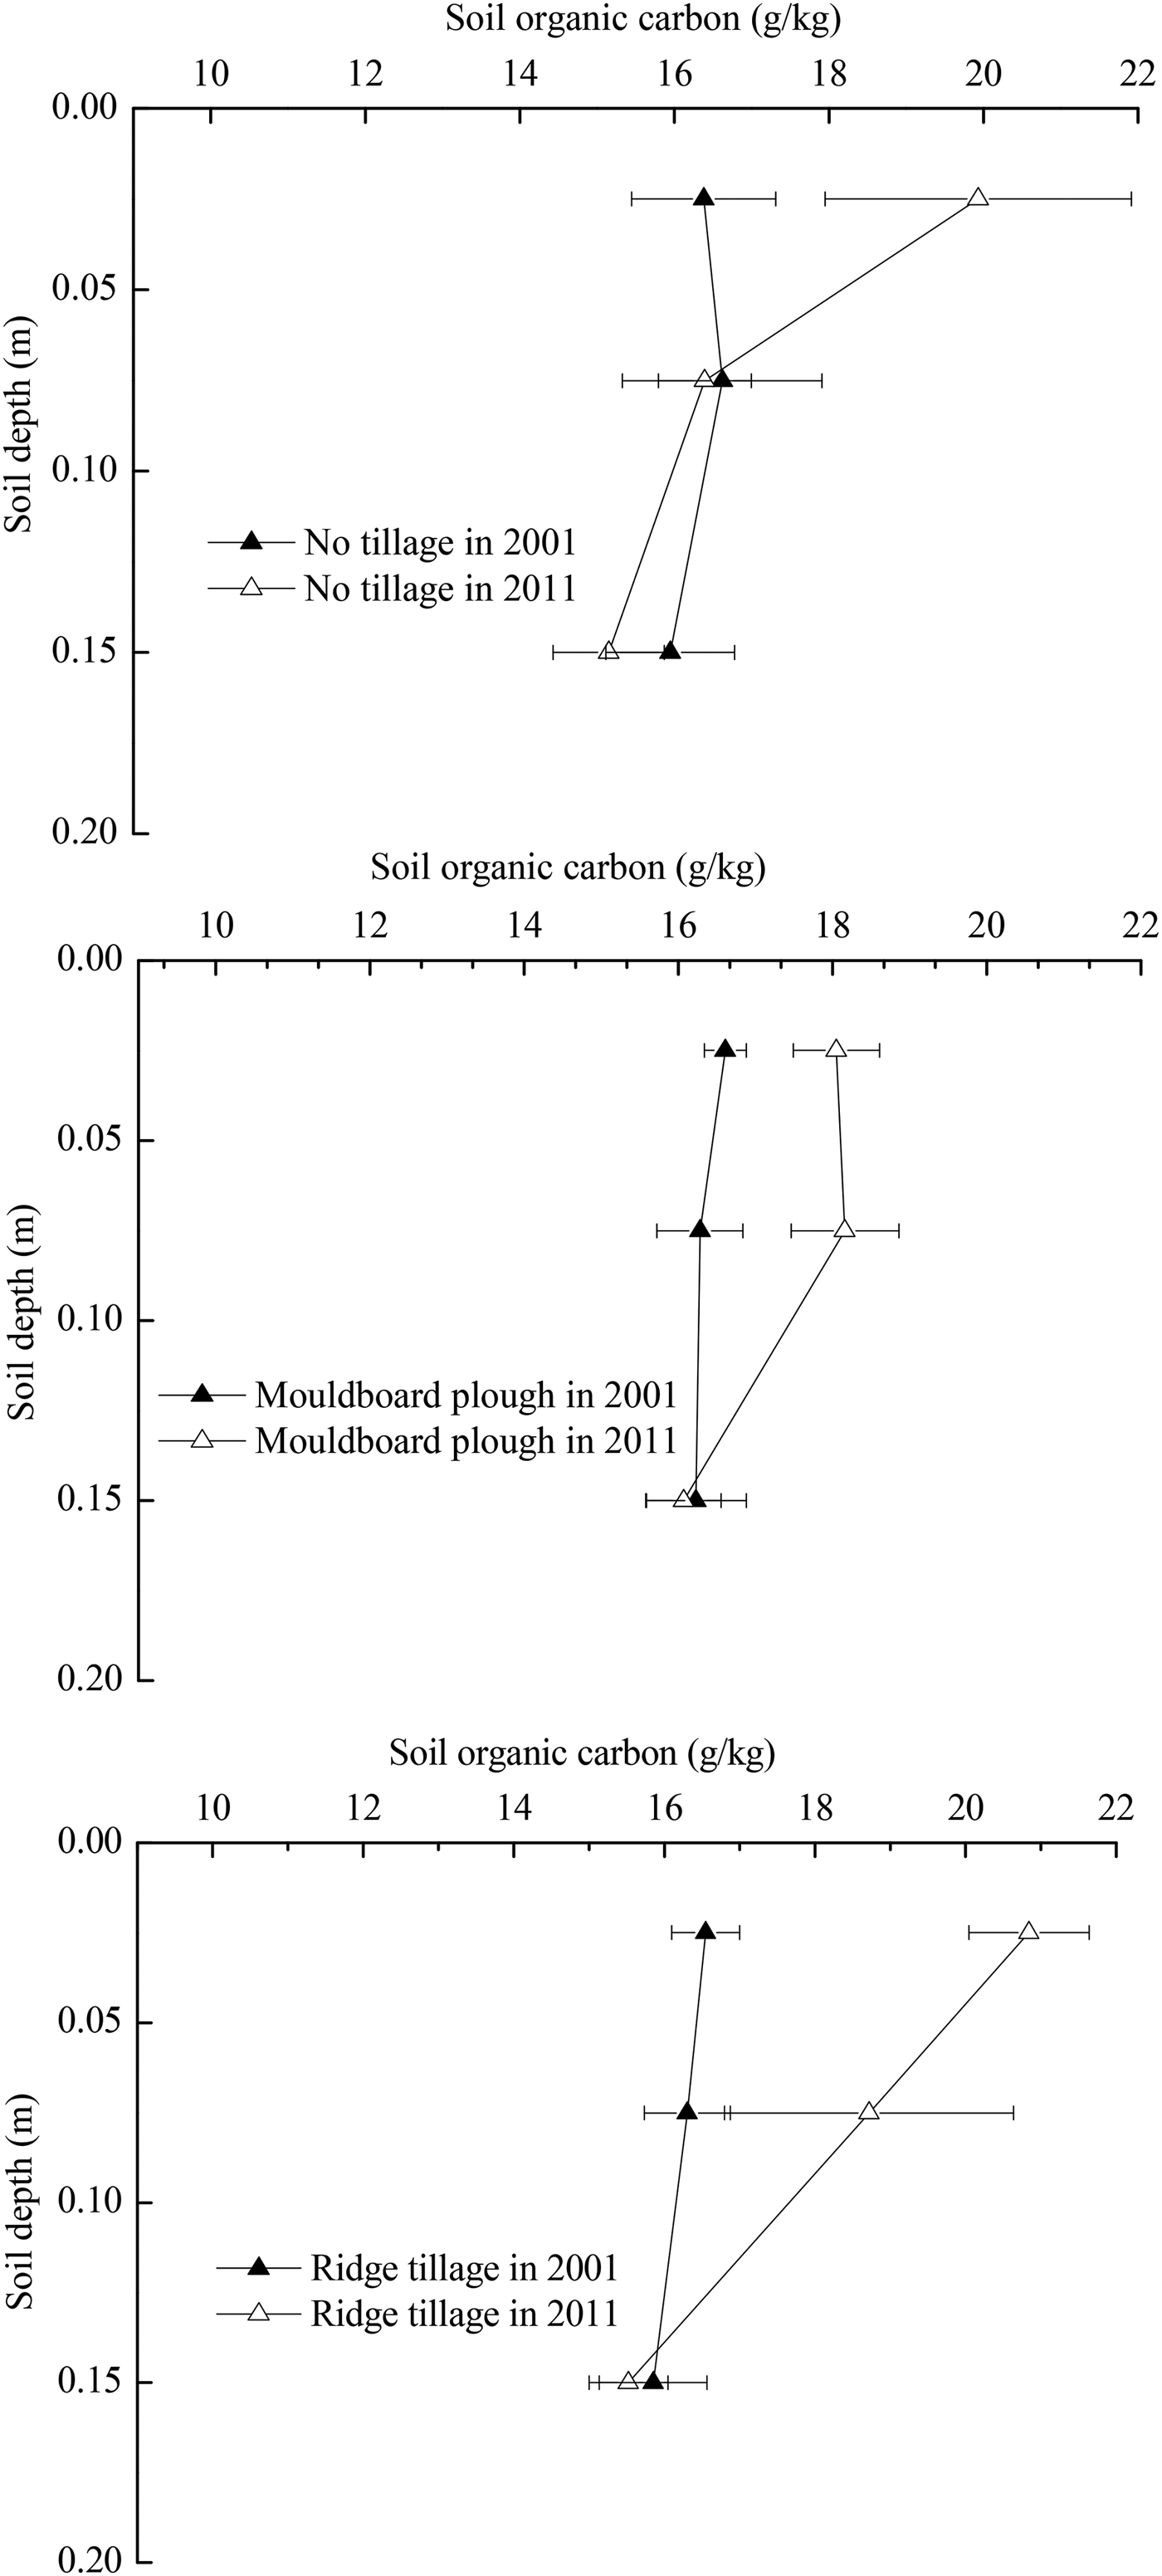
Tillage significantly (P < 0·05) affected SOC concentration and SOC stock, and the effects varied with soil depths (Table 2). Both MP and RT significantly (P < 0·05) increased SOC concentrations in top 0–0·05 m and 0·05–0·1 m layers and there were no large differences at 0·1–0·2 m depths after 10-year adoption of tillage treatments (Fig. 2). The NT treatment showed significant increases only in the top 0·05 m (P < 0·05), associated with decreasing SOC in the 0·1–0·2 m layers (Fig. 2). In the entire 0–0·2 m layer, the concentrations of SOC were 3·09, 4·91 and 7·45% greater in 2011 than the initial level (2001) for NT, MP and RT plots, respectively. These changes were correspondingly greater than those in the 0–0·3 m layer, except in the RT plot (NT: 2·0, MP: 3·14 and RT: 9·74%). As time went on, the relative change of SOC obviously occurred in the plough layer under RT but not under MP and NT.
Soil organic carbon content in a Black soil after 10-year different tillage treatments. The horizontal bars indicate s.e. (n = 4).

At 0–0·05 m depth, SOC concentrations under NT, MP and RT increased over time (Fig. 3). The increase from 2001 to 2011 at this depth was 10·6% greater in RT than that in the NT plot. In MP soils, SOC concentration also showed a tendency to increase, but the rate of SOC change was much lower than under NT and RT. At either of 0·05–0·1 or 0·1–0·2 m depths (Fig. 3), NT resulted in a decrease of SOC concentration with time, while both MP and RT soils led to a small SOC increase in the 0·05–0·1 m layer and no change occurred in the 0·1–0·2 m depths. Consequently, the linear models of the change of SOC over time diverged among three tillage treatments. All three tillage treatments resulted in an increasing tendency in SOC concentration in the 0–0·2 m layer from 2001 to 2011 (Fig. 3).
Changes of soil organic carbon content at different depths in a Black soil under different tillage treatments from 2001 to 2011.

Throughout the 10 years of field tillage experiments, tillage effects on SOC stock varied among soil depths and also varied with time (P < 0·05). The SOC stocks in the complete profiles changed differently among tillage type and the changes also varied with soil depth and time (P < 0·05) (Table 2 and Fig. 4). In the same year, significant (P < 0·05) differences in SOC stocks occurred between NT and MP plots, but not between RT and the other two treatments. However, tillage had great effects on the relative changes of SOC stock. As shown in Fig. 4, RT resulted in significant (P < 0·05) changes in SOC stocks in all of 0–0·05, 0–0·1 and 0–0·2 m layers compared with NT and MP, and NT and RT both showed greater changes than MP in the top 0·05 m. With increasing depth, the differences in the change of SOC stock between MP and NT decreased, but the differences between RT and other two treatments increased (Fig. 4). With time, the relative changes of SOC stock increased under all three tillage practices, especially under RT, at 0·05 m and 0·1 m depths (Figs 4(a) and (b)). In the 0·2 m layer (Fig. 4(c)), SOC stock in the NT plot had a tendency to decrease for the first 8 years and then increase in the following 2 years with a 10-year average of 0·602 t/ha SOC decrease per year. The RT showed a positive trend, with an average of 1·69 t/ha SOC increase per year.
Relative change of soil organic carbon stocks from 2001 to 2011 under different tillage treatments. The vertical bars indicate s.e. (n = 4). MP, mouldboard plough; NT, no tillage; RT, ridge tillage.

Stratification of soil organic carbon among tillage practices
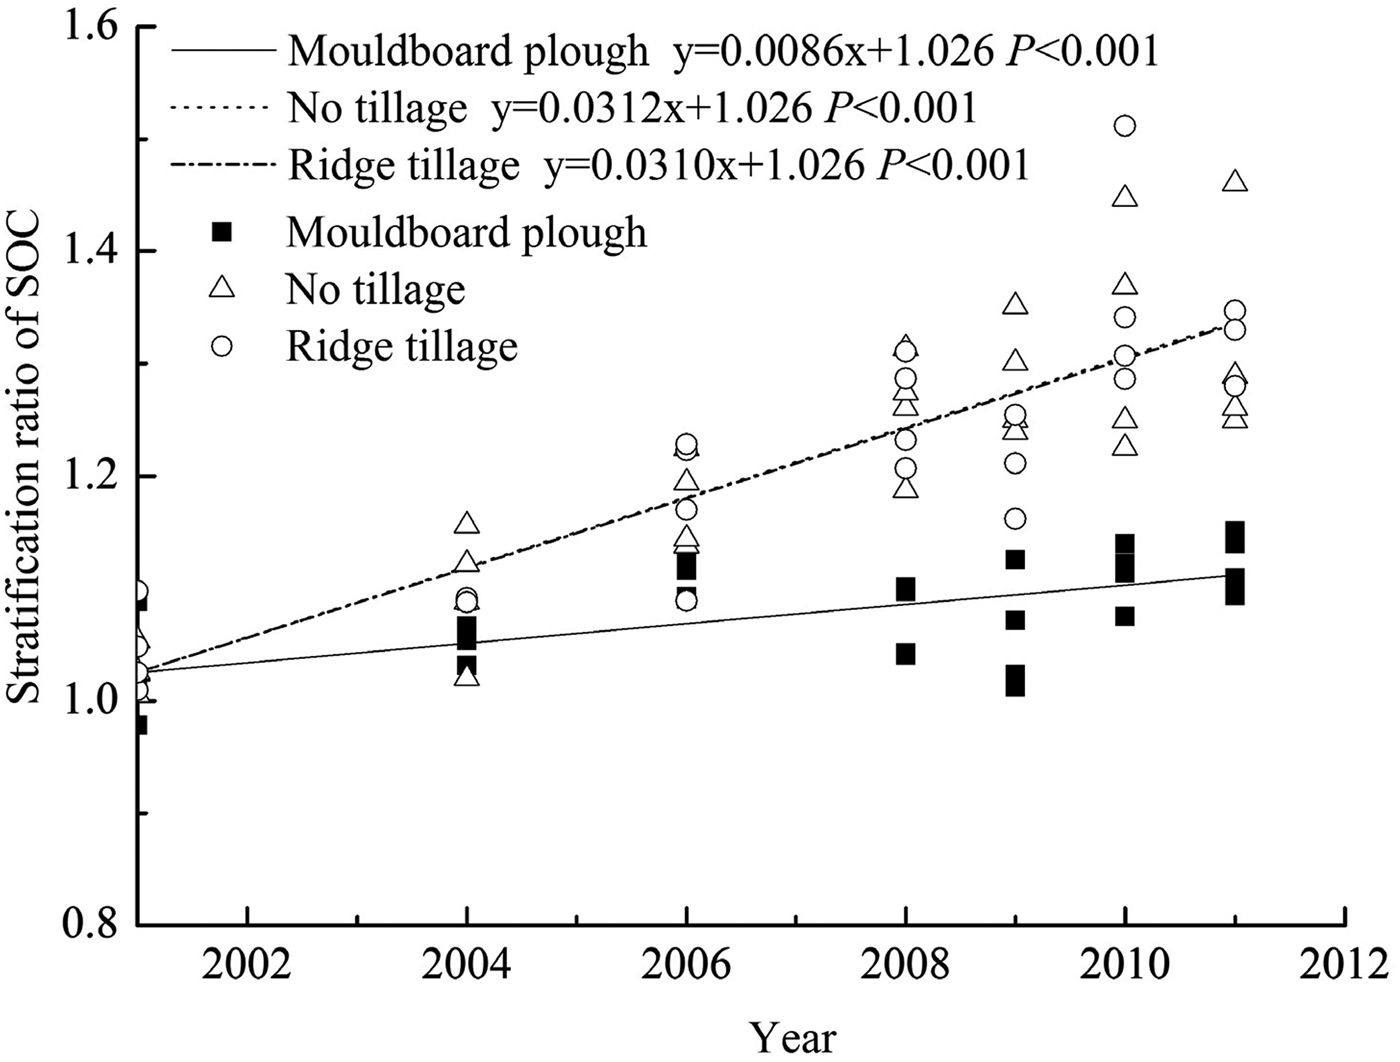
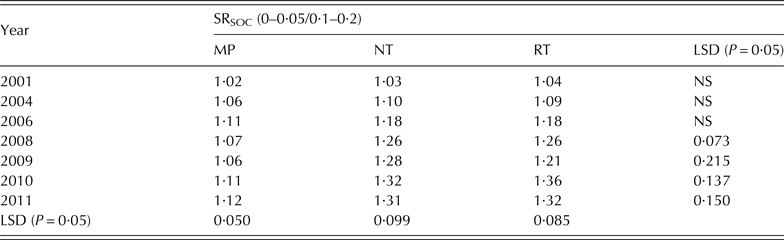
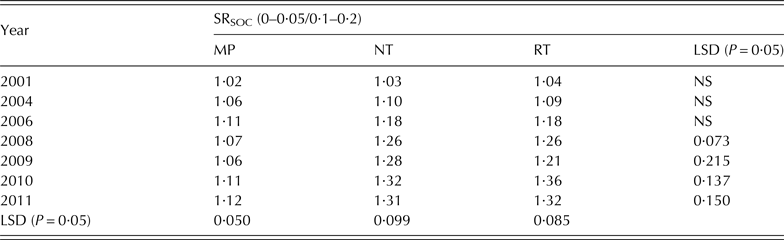
The SR for SOC ranged from 1·02 to 1·12 for MP compared with 1·03–1·32 SR for NT and 1·04–1·36 SR for RT in 0–0·05 m and 0·1–0·2 m layers, respectively, over the 10 years (Table 4). The SOC concentration showed a trend of higher stratification in NT and RT than in MP; the SRs were significantly higher (P < 0·05) in NT and RT than in the MP from 2008 to 2011. Significant (P < 0·01) positive linear relationships between the SR of SOC and time were observed in NT and RT plots (Fig. 5). Moreover, the rates of increase in the SR of SOC with time were identical for RT and NT (0·031 per year).
Relationships between duration of tillage practices and stratification ratio of soil organic carbon (SOC) (0–0·05 to 0·1–0·2 m).

Stratification ratio of soil organic carbon (SOC) under three tillage treatments from 2001 to 2011 (n = 4)
NT, no tillage; MP, mouldboard plough; RT, ridge tillage; LSD, least significant difference; NS, not significant.
DISCUSSION
Soil bulk density
Compared with MP and RT, NT had significantly higher soil BD because the soil was not loosened by the tillage implements and crop residues were not mixed into deeper soil layers. In the entire plough layer, the combination of tillage and residue return had significant effects on soil BD in the top 0·1 m layer. This result was similar to the study of Das et al. (Reference Das, Bhattacharyya, Sharma, Das, Saad and Pathak2013).
In the plough layer, soil BD showed almost no change after the first 3 years of tillage treatment (Liang et al. Reference Liang, Zhang, Fang, Yang and Drury2007), but in the following 7 years it increased greatly in all plots. This might be a result of compaction from heavy wheeled traffic in the later years: de Moraes et al. (Reference de Moraes, Debiasi, Franchini and da Silva2013) found that field wheeled traffic resulted in an increase in soil penetration resistance and soil BD, and with increasing number of passes of wheeled traffic, soil compaction occurred in deeper soils. From 2010, a lighter and smaller two-row planter was used in the present work, but this doubled the number of passes of both tractor and planter over that of the four-row planter, which may explain the increase in soil BD compared with that in previous years (Botta et al. Reference Botta, Jorajuria, Rosatto and Ferrero2006). The increase in soil BD might also be due to low soil moisture as a result of drought in the autumn of both 2010 and 2011, when soil samples were collected. Bulk density for the soils in the current study exceeded the upper limit (1·2 t/m3) of the optimum range for field crop production as proposed for clay loam soils by Reynolds et al. (Reference Reynolds, Drury, Yang, Fox, Tan and Zhang2007). Plots under NT had higher soil BD in the 0–0·2 m layer than in MP and RT plots. It also verified that soil BD can be used to evaluate tillage intensity (Kuestermann et al. Reference Kuestermann, Munch and Huelsbergen2013).
Soil organic carbon concentration and storage
The amount of residue returned and tillage intensity influence the C input and decomposition, impacting SOC in the top 0·1 m layer. In some situations, changes of SOC by tillage could be offset by changes in other management practices. After 10-year adoption of new tillage practices where crop residues were retained, SOC contents increased significantly in the top 0·1 m for MP and RT, while the increase was limited to only the top 0·05 m for NT. There were no large differences in crop yield (unpublished data) and biomass production among tillage practices, and the changes in SOC probably resulted from the differences in C retention (input) of crop residue left on the surface of the NT plots v. being incorporated into the soil in the plots of the other two tillage practices. The results of greater increases in SOC content at 0–0·05 m depth of NT and RT soils indicate that significant amounts of C from crop residues had been incorporated into the surface of these soils. Tillage treatments ranked in order of weighted average SOC for 0–0·2 m depth concentrations were RT > MP > NT, showing that RT combined with returning residue provides the greatest SOC accumulation, which supports the study of Garcia-Franco et al. (Reference Garcia-Franco, Albaladejo, Almagro and Martinez-Mena2015).
Soil organic carbon stocks in the top 0·05 m layer under three all tillage treatments increased from 2001 to 2011 in the order NT > RT > MP. A similar tendency occurred at 0–0·1 m depth and the order was RT > NT > MP. Under NT, SOC concentration in the top 0·05 m increased over time at a rate greater than the decrease in sub-surface soils. However, average SOC stock in the 0–0·2 m depth across years decreased compared with the initial level under NT. An average of 1·69 t/ha SOC increase per year was seen for RT, while there was no large change for MP in the entire 0·2 m layer from 2001 to 2011. These changes were linked with variations in SOC concentration under three tillage practices from 2001 to 2011 and were in agreement with the study of Franzluebbers (Reference Franzluebbers2010). The RT treatment showed a consistent increasing trend in SOC stock in the entire 0–0·2 m. Comparatively, 10-year RT managements had greater increases in SOC concentration and stock in the entire plough layer than NT and MP, indicating better performance of RT in SOC retention in the plough layer.
It seems surprising that SOC stocks in MP increased over the 10-year study period when MP has been blamed for causing a reduction in SOC stocks (Alvarez Reference Alvarez2005; Melero et al. Reference Melero, Panettieri, Madejon, Macpherson, Moreno and Murillo2011). Prior to the current experiment, the field was under conventional farming practices including MP, where all above-ground biomass was removed for use as animal feed and fuel for home heating and cooking with only limited below-ground biomass available for C input to the soil. The present study departed from traditional practices and all of the above-ground residues were returned to the soil, which greatly increased the C input and allowed the SOC under MP to at least partly recover to its natural level under grassland.
More maize residue is removed from fields and stock-piled in Northeast China than is actually required for fuel use, and the excess stockpiles are often burned. If the excess residue could be returned to the soil, it may help to reduce SOC loss under MP. Johnson et al. (Reference Johnson, Novak, Varvel, Stott, Osborne, Karlen, Lamb, Baker and Adler2014) found that a return of 6 t/ha maize residue per year is needed to maintain SOC levels. Better field machinery that can perform tillage and planting functions in soil with high residue surface cover would facilitate returning more residues to the soil.
Soil organic carbon stratification ratio and carbon sequestration
Enrichment of C in the soil surface is essential for erosion control, water infiltration and nutrient conservation (Franzluebbers Reference Franzluebbers2002). Whatever the extent of this enrichment, the systematic decline in SOC concentration in the sub-surface in NT soil can result in a neutral or even a negative total C balance (Baker et al. Reference Baker, Ochsner, Venterea and Griffis2007; Alvaro-Fuentes et al. Reference Alvaro-Fuentes, Lopez, Cantero-Martinez and Arrue2008; Angers & Eriksen-Hamel Reference Angers and Eriksen-Hamel2008; De Sanctis et al. Reference De Sanctis, Roggero, Seddaiu, Orsini, Porter and Jones2012). Sá & Lal (Reference Sá and Lal2009) showed that the SR of SOC in the long-term NT treatments greatly enhanced the rate and the amount of SOC sequestered: they found a significant positive and linear correlation between the SR of SOC and SOC sequestration rates, indicating that C sequestration in the long-term NT management is well reflected by the SR of SOC.
In the present study, the SR of SOC under three tillage treatments ranged from 1·02 to 1·36. Franzluebbers (Reference Franzluebbers2002) suggested that SR < 2 was common under degraded conditions. The SR values in the present study fell within this range because experimental plots were under intensive conventional tillage for many years prior to this tillage experiment. The SOC concentration showed a trend towards higher stratification in NT and RT than in MP from 2008 to 2011. Significant and identical linear relationships between the SR of SOC and time were observed in NT and RT plots (0·031 per year), indicating a continuous SOC enrichment in top-soil over the 10-year tillage treatment period. Significant linear relationships between the SR of SOC and time were observed in NT and RT plots. Moreover, with time the SR of SOC under RT and NT increased at identical rates (0·031), indicating that 10-year NT and RT led to continuous SOC enrichment in the top-soil. This result was in agreement with the report by Sá & Lal (Reference Sá and Lal2009) in which stratification was shown to potentially increase with time until the soil was C-saturated. Sá et al. (Reference Sá, Cerri, Dick, Lal, Venske, Piccolo and Feigl2001) concluded that the SOC pool may stabilize about 40 years after NT adoption. In contrast, although the SR of SOC increased in MP soil, the rate of increase was much lower than in NT and RT soils. That is, MP caused a uniform distribution of SOC in the plough layer which is expected due to the annual mixing of soils in the plough layer (Diaz-Zorita & Grove Reference Diaz-Zorita and Grove2002; Franzluebbers Reference Franzluebbers2002). The same increases in SR of SOC for NT and RT in the present study do not mean that both tillage practices functioned the same on C sequestration in the long term for Black soils of Northeast China. The high SR of SOC for NT resulted from both SOC concentration increase in surface and decrease in subsurface whereas there was a greater SOC increase in surface soil and no decrease in subsurface soil under RT. Accordingly, RT showed more advantages in C sequestration than NT based on this long-term trial in Northeast China.
CONCLUSIONS
Tillage effects on soil BD, SOC concentration and SOC stock varied with both soil depth and time. The NT plot had the highest soil BD in the plough layer among the three tillage practices. The greatest impacts of tillage on SOC were limited to the upper 0·1 m layer. In the whole plough layer (0–0·2 m), RT had greater weighted average SOC concentration than MP and NT and showed a consistent increasing trend of SOC stock. Accordingly, RT had a higher potential for C accumulation than NT based on this 10-year trial in Northeast China. The larger SOC stock in RT than NT, and the same SR of SOC in RT and NT, indicates that SR of SOC, while a useful parameter in assessing soil quality, does not present a complete picture of SOC accumulation and should not be used as the sole criterion for evaluating SOC in different management systems.
This research was supported by the National Natural Science Foundation of China (No. 31170483 and 414308537), the Key Deployment Program of the Chinese Academy of Sciences (No. KZZD-EW-TZ-16-02), Foundation of Excellent Young Talents in Northeast Institute of Geography and Agroecology, Chinese Academy of Sciences (No. DLSYQ12003), and Youth Innovation Promotion Association, CAS (No. 2015183).