1 Introduction
The subject of roughness-induced transition in high-speed flows is of concern for practical geometries and vehicles. Manufactured surfaces have an inherent distributed roughness, and fasteners or sensors can result in patterns of isolated roughness elements. These necessary real-life features can make an otherwise smooth surface rough. Given that roughness is unavoidable on practical vehicles, it is critical to determine its impact on boundary-layer transition. To that end, the physical mechanisms by which roughness causes transition must be better understood and incorporated into transition models. The onset of transition may be caused by a variety of factors, including the enhancement of receptivity to the external disturbances (Casper et al. Reference Casper, Wheaton, Johnson and Schneider2011), the acceleration of the growth of existing instability modes such as an incident first mode in the boundary layer (Choudhari et al. Reference Choudhari, Li, Chang, Norris and Edwards2013), and the wake instabilities induced by the roughness itself (Wheaton & Schneider Reference Wheaton and Schneider2012, Reference Wheaton and Schneider2014).
Current methods of predicting transition location resulting from roughness include algebraic methods and semi-empirical methods. Algebraic methods empirically correlate some transition parameter with a disturbance parameter. Because the parameter space in which roughness can be defined is large, algebraic correlations typically require tuning or biasing the correlations for each environment, geometry and roughness type (isolated versus distributed) (Reda Reference Reda2002; Berry & Horvath Reference Berry and Horvath2008; Schneider Reference Schneider2008; King, Kegerise & Berry Reference King, Kegerise and Berry2009). Semi-empirical methods are also currently being developed for instabilities in the wake of these roughness elements (Choudhari et al. Reference Choudhari, Li, Chang, Norris and Edwards2013; Sharma et al. Reference Sharma, Drews, Kuester, Goldstein and White2014; Suryanarayanan et al. Reference Suryanarayanan, Goldstein, Brown, Berger and White2017). However, to develop these methods, more information is required to determine which instabilities dominate in the wake of a roughness element.
Different types of instabilities can be found in the wake of small symmetric roughness elements. These wake instabilities are typically defined as an antisymmetric (odd, sinuous) mode or a symmetric (even, varicose) mode for a symmetric roughness element. The wake of a roughness element is typically characterized by an upwelling of fluid creating mushroom-like structures in the mean flow. These secondary flow structures are created by the shear forces in the fluid. The antisymmetric mode is found in regions where the spanwise shear is dominant, typically on either side of the upwelling of fluid behind the roughness element. The symmetric mode is found in the regions where the wall-normal shear dominates, typically centred at the top of the upwelling of fluid behind the roughness element (Choudhari et al. Reference Choudhari, Li, Wu, Chang, Edwards, Kegerise and King2010). For asymmetric roughness elements, there are similar families of instability modes, but they are not generally referred to as symmetric or antisymmetric modes, due to the lack of symmetry in the wake.
Some direct numerical simulations have been performed for a single symmetric isolated roughness element on a flat plate at Mach 3.5 (Balakumar & Kegerise Reference Balakumar and Kegerise2016). These simulations showed the effect of two-dimensional and three-dimensional disturbances interacting with the roughness element. Symmetric isolated roughness elements such as a diamond planform can produce symmetric wakes when the free-stream disturbances interacting with the roughness are considered to be two-dimensional. This produces the even and odd modes described in Choudhari et al. (Reference Choudhari, Li, Wu, Chang, Edwards, Kegerise and King2010). When a planar wave at an angle interacts with the roughness element, the disturbance field in the wake of the roughness element skews along the same direction as the inclined plane wave. The mean flow supports both the odd and even eigenmodes and the inclined plane wave seeds both modes (Balakumar & Kegerise Reference Balakumar and Kegerise2016). The shapes of the eigenmodes appear skewed relative to those for an entirely two-dimensional flow field.
Studies of these instability modes in the wake of isolated roughness elements have shown good agreement between experiments and computations (Kegerise et al. Reference Kegerise, King, Owens, Choudhari, Norris, Li and Chang2012). An experiment by Kegerise et al. (Reference Kegerise, King, Choudhari, Li and Norris2014) showed the effect of a single roughness element with different planforms on the growth of disturbances downstream. These roughness elements all had a consistent frontal area, and a roughness height of approximately 48 % of the boundary layer thickness for a nominal roughness Reynolds number of 462. Kegerise et al. were able to make detailed surveys downstream of the isolated roughness elements to determine the instability modes present in the wake. These were compared to linear stability theory, and, for the case of the diamond planform roughness element, good agreement between the computations and experiments occurred close to the roughness element where linear growth occurred. However, once the instabilities in the wake became nonlinear, the comparison of the measurements to the linear stability theory no longer matched. The measured instability growth rates for the asymmetric planform were lower than those for the symmetric planform, so transition onset was delayed relative to the symmetric planform (Kegerise et al. Reference Kegerise, King, Choudhari, Li and Norris2014).
Studies of isolated roughness elements provide useful information regarding the types of instabilities generated by roughness, but real-world application requires the study of the interaction of these instabilities for surfaces with multiple roughness elements or both a distributed and isolated roughness. The study of the physics of pseudo-random distributed roughness has been extensively carried out in subsonic flow by an experimental group at Texas A&M University (Downs, White & Denissen Reference Downs, White and Denissen2008; Kuester et al. Reference Kuester, White, Sharma, Goldstein and Brown2014) and a computational group at the University of Texas (Drews et al. Reference Drews, Downs, Doolittle, Goldstein and White2011; Sharma et al. Reference Sharma, Drews, Kuester, Goldstein and White2014; Suryanarayanan et al. Reference Suryanarayanan, Goldstein, Brown, Berger and White2017). Much of this work has shown that a distributed roughness pattern seems to be defined primarily by its most prominent features (Downs et al. Reference Downs, White and Denissen2008; Drews et al. Reference Drews, Downs, Doolittle, Goldstein and White2011) and that the presence of a distributed roughness can shield an isolated roughness (Kuester et al. Reference Kuester, White, Sharma, Goldstein and Brown2014). Careful design of the surface roughness and careful probing of the flow field behind the roughness patterns in the Klebanoff–Saric Wind Tunnel at Texas A&M University have produced measurements that can be compared to matching computations (Downs et al. Reference Downs, White and Denissen2008; Drews et al. Reference Drews, Downs, Doolittle, Goldstein and White2011; Kuester et al. Reference Kuester, White, Sharma, Goldstein and Brown2014). Work by Suryanarayanan et al. (Reference Suryanarayanan, Goldstein, Brown, Berger and White2017) also showed a cancellation effect if one roughness patch downstream had a similar shape but the opposite orientation to the upstream patch.
Early work by Carmichael (Reference Carmichael1958) included the measurement of the transition Reynolds number on a flat plate due to the presence of arrays of roughness elements in a subsonic facility. Carmichael investigated the effect of grids of cylindrical roughness elements, streamwise rows of roughness and spanwise rows of roughness. In that investigation, he also varied the heights and diameters of the roughness elements in the different configurations. For the streamwise arrays of roughness, Carmichael found that there was less of an effect and probably less interaction between roughness elements spaced more than three diameters apart. Noting that the parameter space to study was large, Carmichael examined only the transition location for these patterns of roughness elements.
The interaction between arrays of discrete roughness elements in high-speed flow was also studied in computational and experimental efforts. Choudhari et al. (Reference Choudhari, Li, Wu, Chang, Edwards, Kegerise and King2010) looked at the effect of tandem roughness trips of the same height with diamond-shaped planforms. The computations examined the effect of height on the amplitude of the streaks downstream of the roughness trips. The addition of a downstream isolated roughness had an effect on the streak amplitude when the roughness was short ( $k/\unicode[STIX]{x1D6FF}_{0.995}=0.15$) and less of an effect on the streak amplitude when the roughness was taller (
 $k/\unicode[STIX]{x1D6FF}_{0.995}=0.37$). Choudhari et al. proposed that this is due to the ability of the flow field to recover after the first short roughness trip and the receptivity of the second short roughness trip to the wake behind the first roughness trip.
Direct numerical simulations have also been performed for a roughness patch on a flat plate at Mach 3.5 by Choudhari, Li & Paredes (Reference Choudhari, Li and Paredes2018). This roughness patch was a series of sinusoidal humps as described by Muppidi & Mahesh (Reference Muppidi and Mahesh2012) over a finite length near the neutral point of the flat plate. Choudhari et al. (Reference Choudhari, Li and Paredes2018) investigated the effects of the length of the finite patch and the effect of dimples versus protuberances, and then determined the types of modes that were generated in the wake. The modes in the wake of the roughness patch were identified as two different subharmonics of the antisymmetric mode (AS and SA), a fundamental antisymmetric mode (AA) and a fundamental symmetric mode (SS) that eventually became a first mode. The most amplified mode was the AA mode, which occurred at approximately 60 kHz. The roughness patch that had only sinusoidal protuberances from the surface and no dimples had weaker streaks than the roughness patch that had both protuberances and dimples of the same height. However, doubling the protuberance-only patch height yielded stronger streaks than the roughness patch that had a peak-to-valley height of the same amount. This study indicates that protuberances and dimples have different effects on transition in the wake of these roughness patches, so it is necessary to consider both forms of roughness.
The measurement of instabilities in the wake of a streamwise array is desirable to study the effect of interactions between roughness elements before studying the more complex arrangements of spanwise–streamwise grids of roughness elements. This paper discusses hot-wire measurements of instabilities behind streamwise arrays of roughness elements. For the case of circular roughness elements (CREs), the dominant instabilities in the wake and the effect of the height and spacing of these roughness elements is investigated to gain better understanding of transition in a symmetric wake. The wake of tandem rectangular roughness elements (RREs) oriented at a  $45^{\circ }$ angle relative to the leading edge of a flat plate were also measured to investigate the effect of asymmetry. The mean mass flux, total temperature and fluctuating mass flux were measured behind these arrays of roughness elements with a hot wire. These measurements were used to determine the type of instabilities present in the wake of these roughness elements. The mean-flow properties were used to show the mean-flow distortion and the relative shear in the mass flux behind the roughness elements. The fluctuating mass flux was used to identify instabilities present in the wake of these roughness elements and to determine the growth of these instabilities.
2 NASA Langley Supersonic Low Disturbance Tunnel
These experiments were conducted in the NASA Langley Research Center Supersonic Low Disturbance Tunnel (SLDT), a Mach 3.5 quiet flow facility (Beckwith et al. Reference Beckwith, Creel, Chen and Kendall1983). A two-dimensional nozzle with exit dimensions of 15.24 cm by 25.40 cm was used in the SLDT. As a quiet tunnel, the free-stream disturbance level is low enough in this facility to ensure that measurements on the model are not influenced by the radiation of acoustic noise from the nozzle walls. The facility is a blowdown tunnel and the existing infrastructure (compressors, vacuum pumps, vacuum spheres, etc.) enables the facility to be operated for extended periods of time. At sufficiently low free-stream stagnation pressure, this runtime can be on the order of hours. The extended runtime enabled extensive probing of the flow field and allowed for the model to reach an equilibrium temperature before the flow field was examined.
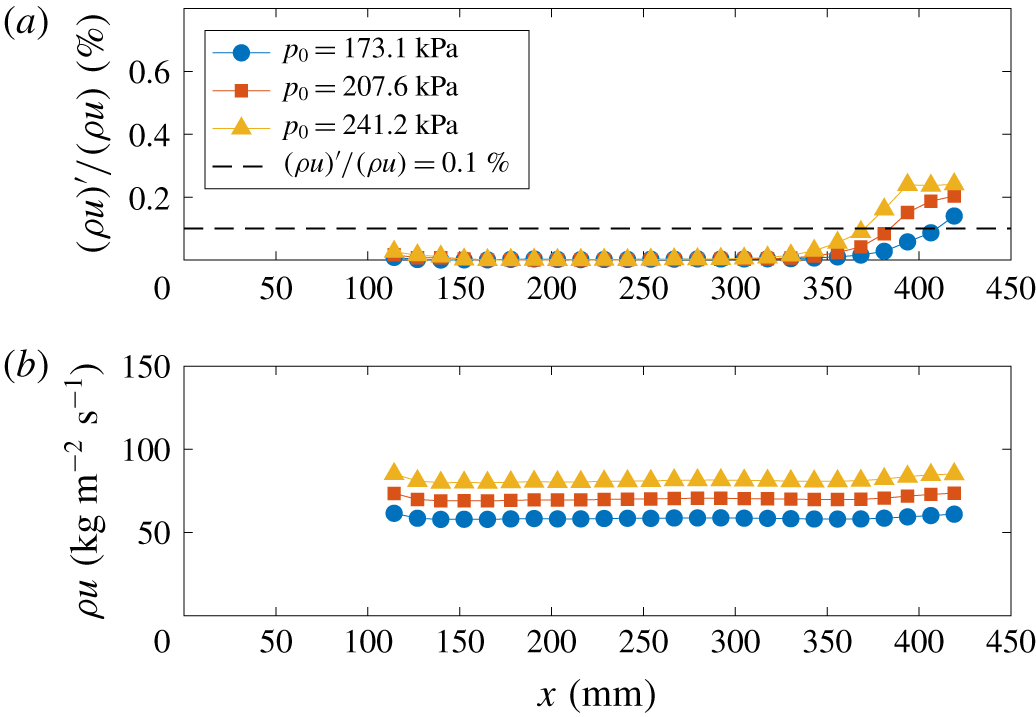
The data shown in figure 1 correspond to the hot-wire measurements that were made along the centreline of the SLDT. Only three conditions are shown, corresponding to the nominal stagnation pressure and temperature used for the experiment and two other conditions at stagnation pressures approximately 16 % higher and lower. These data are plotted against  $x$ in figure 1, which is the distance from the nozzle throat in this figure. The root-mean-square (r.m.s.) mass-flux fluctuations are plotted in figure 1(a), where the dashed line at 0.1 % indicates the threshold above which the flow is no longer considered to be ‘quiet’. A majority of the measurements along the centreline are on the order of the electronic noise of the constant-temperature anemometer. As the stagnation pressure increases, the location where increased free-stream fluctuations are greater than 0.1 % of the mean moves upstream. The mean mass flux is plotted in figure 1(b) and shows that the flow becomes uniform at a location approximately 125 mm from the throat. The performance of the nozzle is similar to the performance measured by Kegerise et al. (Reference Kegerise, King, Choudhari, Li and Norris2014).
Measurements with a hot wire of (a) the r.m.s. mass-flux fluctuations and (b) the mean mass-flux fluctuations along the centreline of the SLDT: Mach number 3.5,  $T_{0}=319.3~\text{K}$.

The stagnation pressure for this experiment was nominally  $206.8\pm 2.6~\text{kPa}$ and the stagnation temperature was
 $319.3\pm 2.1~\text{K}$. Thus, the free-stream velocity was approximately 675 m s-1. At these conditions, the free-stream mass-flux fluctuations stayed well below 0.05 % on the centreline until a location approximately 360 mm from the nozzle throat. No measurements in this experiment occurred downstream of a location approximately 360 mm from the throat, to ensure that the measurements would not be affected by the influence of acoustic radiation emanating from the nozzle walls.
3 Flat-plate model
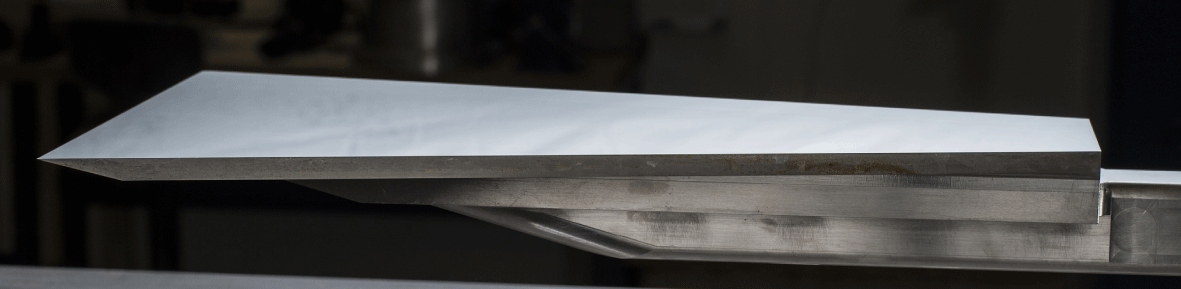
The flat-plate model was positioned so that the nominally sharp leading edge of the plate was 140 mm from the nozzle throat, which is well within the uniform flow region. The flat plate was 228.6 mm wide at the leading edge and 406.4 mm long. The sides of the flat plate were tapered to reduce edge effects, so the trailing edge of the flat plate was 76.2 mm wide. Measurements on the flat-plate model were taken within the quiet core of the facility, so the measurement region ended at 218.4 mm from the leading edge of the plate. This helped to reduce ambiguity regarding the effects of the free-stream disturbance level. The upper surface of the plate, where roughness elements were applied and measurements were made, was polished to a mirror finish (0.025 μm r.m.s. roughness). A picture of the flat-plate model is provided in figure 2.
A side view of the polished flat plate. The measurement surface is towards the top of the picture.

4 Roughness elements and configurations
Roughness elements were fabricated from polyester plastic shim stock using a laser ablation technique to cut uniform elements. The roughness elements were applied to the flat plate using a template to ensure consistent alignment between each of the elements in the array. A low-viscosity cyanoacrylate glue was used to affix each roughness element to the flat plate. The farthest upstream roughness element was always centred at  $x=41.5~\text{mm}$ from the leading edge of the flat plate, where the boundary layer thickness was approximately 0.683 mm. The application template included cutouts for roughness elements spaced 7.16 mm (two diameters or two rectangle lengths) from each other in the streamwise direction.
Two different roughness heights  $k$ of the CREs were tested for each of the configurations of streamwise arrays. These heights were nominally 140 μm and 280 μm, corresponding to approximately 20 % and 40 % of the boundary layer thickness at
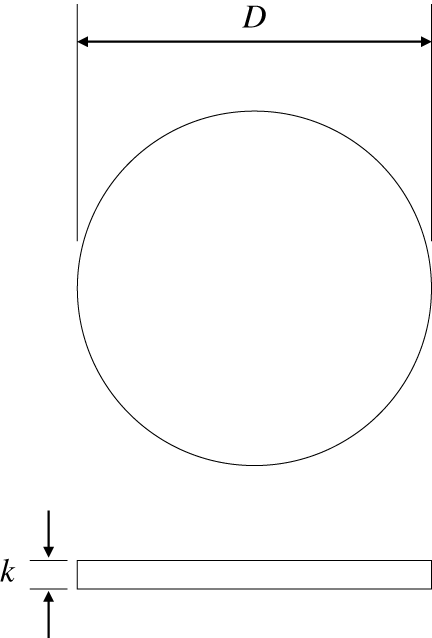
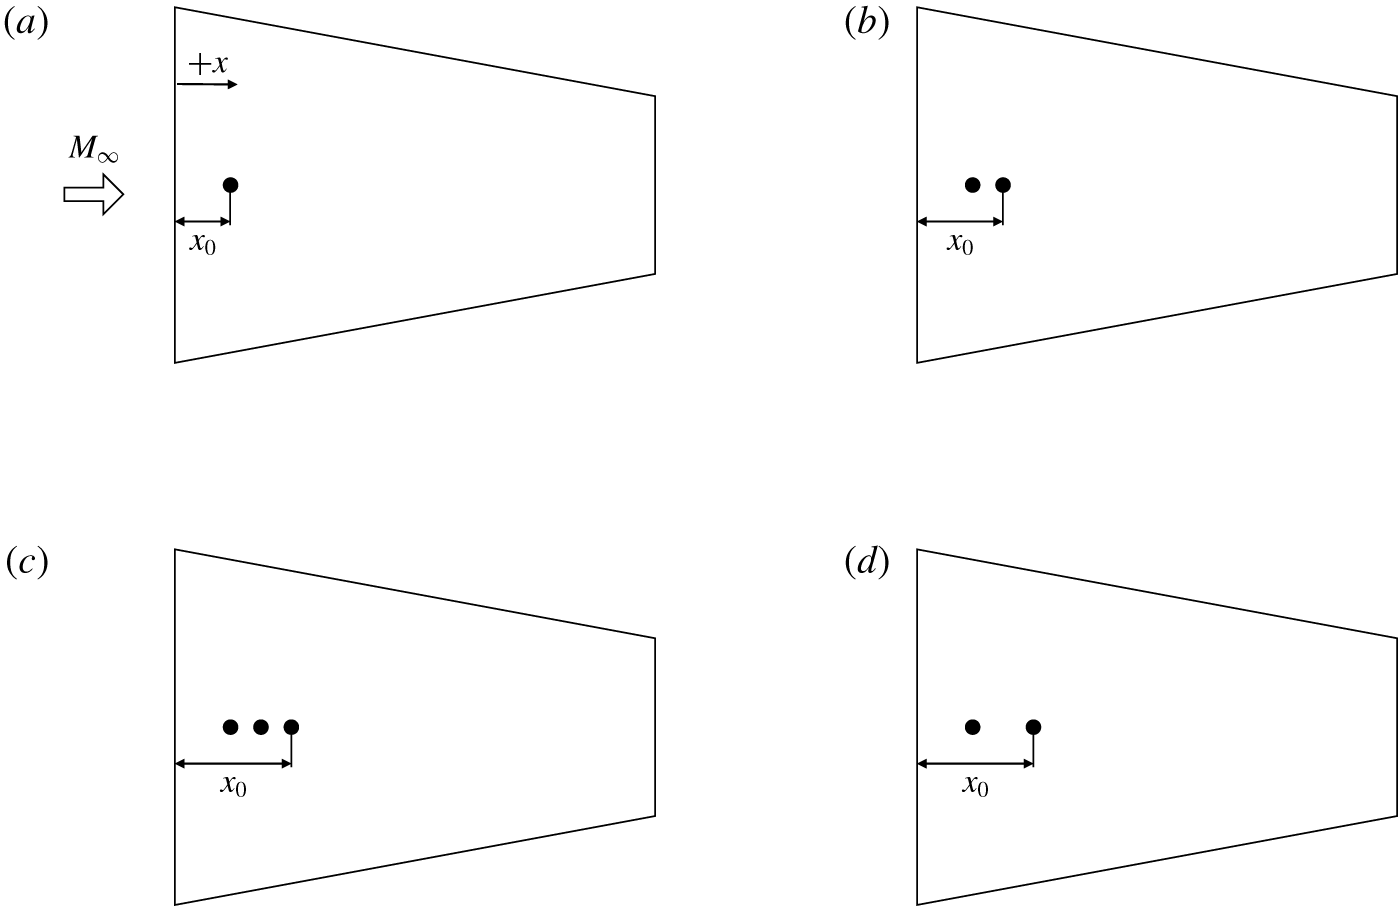
 $x=41.5~\text{mm}$, the most upstream roughness element location. The heights of these roughness elements were verified with a stylus-based surface roughness tester, showing a variation of approximately ±3 μm for the 140 μm height and ± 8 μm for the 280 μm height. The diameter of the CREs was approximately 3.58 mm; a schematic of the CREs is provided in figure 3. Four configurations of the streamwise arrays of CREs were tested and are shown in figure 4.
A schematic of the CREs used and relevant dimensions (not to scale).

A schematic of the different configurations of CREs tested: (a) a single CRE, (b) two CREs spaced  $2D$ apart, (c) three CREs each spaced
 $2D$ apart, and (d) two CREs spaced
 $4D$ apart.

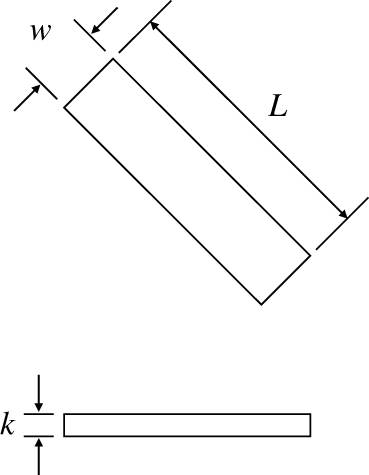
Only 280-μm-tall roughness elements were tested for the RREs. As with the CREs, the height of the RREs was verified with a surface roughness tester, and shown to vary by ± 7 μm for each of the elements tested. These roughness elements had a 3 : 1 aspect ratio, with a width  $w$ of 1.19 mm and a length
 $L$ of 3.58 mm (figure 5). Each of the RREs was oriented so that the longest side was rotated to be either
 $+45^{\circ }$ from the leading edge or
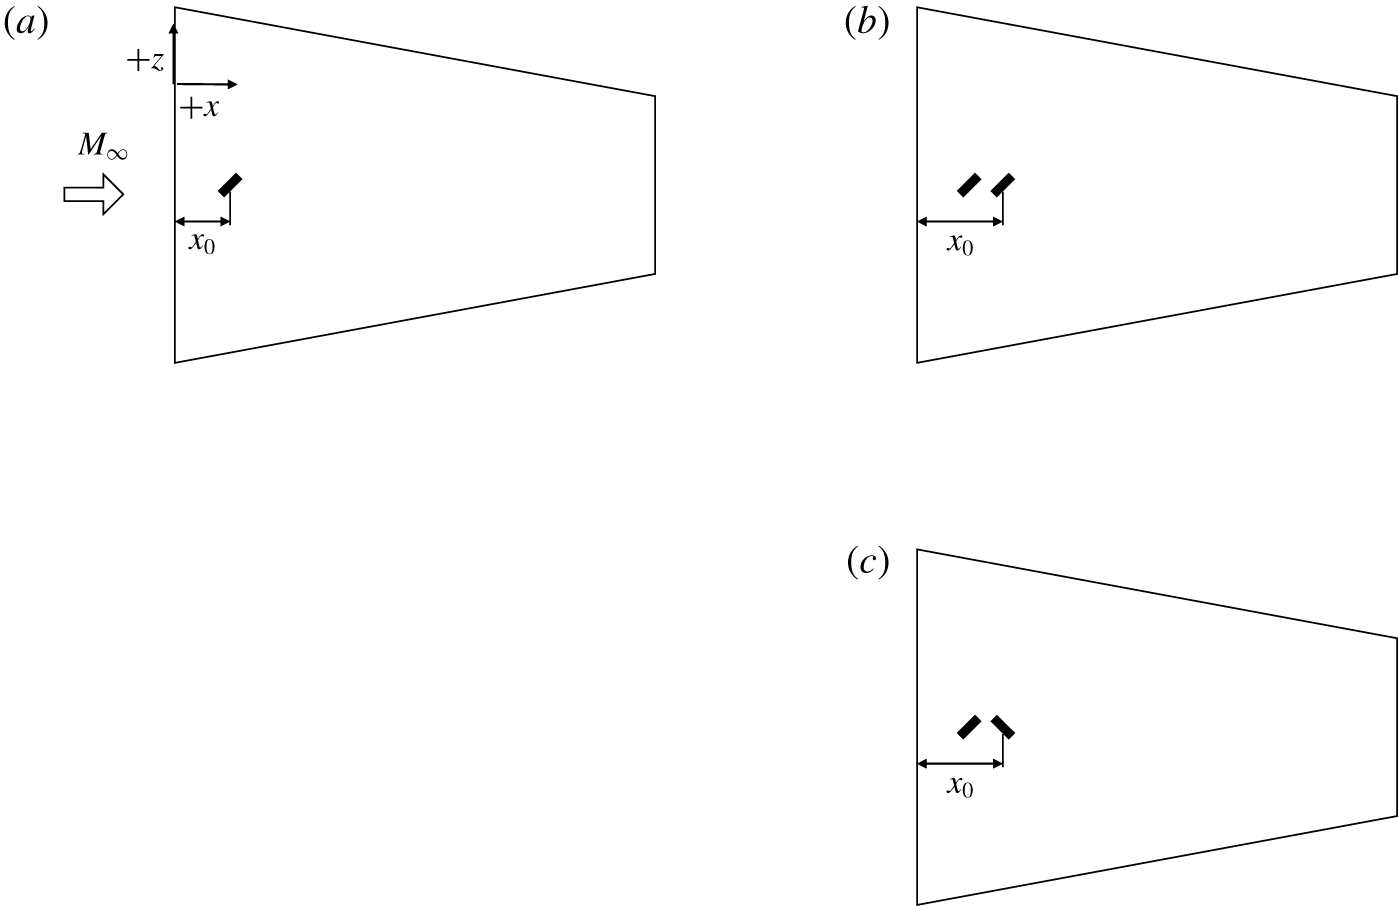
 $-45^{\circ }$ from the leading edge. Only three configurations of the streamwise arrays of RREs were tested, and these configurations are shown in figure 6.
A schematic of the RREs used, oriented + 45° from the leading edge, and relevant dimensions (not to scale). Flow direction is from top to bottom of page.

A schematic of the different configurations of RREs tested: (a) a single RRE oriented + 45° from the leading edge, (b) two RREs with the same orientation of + 45°, and (c) two RREs with opposite orientations of + 45° and - 45°.

5 Hot-wire anemometry
Measurements of the free-stream mass-flux fluctuations in the SLDT were made with a single normal hot wire in the empty tunnel. The wire was oriented so that the sensing element was approximately perpendicular to the flat sidewalls of the nozzle. The hot wire was a platinum-plated tungsten wire that was 5 μm in diameter and approximately 1.25 mm long. These measurements were made with a constant-temperature anemometer with a symmetric bridge and a high overheat ratio of 0.75 to be sensitive to mass-flux fluctuations. The signals were sampled at 500 kHz for 2 s after passing through a signal conditioner with a low-pass filter cutoff at 200 kHz and a high-pass filter cutoff at 100 Hz. Mean measurements of the hot-wire voltage were recorded with a digital voltmeter.
Hot-wire anemometry was also used to probe the boundary layer in the wake of the roughness elements, following the approach documented by Kegerise, Owens & King (Reference Kegerise, Owens and King2010). The sensing element for the boundary-layer probes was a 3.8 μm platinum-plated tungsten wire with a nominal length of 0.5 mm. The hot wires were tuned to have a bandwidth of approximately 370 kHz. The hot wire was operated at a high overheat ratio of approximately 0.75 in order to be more sensitive to mass flux. The cold-wire resistance was also measured at each measurement station to correct for the total temperature change in the boundary layer. The measurements were passed through a signal conditioner that had a low-pass filter cutoff at 400 kHz and a high-pass filter cutoff at 1 kHz. The signal was sampled at 1 MHz for 1 s at each measurement location.
6 Mean measurements of the wake of the roughness elements
Hot-wire voltages and cold-wire resistances were converted to mass flux and total temperature, as detailed in Kegerise et al. (Reference Kegerise, Owens and King2010). The mean mass-flux and total-temperature values are presented as contour plots of measurements made in the  $yz$ plane for each streamwise station
 $x$, where
 $y$ is the wall-normal location and
 $z$ is the spanwise location. The
 $z$ direction is marked in figure 6(a) for clarity. Measurements in the streamwise direction
 $x$ are referenced to the location of the most downstream roughness element
 $x_{0}$ and normalized by the diameter
 $D$ of the CREs or the length
 $L$ of the RREs.
6.1 Mass-flux and total-temperature profiles
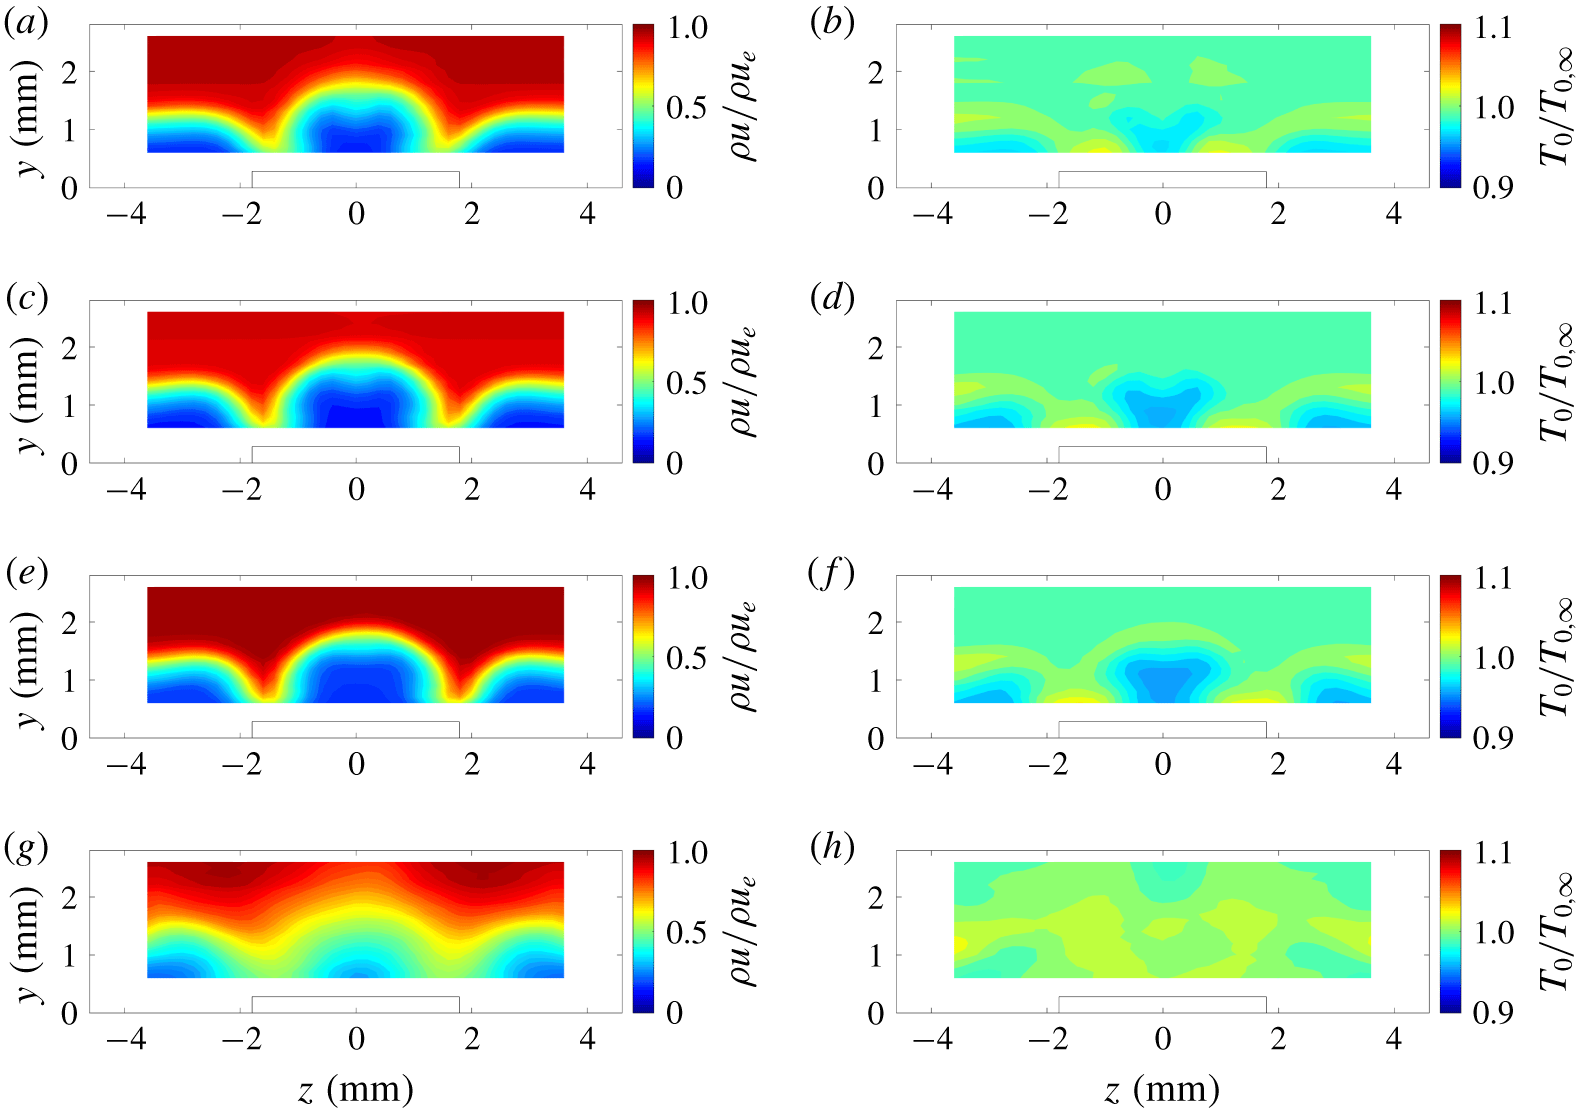
Profiles at  $x=179.7~\text{mm}$ behind the arrays of CREs with a nominal height of 140 μm are shown for the mean mass flux and the mean total temperature in figures 7(a,c,e,g) and 7(b,d,f,h), respectively. The relative location of the roughness elements is depicted in the plots by a solid black line. Each row in figure 7 shows a different configuration of CREs, corresponding to the order given in figure 4. Note that the streamwise measurement station relative to the leading edge is held constant, but the relative distance between the most downstream roughness element and the streamwise measurement station changes with each configuration. In general, these contour plots show relatively weak mean-flow distortion behind the CREs, regardless of the number of elements and the spacing between the elements.
Mean mass-flux contours (a,c,e,g) and mean total temperature contours (b,d,f,h) in the wake of arrays of CREs with  $k\approx 140~\unicode[STIX]{x03BC}\text{m}$: (a,b) a single CRE (
 $x-x_{0}=38.6D$), (c,d) two CREs spaced
 $2D$ apart (
 $x-x_{0}=36.6D$), (e,f) three CREs each spaced
 $2D$ apart (
 $x-x_{0}=34.6D$), and (g,h) two CREs spaced
 $4D$ apart (
 $x-x_{0}=34.6D$).

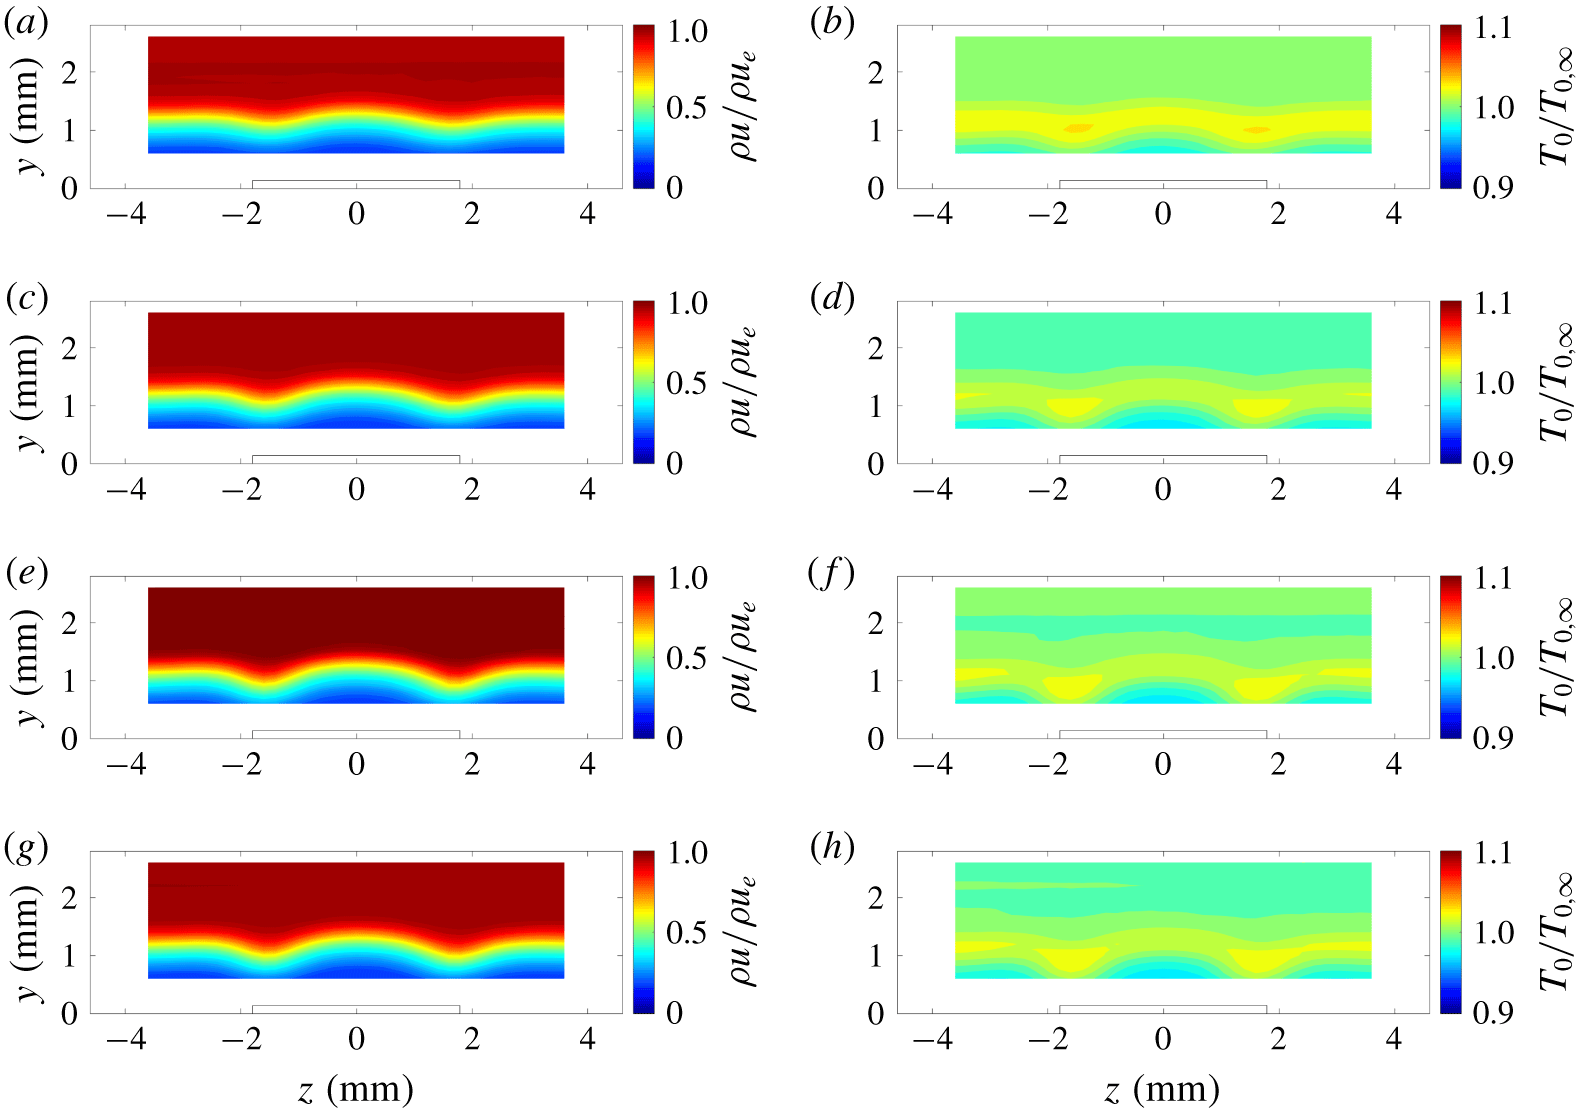
Similar features are observed in the mean flow in figure 7 for all of the configurations with a roughness height of 140 μm. The wake is characterized by an upwelling of fluid near the centreline and a higher mass-flux region on either side of the roughness element, at approximately  $z=\pm 1.5~\text{mm}$. The total temperature profile shows a higher temperature in these high-mass-flux regions, which corresponds to two hot streaks on either side of the CREs.
A similar comparison of the mass-flux and total-temperature profiles behind the taller CREs with a nominal height of 280 μm are shown for streamwise locations of  $x=110.6~\text{mm}$ and 179.7 mm in figures 8 and 9, respectively. Differences in each of the different streamwise stations are more apparent in the wake of these taller CREs. At a location of
 $x=110.6~\text{mm}$ (figure 8), the mean mass-flux and total-temperature profiles of the different configurations of taller CREs still appear similar in shape to each other. However, compared to measurements behind the shorter CREs, there is a significant increase in the mean-flow distortion behind these CREs.
Mean mass-flux contours (a,c,e,g) and mean total temperature contours (b,d,f,h) in the wake of arrays of CREs with  $k\approx 280~\unicode[STIX]{x03BC}\text{m}$ at
 $x=110.6~\text{mm}$: (a,b) a single CRE (
 $x-x_{0}=19.3D$), (c,d) two CREs spaced
 $2D$ apart (
 $x-x_{0}=17.3D$), (e,f) three CREs each spaced
 $2D$ apart (
 $x-x_{0}=15.3D$), and (g,h) two CREs spaced
 $4D$ apart (
 $x-x_{0}=15.3D$).

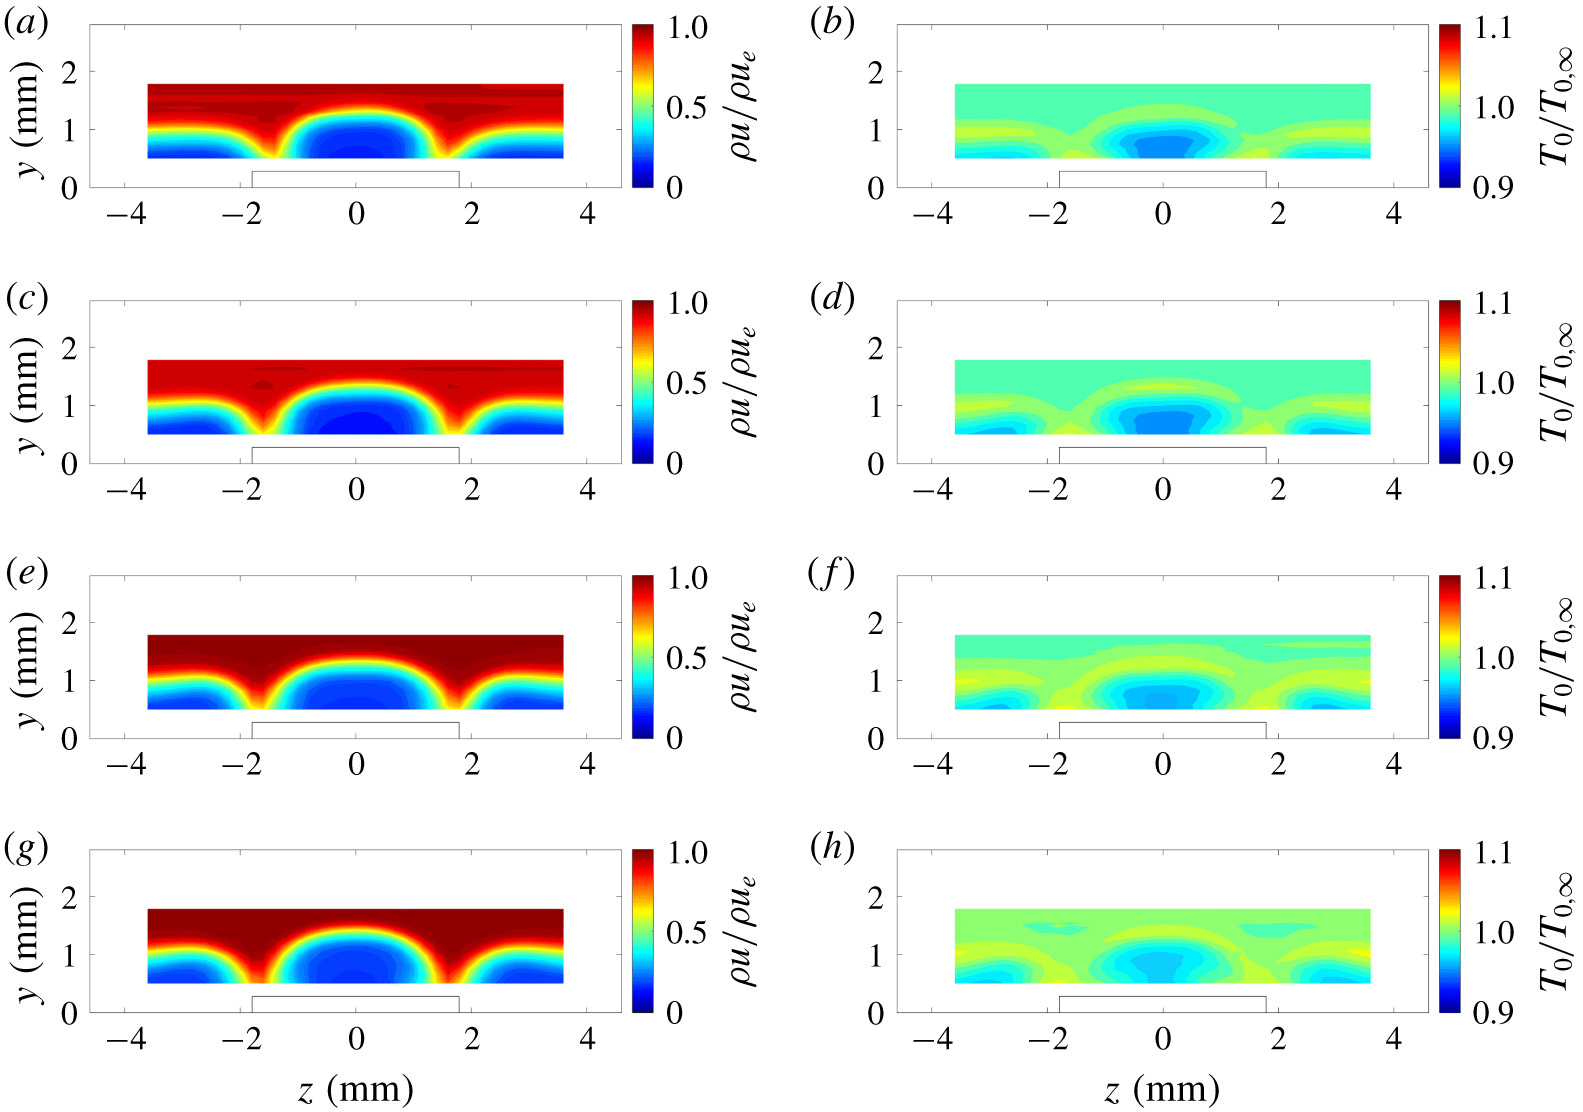
At  $x=179.7~\text{mm}$ (figure 9), the mean mass-flux and total temperature profiles show a larger amount of distortion in the wake of the taller CREs than is observed in the wake of the shorter CREs. The first three configurations look relatively similar in character: a large region of fluid upwelling is present along the centreline of the wake of the roughness element, and there is a deficit in fluid and high-temperature streaks to either side of the centreline in the wake of the roughness element. The higher-temperature regions appear to be spaced apart by approximately the same width as the diameter of the CREs. The wakes behind the single CRE in figure 9(a) and the two CREs in figure 9(b) appear to be slightly more diffuse along the centreline. The fourth configuration, which is two CREs spaced
 $4D$ apart, shows less mean-flow distortion across the span and an overall thickening of the boundary layer when compared to the other three configurations of tall CREs. These attributes are consistent with a transitional or a turbulent boundary layer.
Mean mass-flux contours (a,c,e,g) and mean total temperature contours (b,d,f,h) in the wake of arrays of CREs with  $k\approx 280~\unicode[STIX]{x03BC}\text{m}$ at
 $x=179.7~\text{mm}$: (a,b) a single CRE (
 $x-x_{0}=38.6D$), (c,d) two CREs spaced
 $2D$ apart (
 $x-x_{0}=36.6D$), (e,f) three CREs each spaced
 $2D$ apart (
 $x-x_{0}=34.6D$), and (g,h) two CREs spaced
 $4D$ apart (
 $x-x_{0}=34.6D$).

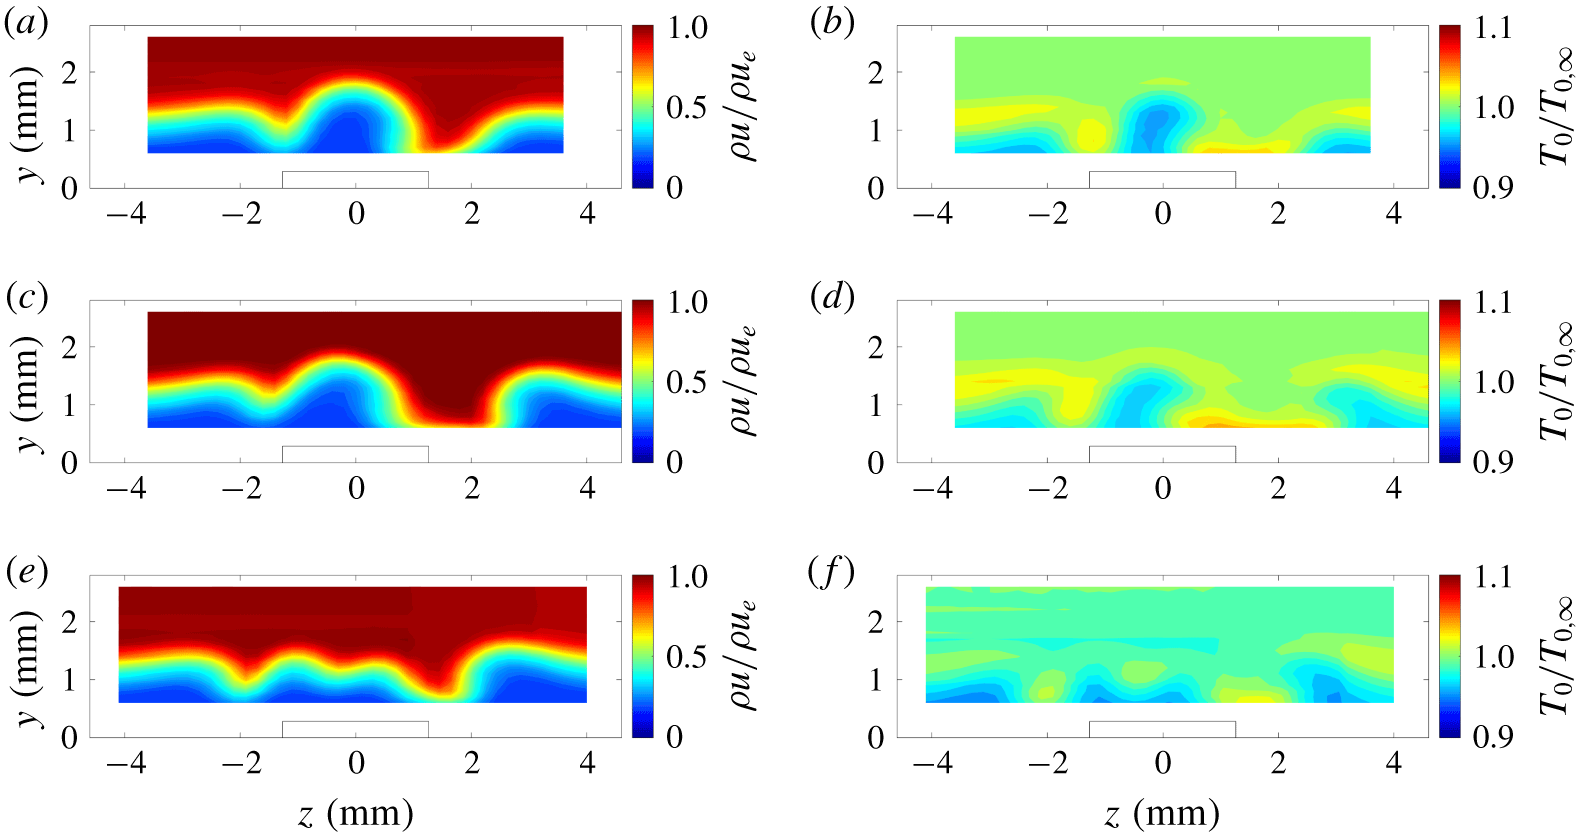
The mass-flux and total-temperature profiles behind the RREs at a location of  $x=179.7~\text{mm}$ from the leading edge are shown in figures 10(a,c,e) and 10(b,d,f), respectively. Each row shows a different configuration corresponding to the order shown in figure 6. In general, the first two configurations show similar features in the mass flux behind the RREs as was observed in the wake of the tall CREs. There are high-mass-flux regions to either side of the roughness element and an upwelling of fluid in the middle of these regions. Unlike the CREs, however, the centre of the upwelling of fluid is shifted towards the
 $-z$ direction and this low-mass-flux region appears tilted towards the
 $+z$ direction. Near
 $z=2~\text{mm}$, there is a high-mass-flux region for all of the configurations, which is accompanied by a hot streak in the temperature profiles. This region seems to be widest for the configuration with two RREs with the same orientation. The total temperature increase in this deficit also appears to have a larger spanwise extent in the wake of the two RREs with the same orientation. The third case with two RREs with opposite orientations appears to have less overall mean-flow distortion and appears to have lower total temperature variation in the wake than the other two configurations of RREs.
Mean mass-flux contours (a,c,e) and mean total temperature contours (b,d,f) in the wake of arrays of CREs with  $k\approx 280~\unicode[STIX]{x03BC}\text{m}$: (a,b) a single RRE rotated + 45° from the leading edge (
 $x-x_{0}=38.6D$), (c,d) two RREs spaced
 $2L$ apart, both rotated + 45° (
 $x-x_{0}=36.6D$), and (e,f) two RREs spaced
 $2L$ apart rotated - 45° and + 45° from the leading edge (
 $x-x_{0}=36.6D$).

6.2 Streak strength profiles
The streak strength of these spanwise profiles is used to quantify the amount of mean-flow distortion in the wake of the roughness elements at each streamwise  $x-x_{0}$ station. The streak strength is defined by Fransson et al. (Reference Fransson, Brandt, Talamelli and Cossu2004) as the wall-normal maximum of the peak-to-peak difference between the streamwise velocities,
 $$\begin{eqnarray}A_{ST}(y)={\textstyle \frac{1}{2}}\max _{y}\{U(y)_{high}-U(y)_{low}\},\end{eqnarray}$$
where  $U(y)_{high}$ and
 $U(y)_{low}$ are the velocity profiles in a high-speed and low-speed streak region, respectively. The streak strength in this paper is based on
 $\unicode[STIX]{x1D70C}u$ because the hot-wire measurements are sensitive to mass flux in compressible flow. For the following data, the streak strength profile is defined as
 $$\begin{eqnarray}A_{\unicode[STIX]{x1D70C}u}(y)={\textstyle \frac{1}{2}}(\unicode[STIX]{x1D70C}u(y)_{high}-\unicode[STIX]{x1D70C}u(y)_{low}),\end{eqnarray}$$
and the streak amplitude is defined as the wall-normal maximum of the streak strength profile. These streak strength profiles are non-dimensionalized by the edge mass flux of the profiles, and the height in the boundary layer is non-dimensionalized by the boundary layer parameter
 $$\begin{eqnarray}\unicode[STIX]{x1D702}=y\sqrt{\frac{Re}{x}},\end{eqnarray}$$
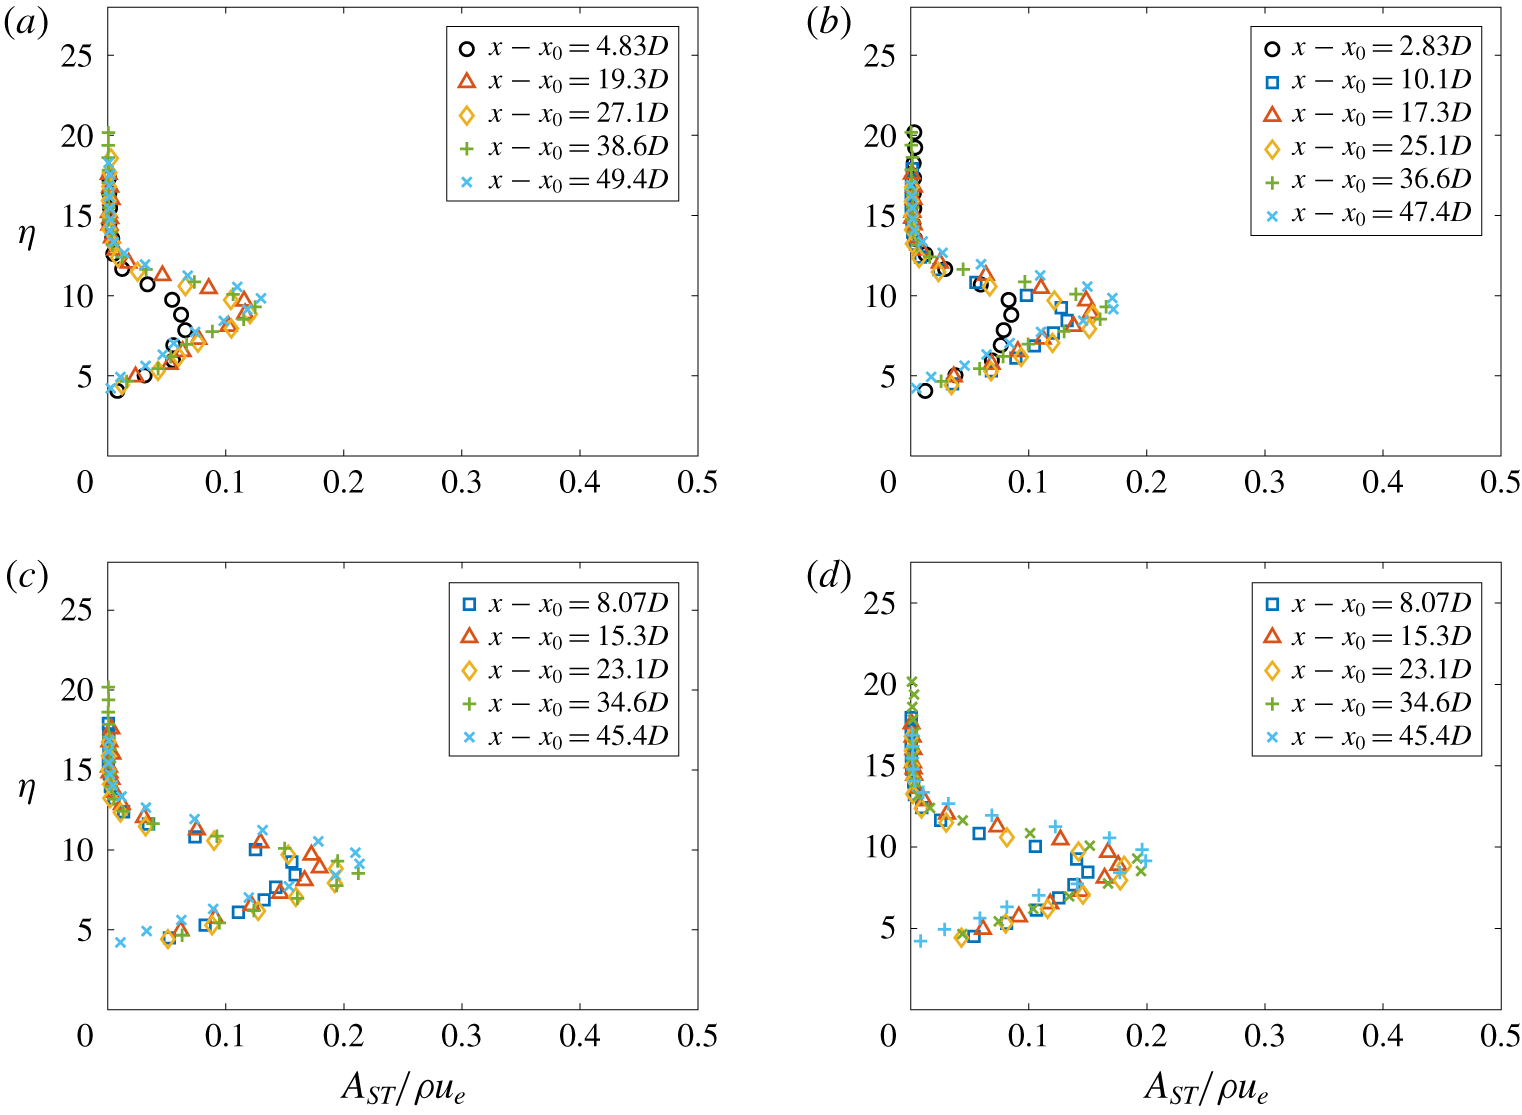
where  $Re$ is the free-stream unit Reynolds number. Streak strength profiles and streak amplitudes were used to quantify the amount of mean-flow distortion in the wake of each configuration of CREs. As expected from the profiles shown in figure 7, the streak strength profiles given in figure 11 show similar mean-flow distortion for each of the CRE configurations tested for the entire measurement region. The maximum streak amplitude in the measurement region ranges from approximately 0.13 for the single CRE configuration (figure 11a) to approximately 0.2 for the configuration with two CREs spaced
 $4D$ apart (figure 11d).
Streak strength profiles in the wake of arrays of CREs with  $k\approx 140~\unicode[STIX]{x03BC}\text{m}$ at
 $x=179.7~\text{mm}$: (a) a single CRE (
 $x-x_{0}=38.6D$), (b) two CREs spaced
 $2D$ apart (
 $x-x_{0}=36.6D$), (c) three CREs each spaced
 $2D$ apart (
 $x-x_{0}=34.6D$), and (d) two CREs spaced
 $4D$ apart (
 $x-x_{0}=34.6D$).

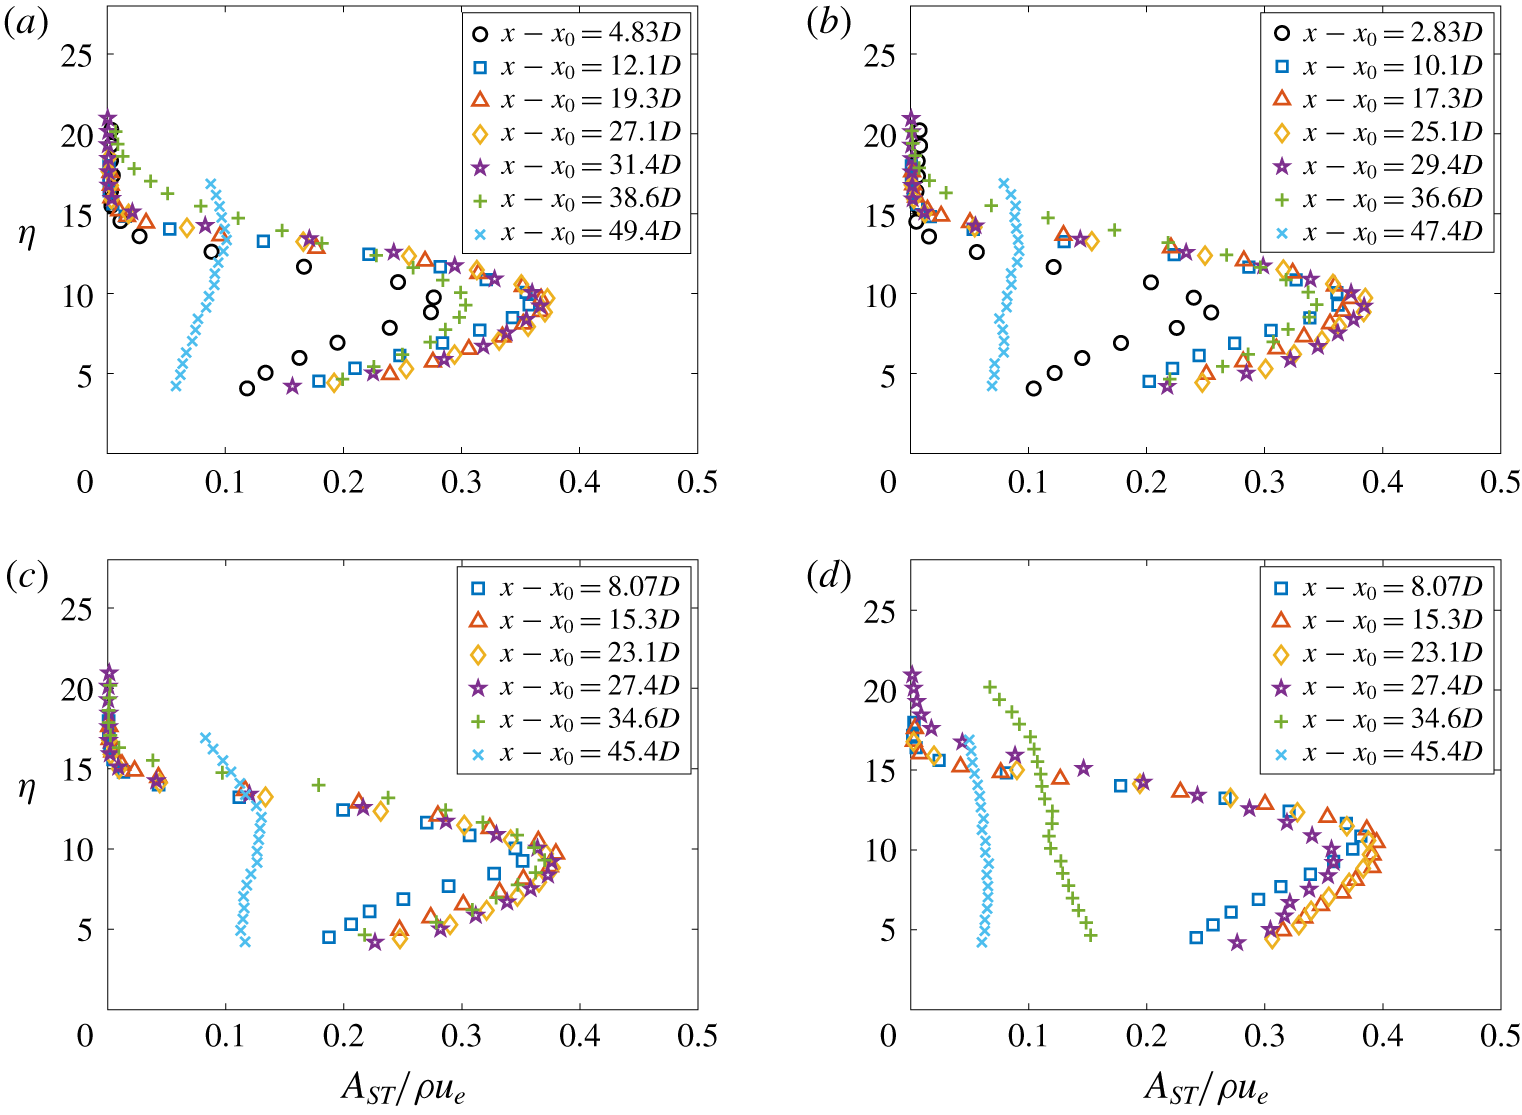
Streak strength profiles behind the taller CREs are shown in figure 12. The 280-μm-tall elements have a peak in the streak strength profiles that appears broader than the peak seen in the streak strength profiles taken from behind the 140-μm-tall elements. The streak strength profile broadens even further at locations more than 30 $D$ downstream, and where this broadening occurs depends on the configuration of roughness elements. Unlike the streak strength profiles behind the 140-μm-tall elements, the streak strength profiles behind the 280-μm-tall elements flatten out at the farthest downstream measurement stations. The streak strength profiles for the fourth configuration of two CREs spaced
 $4D$ apart (figure 12d) appear to broaden and flatten well before the other configurations of streamwise arrays. This effect indicates that the streak amplitude has decreased and that the relative mean-flow distortion is less as a result of transition. Further evidence of transition for this configuration is presented in the following sections of this paper.
Streak strength profiles in the wake of arrays of CREs with  $k\approx 280~\unicode[STIX]{x03BC}\text{m}$: (a) a single CRE, (b) two CREs spaced
 $2D$ apart, (c) three CREs each spaced
 $2D$ apart, and (d) two CREs spaced
 $4D$ apart.

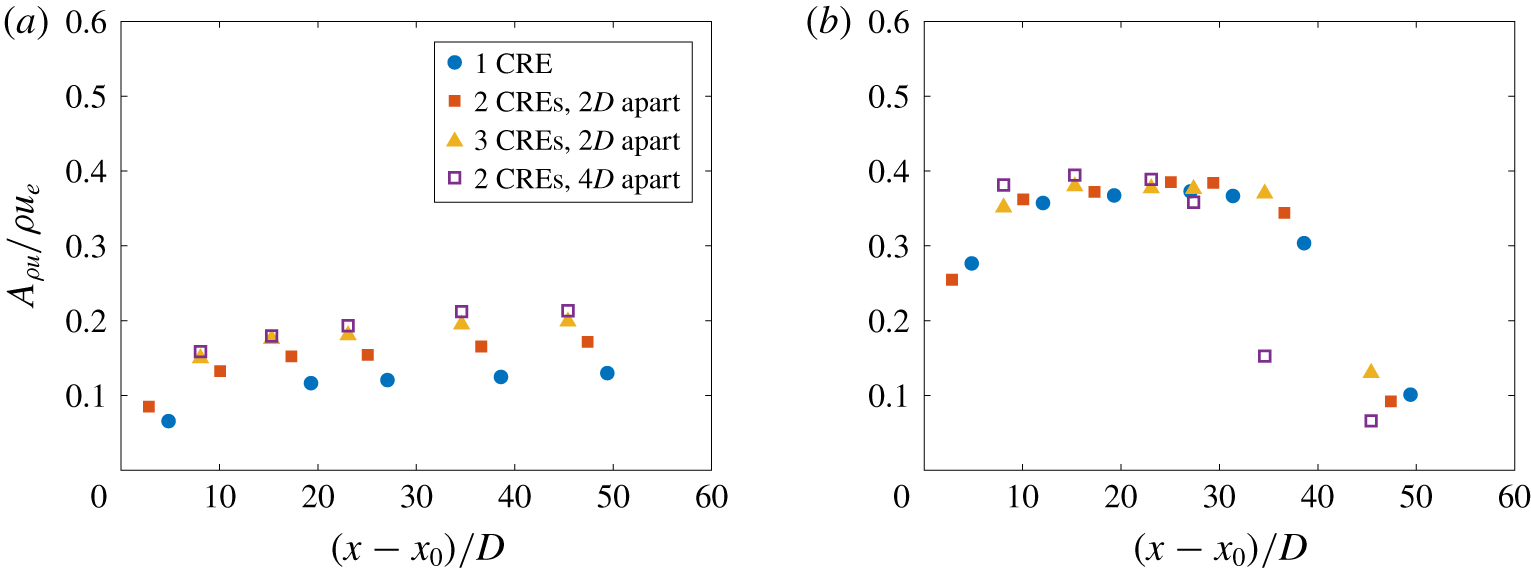
Plots of the streak amplitudes at each of the different streamwise measurement stations are compared by plotting the maximum streak strength for each location  $(A_{\unicode[STIX]{x1D70C}u}/\unicode[STIX]{x1D70C}u_{e})$ against the distance downstream of the most downstream roughness element in the array
 $(x-x_{0})$. A comparison of the streak strengths of the different cylindrical roughness configurations in figure 13 shows that both the spacing and the heights of the roughness elements affect the strength of the streaks behind the cylindrical roughness array. For the 140-μm-tall CREs, there is weak growth of the streaks over the streamwise extent of the measurement region (figure 13a). This indicates that the relative amplitude of the streaks does not change much in the measurement region. The addition of the number of roughness elements in the array appears to create an increase in the amplitude of the streaks. However, a comparison of the array of three circles spaced
 $2D$ apart and the array of two circles spaced
 $4D$ apart in figure 13(a) shows little change in the streak amplitude. For roughness elements that are approximately 140 μm tall, the streak amplitude appears to be affected by the position of the most upstream and most downstream element in the streamwise array rather than the number of elements in the array itself for the configurations studied.
Streak amplitudes as a function of downstream measurement location of CREs with different heights and separations: (a)  $k\approx 140~\unicode[STIX]{x03BC}\text{m}$ and (b)
 $k\approx 280~\unicode[STIX]{x03BC}\text{m}$.

As expected, an increase in the height of the CRE produces an increase in the streak amplitude (figure 13b). Roughness elements that are 280 μm tall produce a streak amplitude that rapidly increases with downstream distance, saturates to a value of approximately  $0.4\unicode[STIX]{x1D70C}u_{e}$, and then decays as the wake breaks down to turbulence. When they are spaced
 $2D$ apart, the number of CREs in a streamwise array does not appear to affect the streak amplitude at the different measurement stations downstream of the last roughness element. The wider spacing of the CREs at
 $4D$ apart appears to decrease the streak strength much sooner than a spacing of
 $2D$ apart. The spacing of the CREs appears to have less of an effect on the streak amplitude at measurement stations of
 $x-x_{0}$ less than
 $25D$. However, the
 $4D$ spacing between the CREs causes a rapid decrease in streak strength much sooner than the
 $2D$ spacing. This effect is believed to be due to the wake breaking down earlier behind the roughness elements with wider spacing, as will be shown in a later section.
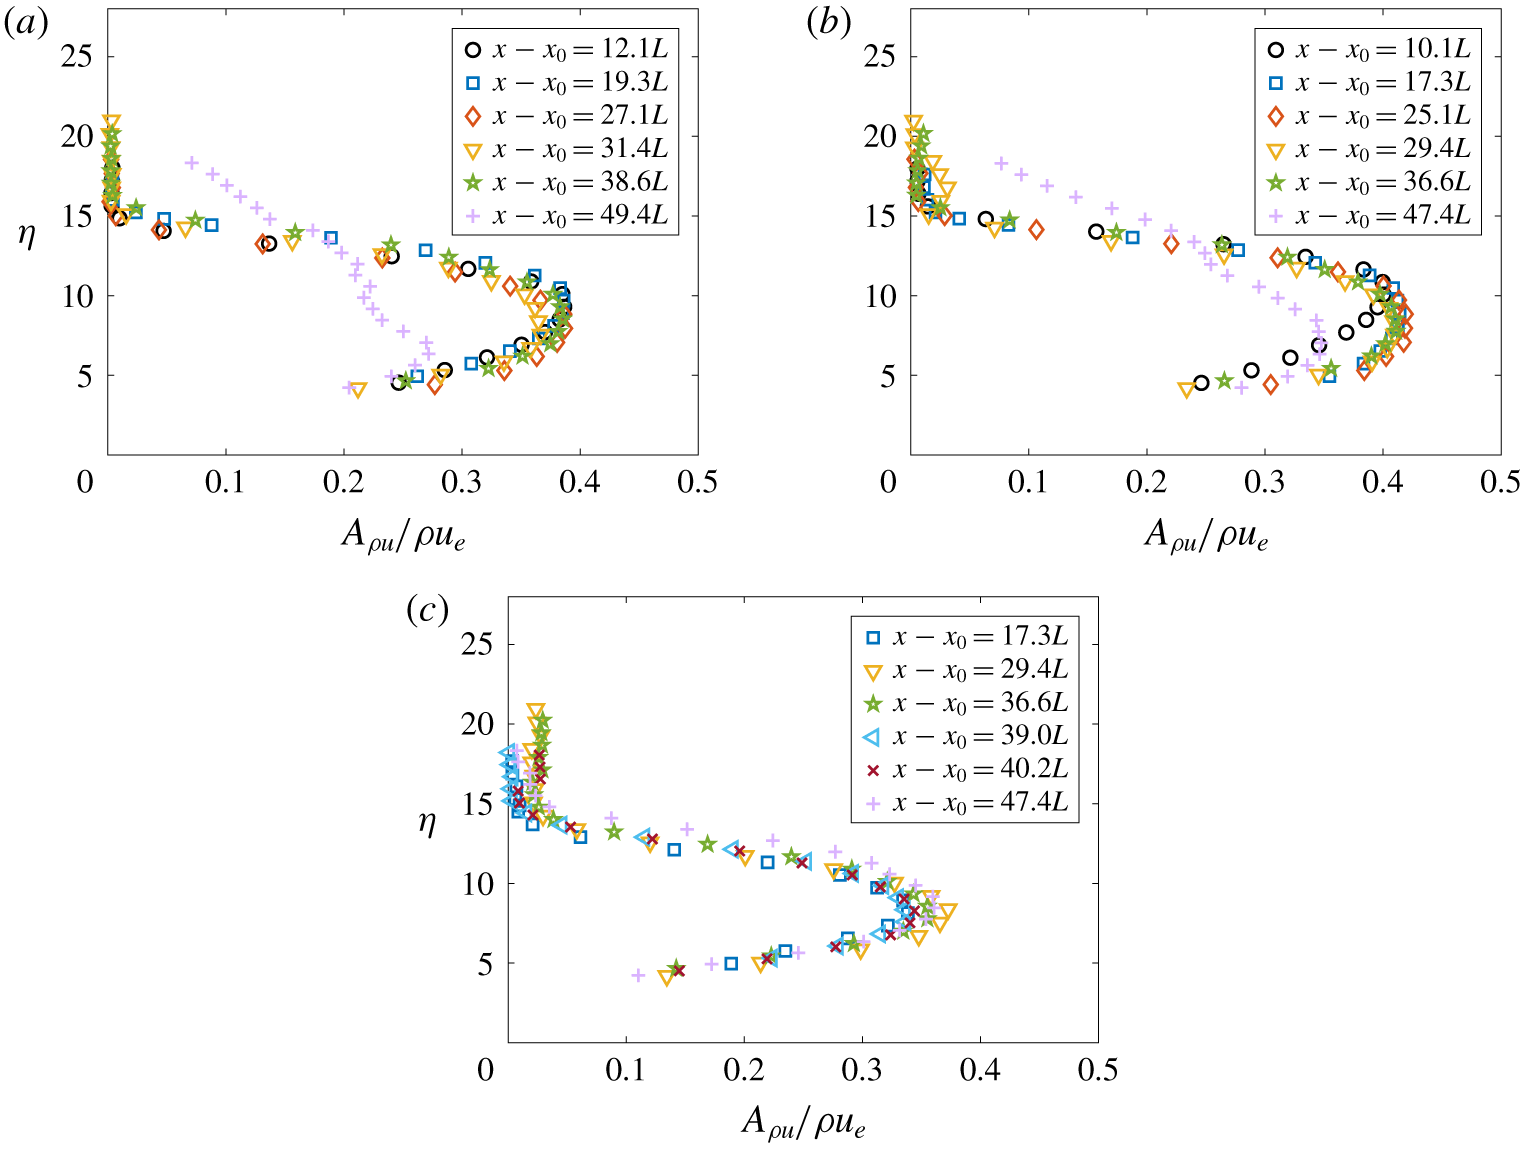
As with the CREs, an examination of the streak strength profiles was also performed for several of the streamwise stations for each of the RRE configurations tested. These are provided in figure 14. The streak strength profiles appear to be fairly similar in shape for each  $x-x_{0}$ station for each of the configurations of RREs. The wake of these roughness elements stays laminar for most of the measurement region, but this is difficult to determine using only the streak strength profiles. The dynamic data will be examined in a later section to determine if the flow is laminar or turbulent.
Streak strength profiles in the wake of arrays of RREs with  $k\approx 280~\unicode[STIX]{x03BC}\text{m}$: (a) a single RRE rotated + 45° from the leading edge, (b) two RREs spaced
 $2L$ apart, both rotated + 45°, and (c) two RREs spaced
 $2L$ apart rotated - 45° and + 45° from the leading edge.

The peak is fairly narrow for a single RRE oriented + 45° from the leading edge. The streak strength profiles reach a maximum of approximately  $0.4\unicode[STIX]{x1D70C}u_{e}$, and there is little growth from station to station. At the most downstream measurement station, the streak strength profile begins to flatten, probably due to the wake approaching turbulence; however, the profile never reaches the same uniformity as seen at the same location behind the CREs. For two RREs oriented at + 45° from the leading edge, the peak in the streak strength profile is slightly broader at all measurement stations downstream than in the streak strength profiles for the single RRE. At
 $x-x_{0}=10.1L$, the streak strength profile is still fairly narrow downstream of the two RREs rotated + 45°. It is possible that the wake is still developing at this station. By
 $x-x_{0}=17.3L$, the wake has developed and looks similar at all other downstream stations except
 $x-x_{0}=47.4L$. The streak strength profile begins to flatten at this last station, but never reaches the same uniformity as seen for the CREs at the same measurement stations. The wake of the RREs may not be as far along in the transition process as the CREs in this limited measurement region. This result is consistent with the observations of Kegerise et al. (Reference Kegerise, King, Choudhari, Li and Norris2014), which showed less growth in the instabilities behind an asymmetric roughness element than behind a symmetric roughness element.
The streak strength profiles of the third configuration with two RREs oppositely oriented (figure 14c) is similar in some ways to the other two configurations. As with the first two configurations, the streak strength profile shows a narrow peak, which reaches a maximum amplitude of  $0.4\unicode[STIX]{x1D70C}u_{e}$. However, unlike for the other configurations, this peak is narrower and only broadens slightly at the most downstream station of
 $x-x_{0}=47.4L$. The streak strength profile behind the third configuration does not flatten by the end of the measurement region.
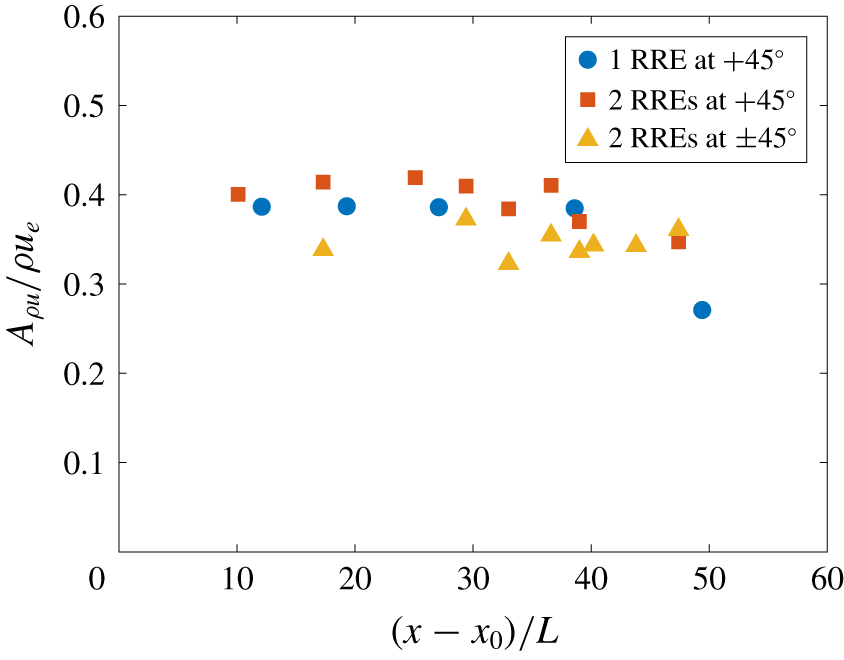
A plot of the amplitude of the streak strength profiles is given in figure 15. This plot shows that the streak amplitude remains fairly constant for the measurement region shown. A slight decrease is seen in the streak amplitude when  $x-x_{0}>40L$ for all configurations except the two RREs with opposite orientations.
Streak amplitude as a function of downstream measurement location of RREs with different orientations relative to the flat-plate leading edge.

7 Mass-flux fluctuations in the wake of the roughness elements
Mean measurements can provide useful information on the overall state of the boundary layer and some information on transition location. However, it is necessary also to measure the dynamic components of the flow in order to move towards physics-based methods. The dynamic off-body quantities can provide information on the relevant frequencies and mode shapes of the instabilities present in the wake. The r.m.s. quantities can provide information on the growth of these instabilities in the wake as well.
7.1 Power spectral densities
Power spectra ( $P_{xx}$) were computed using the Welch spectrum estimation method, applying a Hanning window to block lengths of 2048 points, 50 % overlap of the windows and 977 block averages. This yields a frequency resolution of 488 Hz. The spectra selected for each
 $x-x_{0}$ station correspond to the point in the survey plane at which the r.m.s. amplitude was largest. The location where the highest r.m.s. amplitude was found was limited to a region ranging from
 $z=\pm 1~\text{mm}$ about the centreline for the 280-μm-tall CREs and the tandem RREs with opposite orientations. This region was limited to
 $z=0$ to
 $z=2~\text{mm}$ for the 140-μm-tall CREs and to
 $z=-1.5$ to
 $z=0.5~\text{mm}$ for the single RRE and the tandem RREs with the same orientation. These limits were used to try to ensure that the same instability was being tracked at each downstream station. The reasoning behind the selection of the regions will be illustrated in the next section.
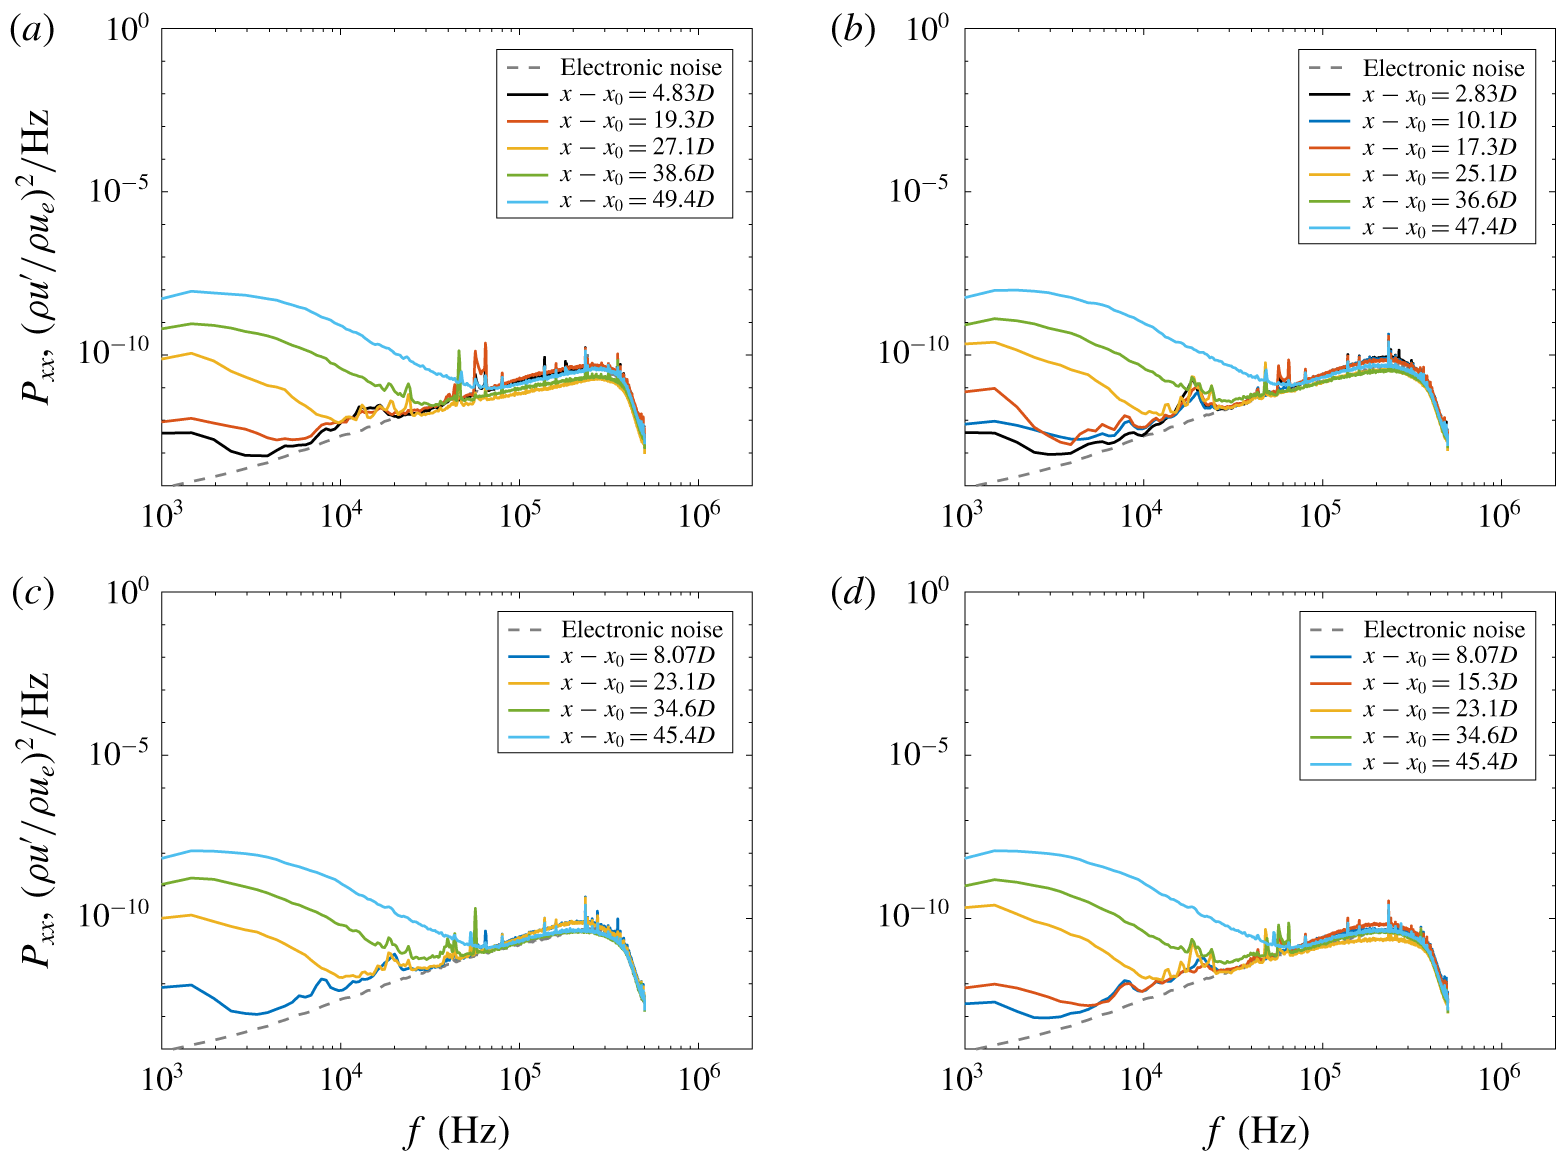
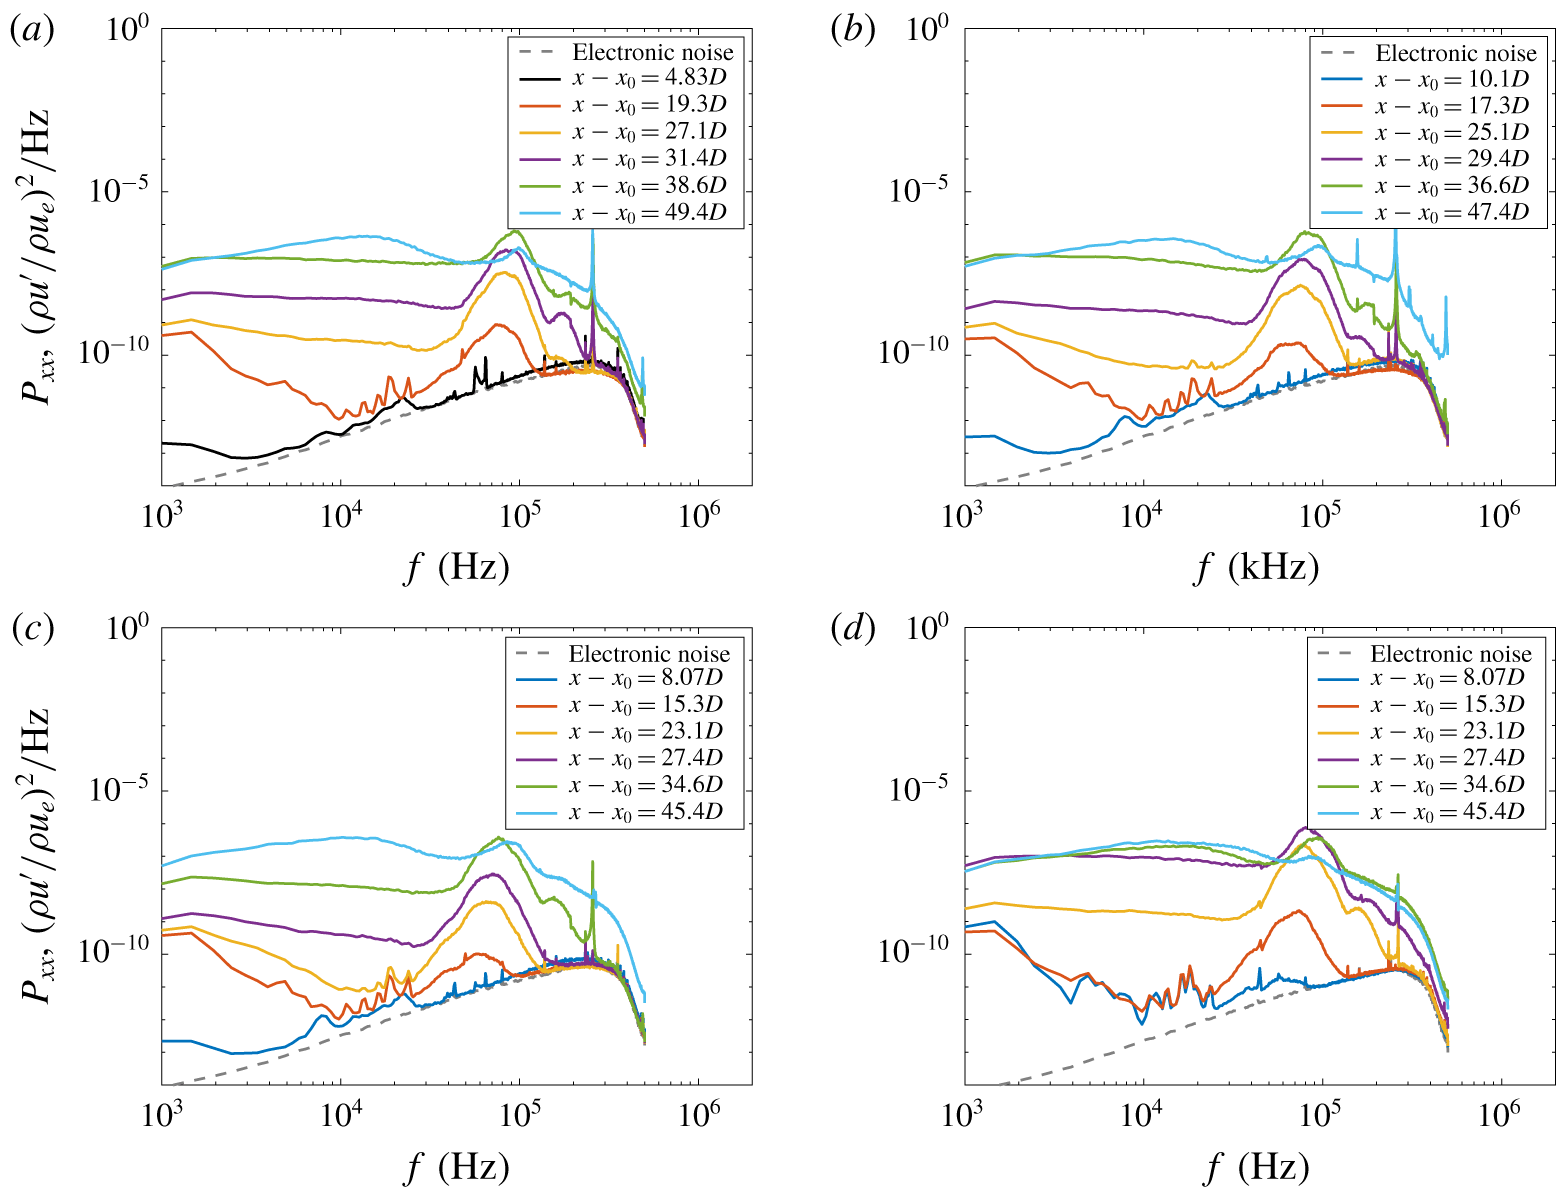
A comparison of the representative power spectra at each streamwise station is provided in figures 16 and 17 for the 140-μm-tall and 280-μm-tall CREs, respectively. The power spectra in figure 16 only show some low-frequency content above the electronic noise floor. Little change is seen between the different configurations of CREs tested. Nearer to the roughness element, the power spectra are similar to the electronic noise floor. As measurements are made farther downstream, the broadband low-frequency content increases in amplitude.
Power spectra of location with highest r.m.s. mass-flux fluctuations in the wake of arrays of CREs with  $k\approx 140~\unicode[STIX]{x03BC}\text{m}$: (a) a single CRE, (b) two CREs spaced
 $2D$ apart, (c) three CREs each spaced
 $2D$ apart, and (d) two CREs spaced
 $4D$ apart.

In figure 17, the power spectra for the taller CREs are similar to those for the shorter CREs at the farthest forward measurement stations. For  $(x-x_{0})\leqslant 12.1L$, the spectra again look to be dominated by the electronic noise for frequencies above 20 kHz. At farther downstream measurement stations, the low-frequency content begins to increase in amplitude, but a large peak also appears in the power spectra, centred at approximately 65–85 kHz, depending on the measurement station and CRE configuration. Broad peaks at frequencies greater than 100 kHz are present in the power spectra. These peaks are located near integer multiples of the large peak located near 65–85 kHz, indicating the presence of harmonics. At some measurement stations even farther downstream, the spectra show large-amplitude broadband frequency content, indicative of transition to turbulence.
Power spectra of location with highest r.m.s. mass-flux fluctuations in the wake of arrays of CREs with  $k\approx 280~\unicode[STIX]{x03BC}\text{m}$: (a) a single CRE, (b) two CREs spaced
 $2D$ apart, (c) three CREs each spaced
 $2D$ apart, and (d) two CREs spaced
 $4D$ apart.

Some differences exist between these different configurations. The configurations with the CREs spaced two diameters apart show the remnants of a peak in the power spectra centred at approximately 95 kHz at the last measurement station. This peak has a much smaller amplitude in the power spectra for the configuration with two CREs spaced four diameters apart. The wake behind the two CREs spaced four diameters apart is farther along in the transition process than when the two CREs are spaced two diameters apart.
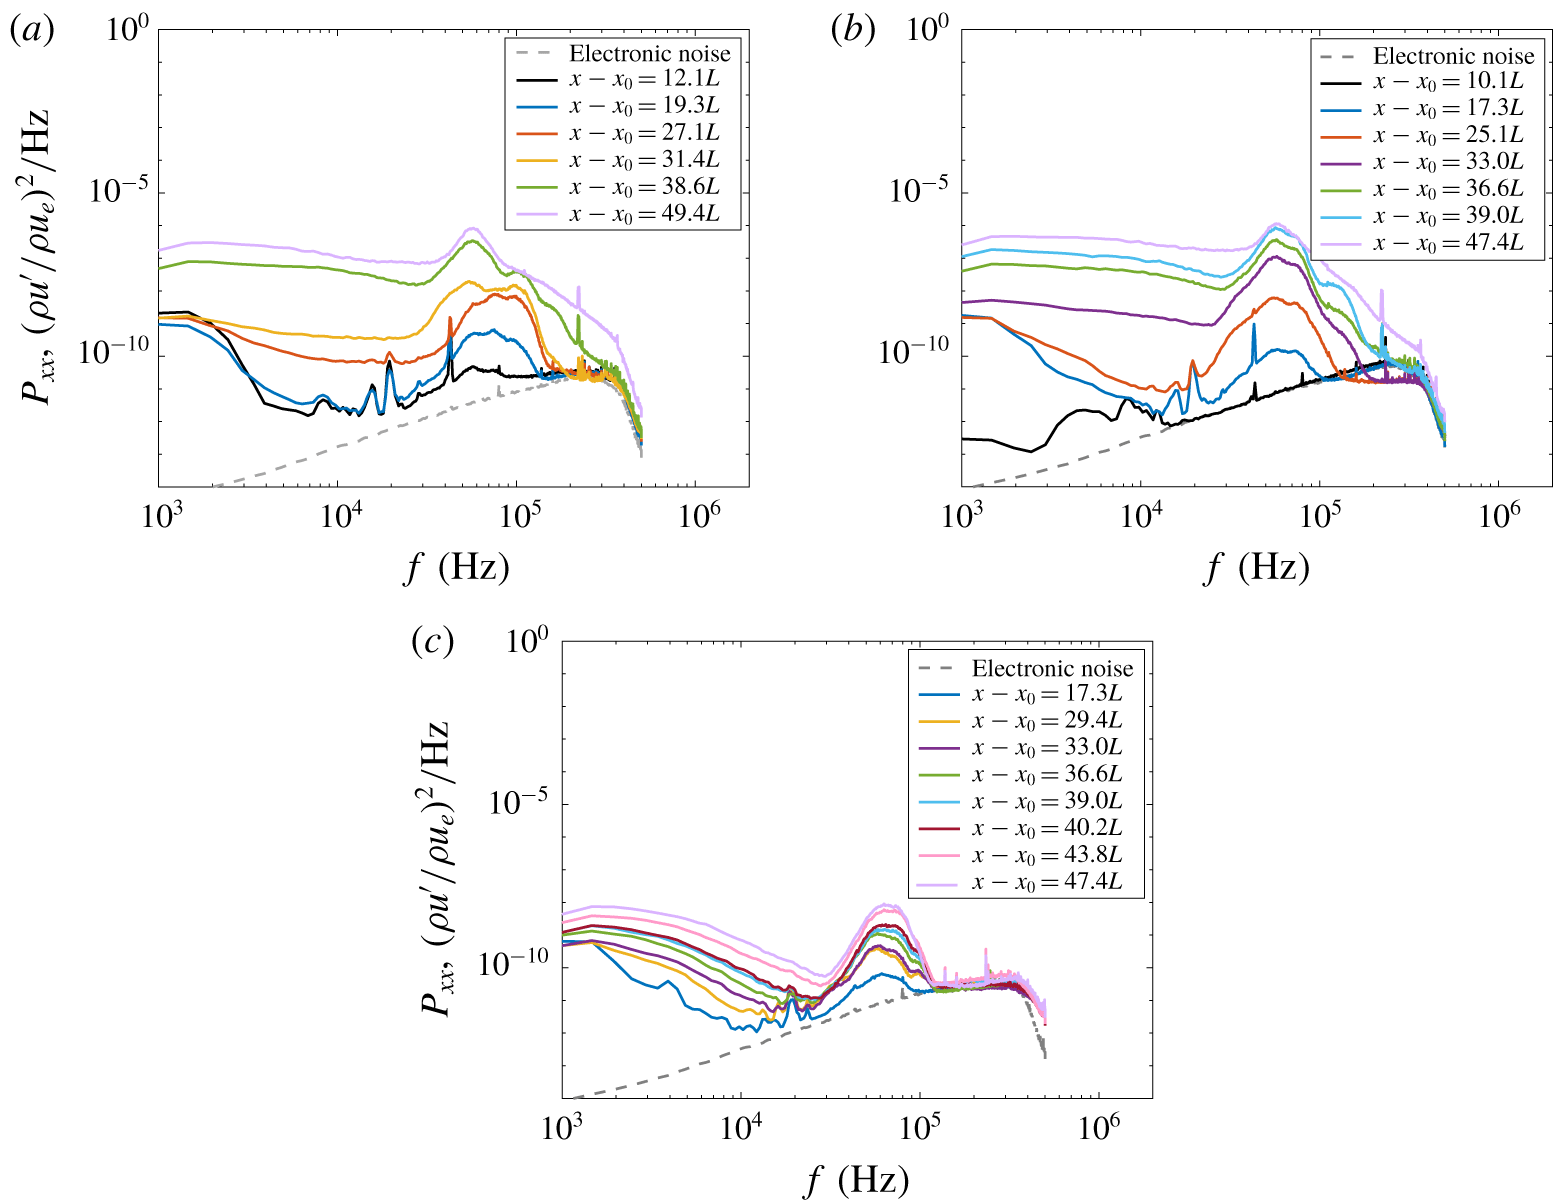
A comparison of the representative power spectra at each streamwise station for the RREs is provided in figure 18. Knowing that the first few measurement stations would be dominated by the anemometer noise, these measurements were taken at farther downstream stations. The three different RRE configurations each have their own characteristics.
Power spectra in the wake of arrays of RREs with  $k\approx 280~\unicode[STIX]{x03BC}\text{m}$, taken from the measurement location with maximum r.m.s. fluctuations: (a) a single RRE rotated + 45° from the leading edge, (b) two RREs spaced
 $2L$ apart, both rotated + 45°, and (c) two RREs spaced
 $2L$ apart, rotated + 45° and - 45° from the leading edge.

The power spectra of the measurements taken behind the single RRE show some low-frequency content at the first two measurement stations that quickly broadens. A peak is visible in the power spectra and at the farthest forward station; this peak appears to be centred at approximately 55 kHz. Other peaks are visible in the spectra as well, and these are located at approximately 75 kHz and 95 kHz. At  $x-x_{0}=19.3L$, the peaks at these frequencies grow in amplitude and the 55 kHz peak has approximately the same amplitude as the 75 kHz peak. At
 $x-x_{0}=27.1L$, the peak at 75 kHz is larger than either the 55 kHz or the 95 kHz peaks. At
 $x-x_{0}=31.4L$, the peak at 75 kHz disappears and the 55 kHz and 95 kHz peaks have approximately the same amplitude. The 55 kHz peak dominates the spectra for the next two
 $x-x_{0}$ locations, and a harmonic near 110 kHz is visible at
 $x-x_{0}=38.6L$. At
 $x-x_{0}=49.4L$, the broadband frequency content increases further and only a peak at 55 kHz remains.
The power spectra for the measurements behind the two RREs with the same + 45° orientation show similar trends to those of the single RRE. The peaks in the power spectra for this configuration are centred instead around 55 kHz and 75 kHz. There does not appear to be a peak centred at 95 kHz. The peaks grow as measurements are taken farther downstream, however, the 55 kHz peak is greater in amplitude than the 75 kHz peak for each of the measurement stations. The harmonic for the 55 kHz peak starts to become visible in the power spectra at approximately  $x-x_{0}=39.0L$, but disappears at
 $x-x_{0}=47.4L$.
The third configuration with two RREs with opposite orientations at ± 45° show markedly different frequency content in the wake of the roughness elements. Here, the peak in the power spectra of the measurements behind the oppositely oriented RREs is centred near 65 kHz and remains fairly narrow as it grows with increasing downstream distance. However, in contrast to the other two RRE configurations, the flow behind the two oppositely oriented RREs does not display any spectral broadening up to the last measurement station at  $x-x_{0}=47.4L$, and no breakdown occurs.
7.2 Root-mean-square mass-flux fluctuations
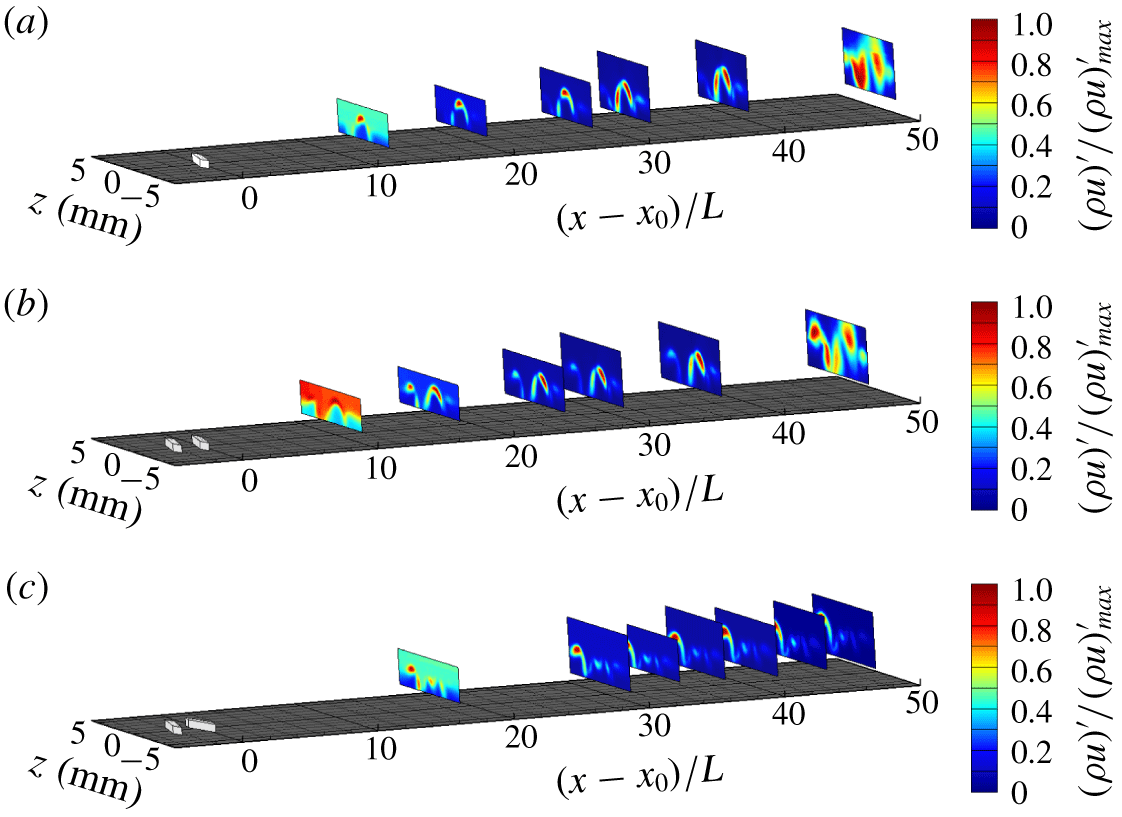
Simple examination of the power spectra is often insufficient to determine whether these modes are even or odd, or some hybrid mode. Thus, in those cases, the mode shapes for the different frequencies shown must also be evaluated. The r.m.s. mass-flux fluctuations within a 5 kHz bandwidth for several frequencies were computed for each measurement location behind the roughness elements. The r.m.s. mass-flux fluctuations for each of the contour plots is normalized by the maximum r.m.s. amplitude so that the contour plots can be plotted with the same contour levels for each measurement station and roughness configuration. As a result, the measurements made farther upstream will appear to have a larger relative magnitude due to the maximum r.m.s. amplitude being very small. This scaling is also used to better visualize the mode shapes for comparison between each case.
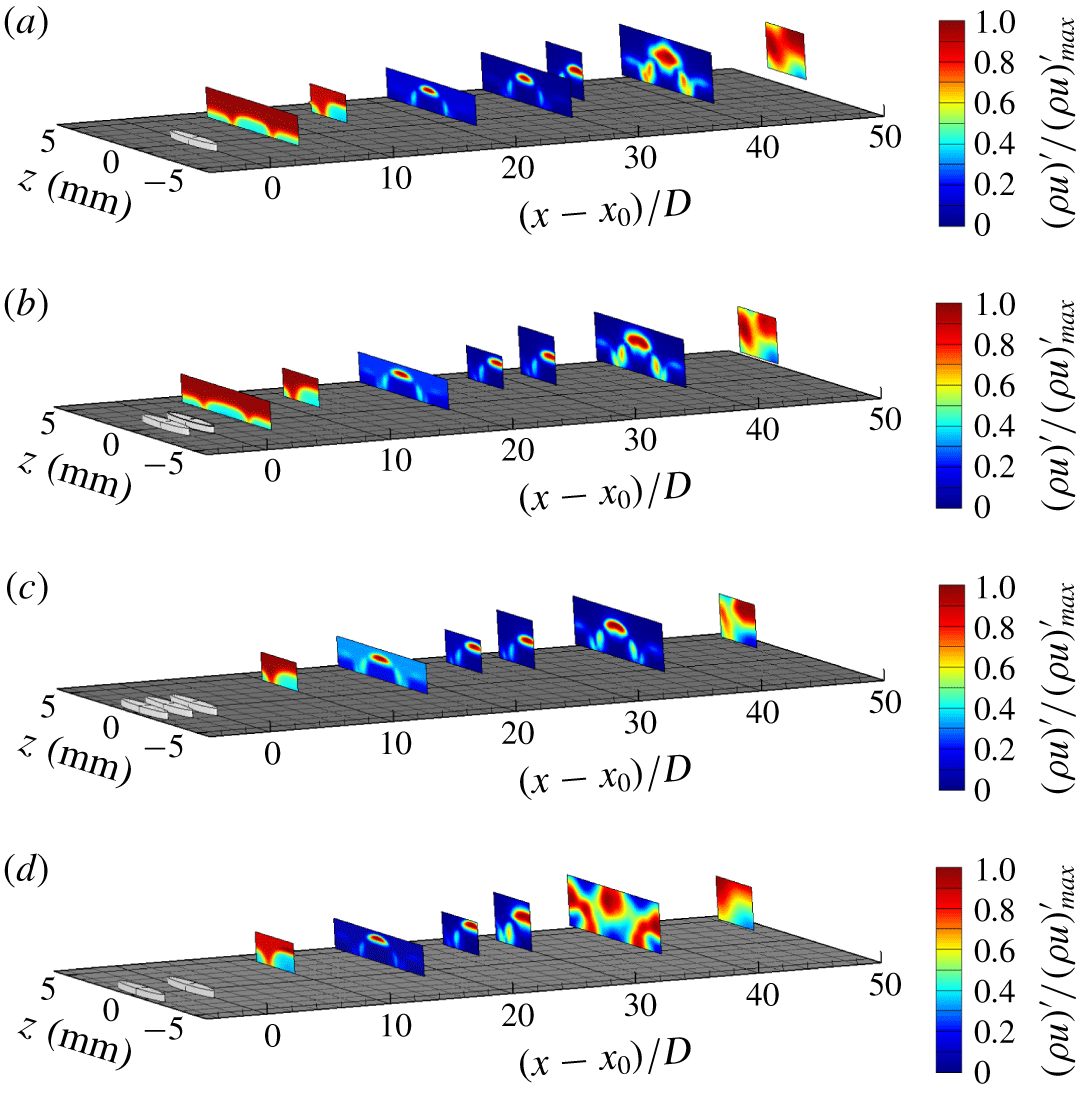
Owing to the inability to find a peak frequency for the 140-μm-tall CREs in the power spectra, the method of searching for an instability in the wake of these roughness elements required visually inspecting the contour plots of r.m.s. mass-flux fluctuations for a range of frequencies between 30 and 50 kHz. Contour plots of the r.m.s. outside of this frequency band showed no clear instability modes or flow features. The instability found in the wake of the roughness elements only appeared in the measurement stations where  $x-x_{0}>34D$ at approximately 45 kHz. It is possible that the instability is not observed in the spectra due to the small amplitude of this instability in the presence of several tonal peaks from electronic noise in the same frequency range. The contour plots of the r.m.s. mass-flux fluctuations at this frequency for the 140-μm-tall CREs are given in figure 19.
The r.m.s. mass-flux fluctuation contours at approximately 45 kHz in the wake of arrays of CREs with  $k\approx 140~\unicode[STIX]{x03BC}\text{m}$ at
 $x=179.7~\text{mm}$: (a) a single CRE (
 $x-x_{0}=38.6D$), (b) two CREs spaced
 $2D$ apart (
 $x-x_{0}=36.6D$), (c) three CREs each spaced
 $2D$ apart (
 $x-x_{0}=34.6D$), and (d) two CREs spaced
 $4D$ apart (
 $x-x_{0}=34.6D$).

The mode shapes for the 45 kHz instability shown in figure 19 are fairly weak. These show up as two regions of higher r.m.s. fluctuations located on either side of the centreline of the wake of the roughness element near  $z=\pm 1.5~\text{mm}$. The regions of higher fluctuation in the boundary layer appear to be more prominent for the cases with multiple roughness elements. The flow behind the single 140-μm-tall CRE shown in figure 19(a) does not appear to have the same general shape as the other configurations. The instability in the other CRE configurations appears to be an odd mode, due to the locations of these regions of higher r.m.s. amplitudes.
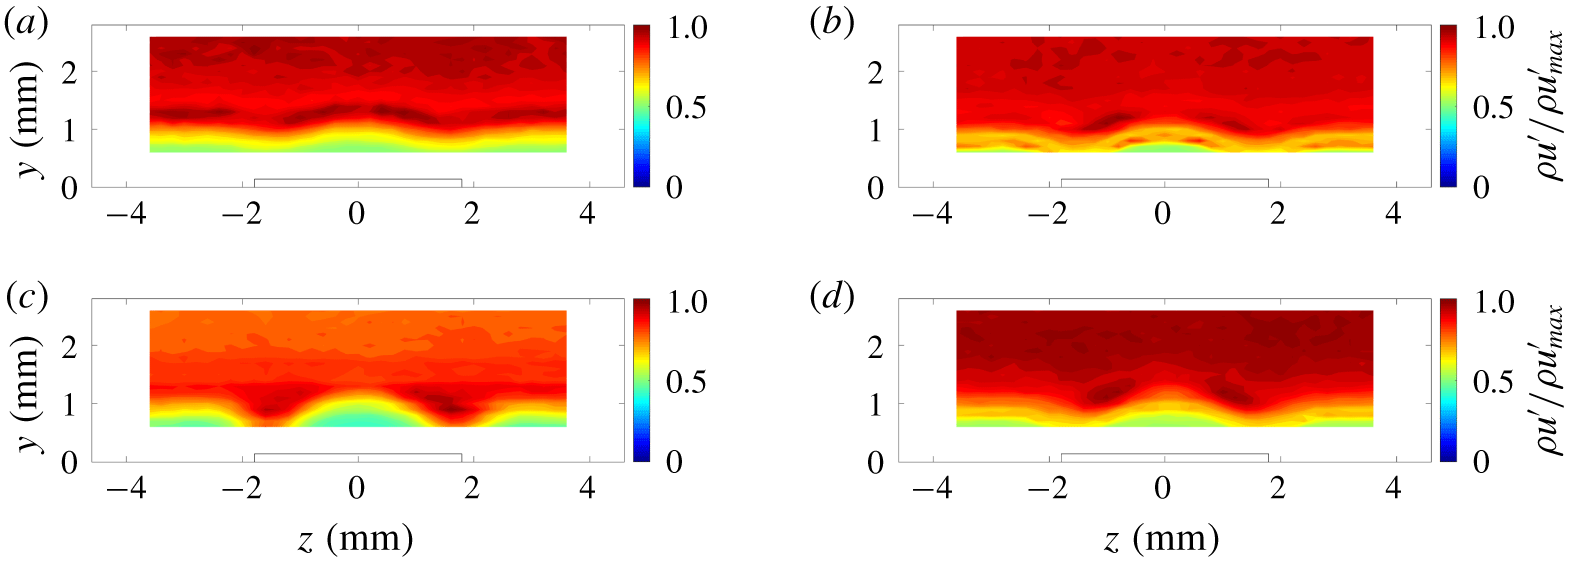
The taller CREs have a different mode shape than the shorter CREs. The power spectra shown in figure 17 show a large peak centred somewhere between 65 and 85 kHz as being the dominant instability in the wake of the 280-μm-tall CREs. The r.m.s. fluctuations centred around the most dominant frequency in the 65–85 kHz range are shown in figure 20 for each of the measurement stations.
At  $x-x_{0}\leqslant 15D$, the mode shapes for the r.m.s. mass-flux fluctuations for each of the configurations appear to be similar. There is one region of higher-amplitude fluctuations centred on the wake at approximately
 $y=1.3~\text{mm}$. On either side of this region of higher-amplitude fluctuations, a smaller region of locally higher-amplitude fluctuations appears lower in the boundary layer. This shape is indicative of the presence of an even-mode instability.
The r.m.s. mass-flux fluctuation contours at approximately 80 kHz in the wake of arrays of CREs with  $k\approx 280~\unicode[STIX]{x03BC}\text{m}$: (a) a single CRE, (b) two CREs spaced
 $2D$ apart, (c) three CREs each spaced
 $2D$ apart, and (d) two CREs spaced
 $4D$ apart.

The r.m.s. fluctuations at stations downstream of  $x-x_{0}\geqslant 35D$ show some different characteristics in the mode shapes between each of the different configurations. The first three configurations shown in figure 20(a–c) have a similar structure to the mode shapes in the farther upstream measurement stations. However, the regions of higher-amplitude fluctuations seem to have a different degree of distortion for each of the configurations. For example, the case with three CREs each spaced
 $2D$ apart in figure 20(c) appears the least distorted, while the case with a single CRE shows a highly distorted mode shape (figure 20a). These are contour plots all taken at a single station on the plate relative to the leading edge, however, so the relative distance between the measurement station and the most downstream roughness element is shorter. Thus, the measurement behind the single CRE is relatively farther downstream than the measurement behind the three CREs. The fourth configuration shown in figure 20(d) has a much different character than the other configurations of CREs. The regions of higher-amplitude fluctuation are located in the centre of the wake, but the fluctuations on either side of the roughness element between 2 and 4 mm from the centreline appear to be almost as large in amplitude as the fluctuations on the centreline. This pattern indicates a flow field that is in the process of transitioning to turbulence, if it has not already become turbulent. The power spectra shown in figure 17(d) appear to corroborate the evidence, showing broadband frequency content except for one peak near 85 kHz.
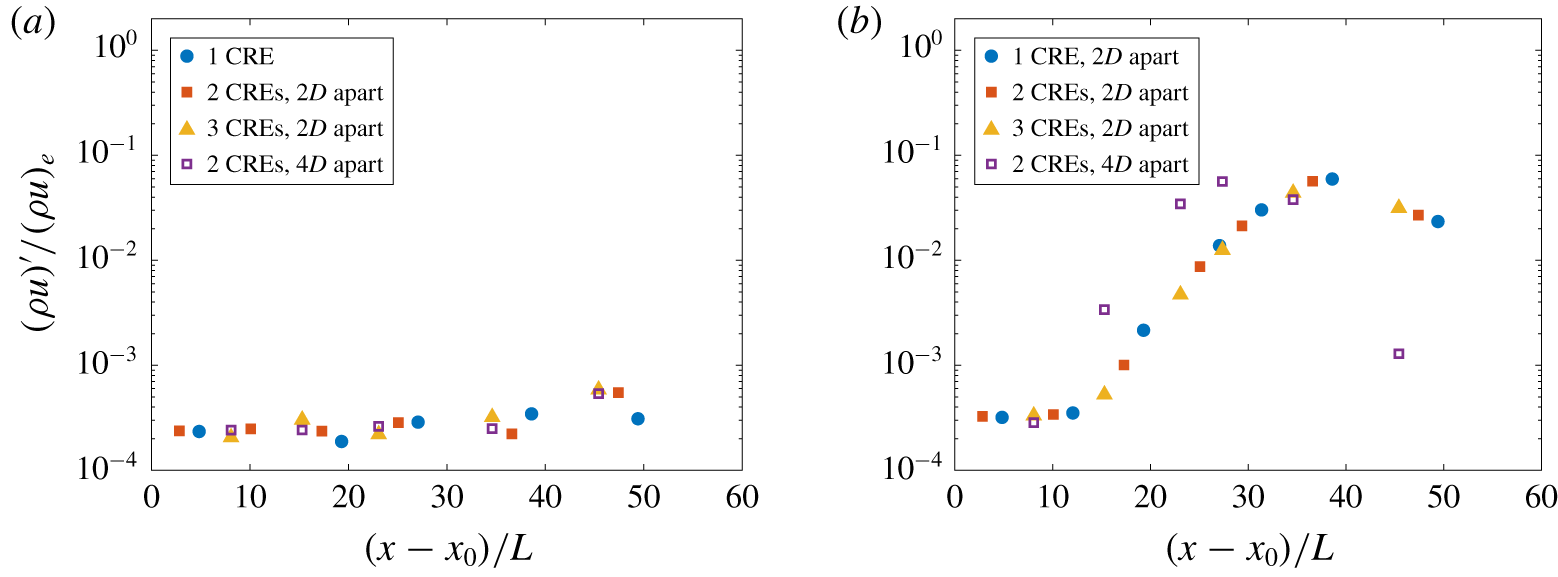
The strength of these fluctuations is not easy to determine from the plots given in figure 20, due to the fact that these are all normalized by the maximum amplitude of fluctuations in each contour plot. The r.m.s. amplitudes of the mass-flux fluctuations at the peak frequency at each measurement station for each of the CRE configurations tested are given in figure 21. These r.m.s. amplitudes were taken from the measurement region centred near  $z=1.5~\text{mm}$ for the odd-mode instability and near
 $z=0$ for the even-mode instability. Figure 21 shows the r.m.s. amplitudes normalized by the free-stream mass flux on a log scale on the
 $y$ axis and the distance from the most downstream roughness element in each configuration is normalized by the diameter of the CRE on the
 $x$ axis. The r.m.s. amplitudes for the 140-μm-tall configurations in figure 21(a) shows little growth for each of the configurations tested. For
 $x-x_{0}\leqslant 35D$, the r.m.s. amplitudes are essentially the measured electronic noise floor.
A comparison of the r.m.s. amplitude of the most amplified frequency for each configuration of CREs: (a)  $k\approx 140~\unicode[STIX]{x03BC}\text{m}$ at 45 kHz and (b)
 $k\approx 280~\unicode[STIX]{x03BC}\text{m}$ at a peak centred somewhere between 65 and 85 kHz.

The r.m.s. amplitudes for the 280-μm-tall configurations show similar growth for the first three configurations of CREs spaced  $2D$ apart. The instability in the wake of the CREs spaced
 $2D$ apart grows until approximately
 $x-x_{0}=40D$ downstream, and then transitions. Unlike the other three configurations, the amplitude of the instability in the wake of the two CREs spaced
 $4D$ apart grows until approximately
 $x-x_{0}=27D$, and then transitions. This indicates that the wider spacing of the CREs induces transition earlier than when the CREs are spaced
 $2D$ apart. The addition of each CRE
 $2D$ apart appears to shift transition downstream by the same amount.
The dominant instabilities in the wake of streamwise arrays that cause transition or come close to transition appear to saturate at a level of 5 %–7 % of the free-stream mass flux. The instabilities measured in the wake of the taller CREs appear to have the same growth rate, so this implies that the  $4D$ spacing between the taller CREs changes the initial amplitude of the dominant instability in the wake. In this case, the streamwise array of elements with
 $4D$ spacing acts as a larger-amplitude perturbation than the CREs with
 $2D$ spacing.
Contour plots of the r.m.s. mass-flux fluctuations at the most amplified frequency for each of the  $x-x_{0}$ stations are shown for each of the three RRE configurations in figure 22. The most amplified frequency behind the single RRE switches from 55 kHz to 75 kHz between
 $x-x_{0}=12.1L$ and
 $19.3L$ and then back to 55 kHz between
 $x-x_{0}=27.1L$ and
 $31.4L$. The 95 kHz instability is also approximately the same amplitude as the 55 kHz instability at
 $x-x_{0}=31.4L$ (figure 18a). For the configurations with two RREs, the most amplified frequency is the same for the measurement region: 55 kHz for the configuration with two RREs with the same orientation and 65 kHz for the configuration with two RREs with opposite orientations. Ultimately, the 55 kHz instability appears to be the most amplified instability as the flow starts to break down and transition behind the single RRE and the two RREs with the same orientation. The flow behind the two RREs with opposite orientations does not appear to break down.
The r.m.s. mass-flux fluctuation contours at the most amplified frequency for each measurement station in the wake of arrays of RREs with  $k\approx 280~\unicode[STIX]{x03BC}\text{m}$: (a) a single RRE rotated + 45° from the leading edge, (b) two RREs spaced
 $2L$ apart, both rotated + 45°, and (c) two RREs spaced
 $2L$ apart, rotated + 45° and - 45° from the leading edge.

Owing to the asymmetry of the RREs, the r.m.s. amplitude of the fluctuations in the wake of the RREs is not expected to produce shapes like the odd- and even-mode instabilities seen in the wake of the CREs. As in Balakumar & Kegerise (Reference Balakumar and Kegerise2016), even a symmetric element in an asymmetric environment generates instabilities in the wake that do not have a symmetric shape. Several families of modes can be present at the same approximate wavelength. This effect makes determining the most dominant type of instability (odd versus even) in the wake of roughness more difficult. The use of an ‘odd’ versus ‘even’ nomenclature may even be misleading. Furthermore, when these peak frequencies are closely spaced, the amplitude of one instability may have some effect on the integrated r.m.s. amplitude of instabilities with nearly the same peak frequency.
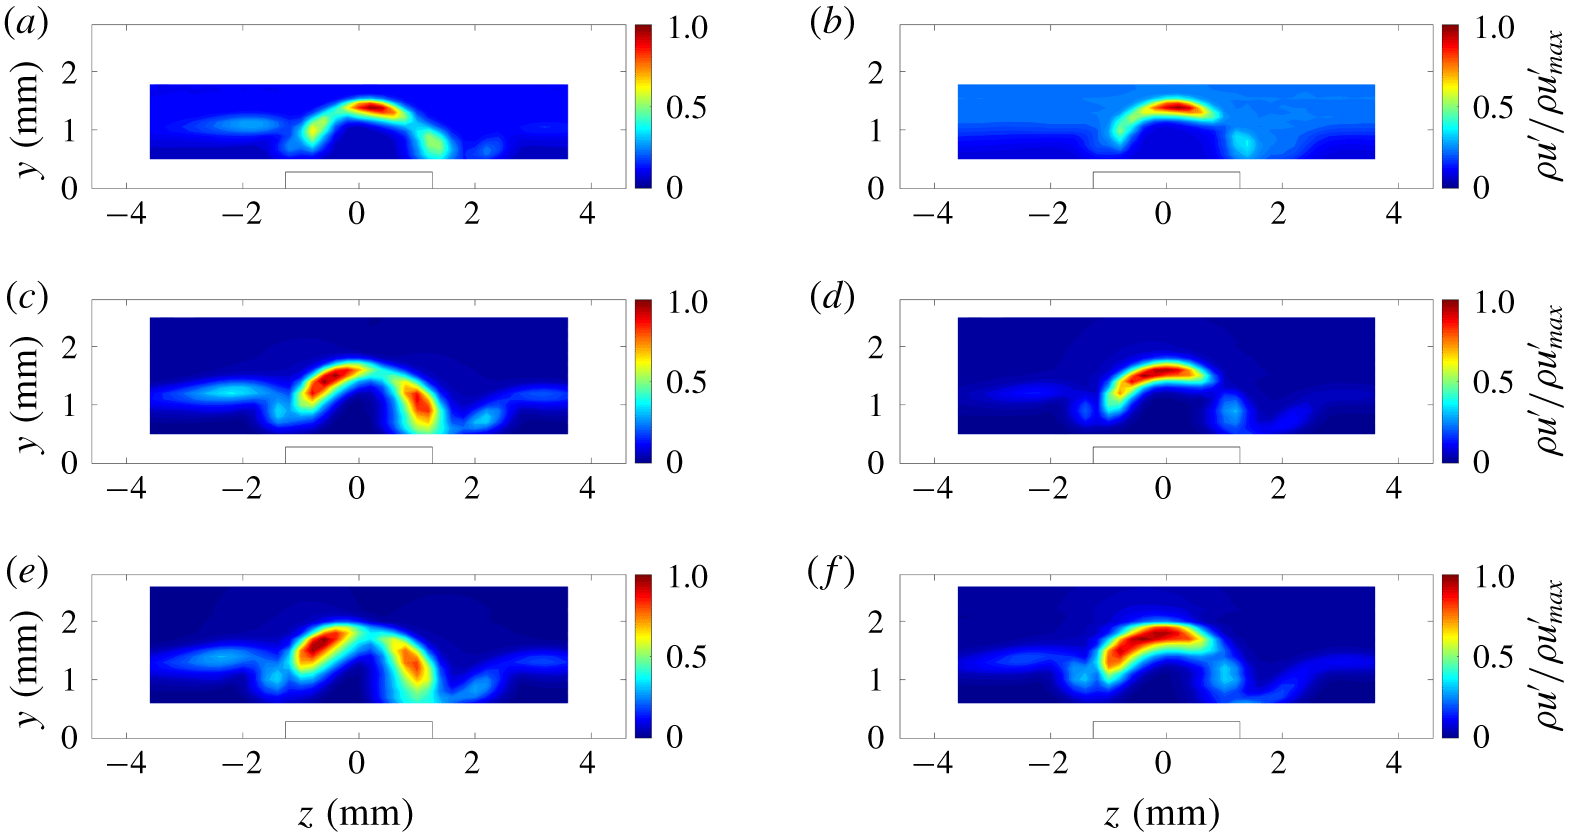
As a first step, the r.m.s. fluctuations in the wake of each of the configurations of RREs was examined. The first case shown in figure 23 shows the r.m.s. mass-flux fluctuations at three streamwise stations on the plate:  $x-x_{0}=19.3L$,
 $31.4L$ and
 $38.6L$. The left-hand column shows the r.m.s. mass-flux fluctuations centred at 55 kHz and the right-hand column shows the r.m.s. mass-flux fluctuations centred at 95 kHz. At the most upstream station shown here (figure 23a,b), the 55 kHz fluctuations appear to have a mode shape that is similar to an even mode. However, unlike in the wake of the symmetric CRE, the regions of higher r.m.s. fluctuations appear to be skewed towards the
 $+z$ direction. At farther downstream stations (figure 23c,e), these r.m.s. fluctuations appear to resemble more of a odd-mode shape that is skewed. In figure 23(b), the mode shape of the r.m.s. fluctuations centred at 95 kHz is similar to the mode shape seen for the 55 kHz fluctuations (figure 23a). However, at the farther downstream stations (figure 23d,f), the region of higher r.m.s. fluctuations appears to be centred closer to
 $z=0$ than the 55 kHz fluctuations, and the region of higher r.m.s. fluctuations seems to contain only a single region. Thus, the 95 kHz fluctuations appear to be related to a mode that may more closely resemble an even mode that is skewed towards the
 $-z$ direction.
The r.m.s. mass-flux fluctuations in the wake of the single RRE oriented 45° from the leading edge of the flat plate: (a,b) at  $x=110.6~\text{mm}$, or
 $x-x_{0}=19.3L$; (c,d) at
 $x=153.8~\text{mm}$, or
 $x-x_{0}=31.4L$; and (e,f) at
 $x=179.7~\text{mm}$, or
 $x-x_{0}=38.6L$. Panels (a,c,e) are centred at
 $f=55~\text{kHz}$ and panels (b,d,f) are centred at
 $f=95~\text{kHz}$.

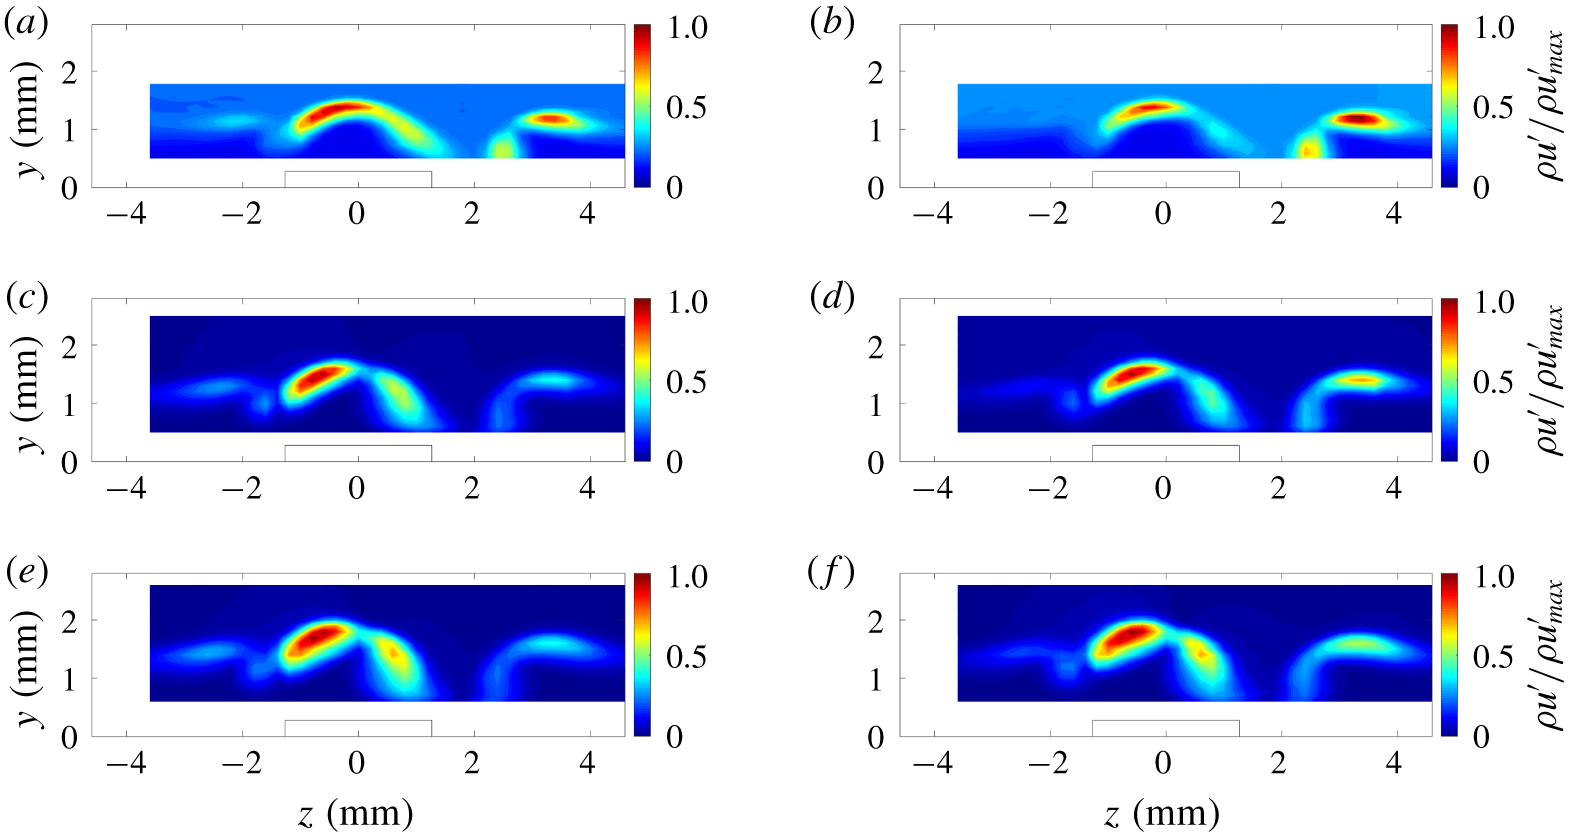
The r.m.s. mass-flux fluctuation contours in the wake of the two RREs with the same (+ 45°) orientation are given in figure 24. The same streamwise measurement stations as in figure 23 are shown for this configuration, but the centre frequency of the fluctuations has changed for the right-hand column. Unlike the single RRE, the two most dominant instability frequencies in the power spectra shown in figure 18 are centred near 55 kHz and 75 kHz. In this case, the mode shapes of the two frequencies are fairly similar at each of the measurement stations. These fluctuations appear to be more similar to an odd mode that is tilted towards the  $+z$ direction.
The r.m.s. mass-flux fluctuations in the wake of the two RREs both oriented 45° from the leading edge of the flat plate: (a,b) at  $x=110.6~\text{mm}$, or
 $x-x_{0}=17.3L$; (c,d) at
 $x=153.8~\text{mm}$, or
 $x-x_{0}=29.4L$; and (e,f) at
 $x=179.7~\text{mm}$, or
 $x-x_{0}=36.6L$. Panels (a,c,e) are centred at
 $f=55~\text{kHz}$ and panels (b,d,f) are centred at
 $f=75~\text{kHz}$.

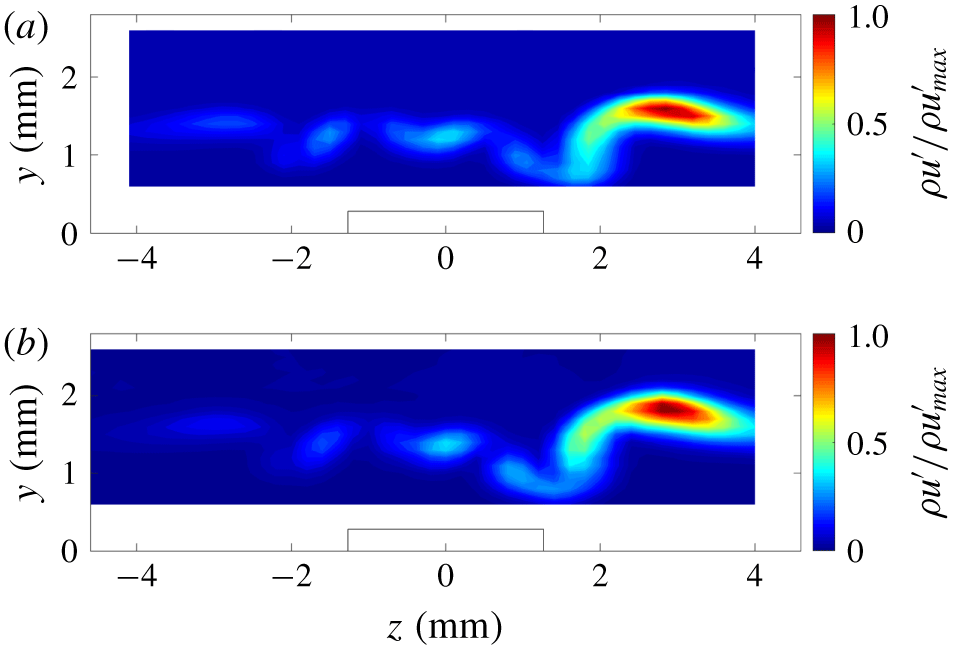
Figure 25 shows the r.m.s. mass-flux fluctuations in the wake of the two RREs with opposite (± 45°) orientations. Note again that the contours of the r.m.s. fluctuations are normalized by the maximum r.m.s. fluctuation in the contour plot. In this configuration, the most amplified instability is centred at 65 kHz, and the largest-amplitude mass-flux fluctuations are situated in a region centred near  $z=2.5~\text{mm}$. The region near the centreline has relatively low-amplitude fluctuations in comparison.
The r.m.s. mass-flux fluctuations centred at 65 kHz in the wake of the two RREs oriented in opposite directions at ± 45° from the leading edge of the flat plate: (a) at  $x=179.7~\text{mm}$, or
 $x-x_{0}=36.6L$, and (b) at
 $x=218.4~\text{mm}$, or
 $x-x_{0}=47.4L$.

The r.m.s. contour plots do not change much between the streamwise stations. This is because the wake does not transition by the farthest downstream measurement station (shown in figure 25b). The mode shape of the r.m.s. mass-flux fluctuations also appears to be significantly different from the other configurations, indicating that a different mechanism may eventually be responsible for transition downstream of these roughness elements. The region of highest r.m.s. fluctuations also appears to be farther removed from the centre of the wake, indicating that transition may eventually occur somewhere off the centreline.
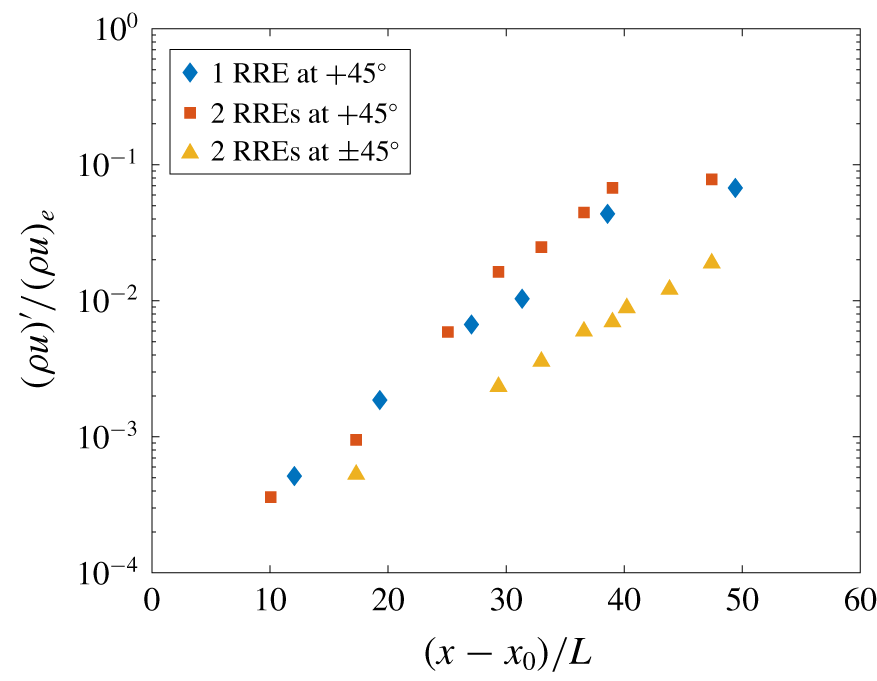
The r.m.s. amplitude of the fluctuations at the most amplified frequency for each streamwise measurement station is plotted for each of the configurations in figure 26. The growth of the instabilities in the wake of the single RRE and the two RREs with the same orientation relative to the leading edge of the flat plate appear to have the same relative growth until transition onset begins somewhere between  $x-x_{0}=40L$ and
 $50L$. This is similar to the effect seen for the CREs; each additional roughness element placed
 $2D$ or
 $2L$ downstream only appears to shift the transition onset location downstream by the same amount. The dominant instability for the two RREs with opposite orientations relative to the leading edge of the flat plate appears to have a lower growth rate, which is expected. Transition in the wake of this configuration was not observed.
A comparison of the r.m.s. amplitude of the most amplified frequency for each configuration of RREs.

8 Mass-flux shear in the wake of the roughness elements
Determining whether the instability modes in the wake are odd or even is more easily done with two wires when there is not a clear symmetry in the wake of the roughness elements. However, placing two hot-wire sensors in a thin boundary layer may be physically unfeasible, as in the case of this experiment. Another method to help determine the type of modes observed may be to analyse the shear in regions corresponding to higher mass-flux fluctuations. Choudhari et al. (Reference Choudhari, Li, Wu, Chang, Edwards, Kegerise and King2010) stated that regions of higher spanwise shear correspond to an odd mode while regions of higher wall-normal shear correspond to an even mode.
Since hot-wire measurements are sensitive to mass flux and not velocity, the spanwise derivative of the streamwise mass flux ( $\unicode[STIX]{x2202}(\unicode[STIX]{x1D70C}u)/\unicode[STIX]{x2202}z$) is used to represent the spanwise shear of the mass flux. Likewise, the wall-normal shear of the mass flux is represented by the wall-normal derivative of the streamwise mass flux (
 $\unicode[STIX]{x2202}(\unicode[STIX]{x1D70C}u)/\unicode[STIX]{x2202}y$). The mass-flux shear is normalized by the mean edge mass flux and the average height of the roughness element for each of the following contour plots. In the following figures, the spanwise mass-flux shear and the wall-normal mass-flux shear are shown as colour contours, and the contours of the r.m.s. fluctuations for different instabilities are shown as black lines overlaid on top.
The spanwise mass-flux shear and the wall-normal mass-flux shear are not required to identify the modes present in the wake of the CREs. Owing to the symmetry of the wake, the basic structure of the instability modes is clearly sinuous, or odd, for the shorter CREs (figure 19) and clearly varicose, or even, for the taller CREs (figure 20). To demonstrate how the mass-flux shear aids in the identification of modes in the wake of the RREs, however, the mass-flux shear was calculated and compared to the r.m.s. mass-flux fluctuations in the wake of the CREs shown in figures 19 and 20.
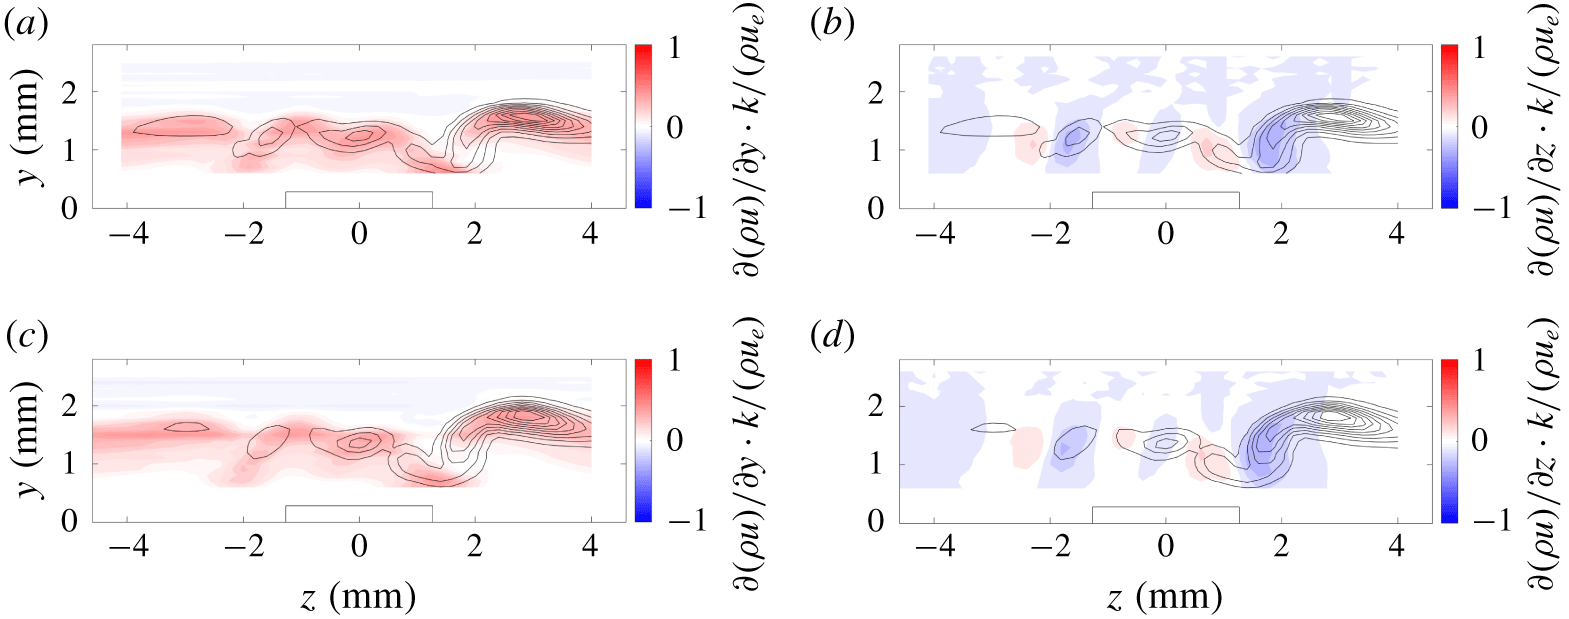
Figure 27 shows the contours of the r.m.s. fluctuations overlaid on the contours of the mass-flux shear in the wake of two 140-μm-tall CREs spaced four diameters apart. The regions of constant r.m.s. mass-flux fluctuations are marked by the solid black lines. The mass-flux shear measurements are represented in colour. Note that for the shorter CREs, the mass-flux shear is much lower in amplitude than for the other roughness elements used in this experiment, so the scaling of the colour contours is different. The wall-normal mass-flux shear is given on the left, and the spanwise mass-flux shear is given on the right. The r.m.s. mass flux appears to be concentrated in a region where both the wall-normal and the spanwise mass-flux shear are high. However, the shape of the regions that contain higher r.m.s. mass-flux fluctuations matches that of the spanwise mass-flux shear much more closely than the shape of the contours given by the wall-normal mass-flux shear. This correlation between the r.m.s. fluctuations and the shear indicates that the dominant instability in the wake of the 140-μm-tall CREs is odd.
Colour contours of mass-flux shear with r.m.s. mass-flux fluctuation contour lines overlaid for two CREs spaced  $4D$ apart (
 $x-x_{0}=34.6D$) with
 $k\approx 140~\unicode[STIX]{x03BC}\text{m}$ at
 $x=179.7~\text{mm}$: (a) wall-normal mass-flux shear and (b) spanwise mass-flux shear.

Similar analysis was performed for the taller CREs, which showed the presence of a different mode in the wake of the roughness elements. Figure 28 shows the contours of mass-flux shear in the wake of two 280-μm-tall CREs spaced four diameters apart. The wall-normal mass-flux shear in figure 28 corresponds to the region of highest r.m.s. mass-flux fluctuations that is centred on the wake centreline. For this height of CREs, the correlation between the r.m.s. fluctuations and mass-flux shear indicate that the dominant instability is even.
Two regions of higher r.m.s. mass-flux fluctuations centred at  $z=\pm 1.5~\text{mm}$ are also noted in the wake of the taller CREs. These two smaller regions appear to correspond to the regions where the spanwise mass-flux shear are greater. However, in the end, the region of the wake that appears to transition first is located on the centreline of the wake, so the even mode still appears to be the dominant mode that is ultimately responsible for transition behind the 280-μm-tall CREs.
Colour contours of mass-flux shear with r.m.s. mass-flux fluctuation contour lines overlaid for two CREs spaced  $4D$ apart (
 $x-x_{0}=15.3D$) with
 $k\approx 280~\unicode[STIX]{x03BC}\text{m}$ at
 $x=110.6~\text{mm}$: (a) spanwise mass-flux shear and (b) wall-normal mass-flux shear.

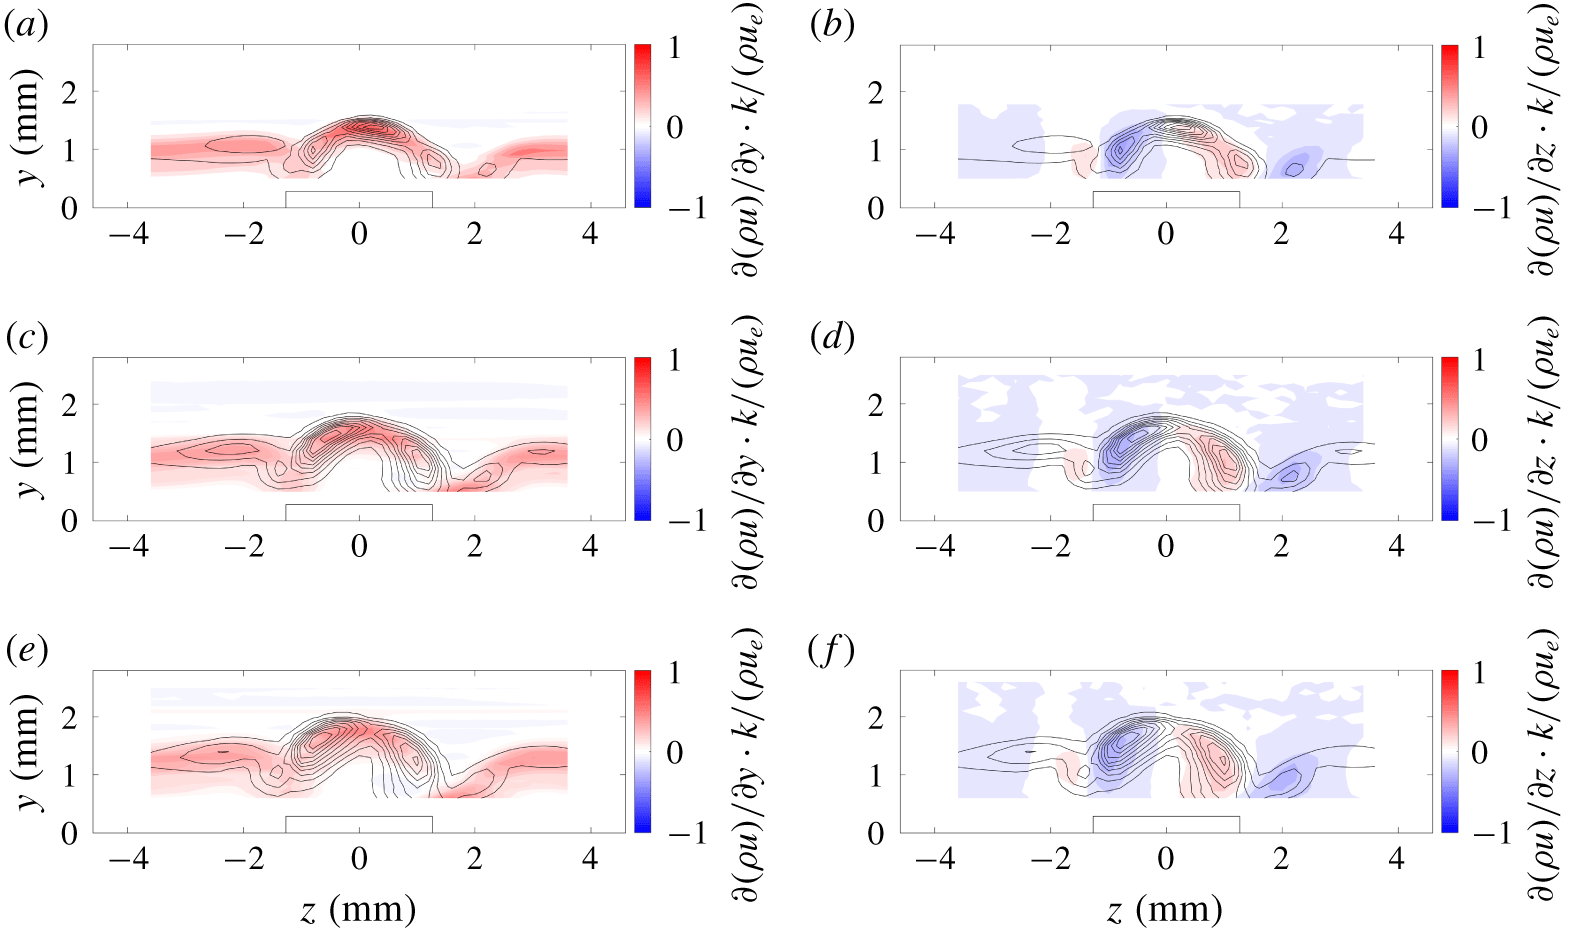
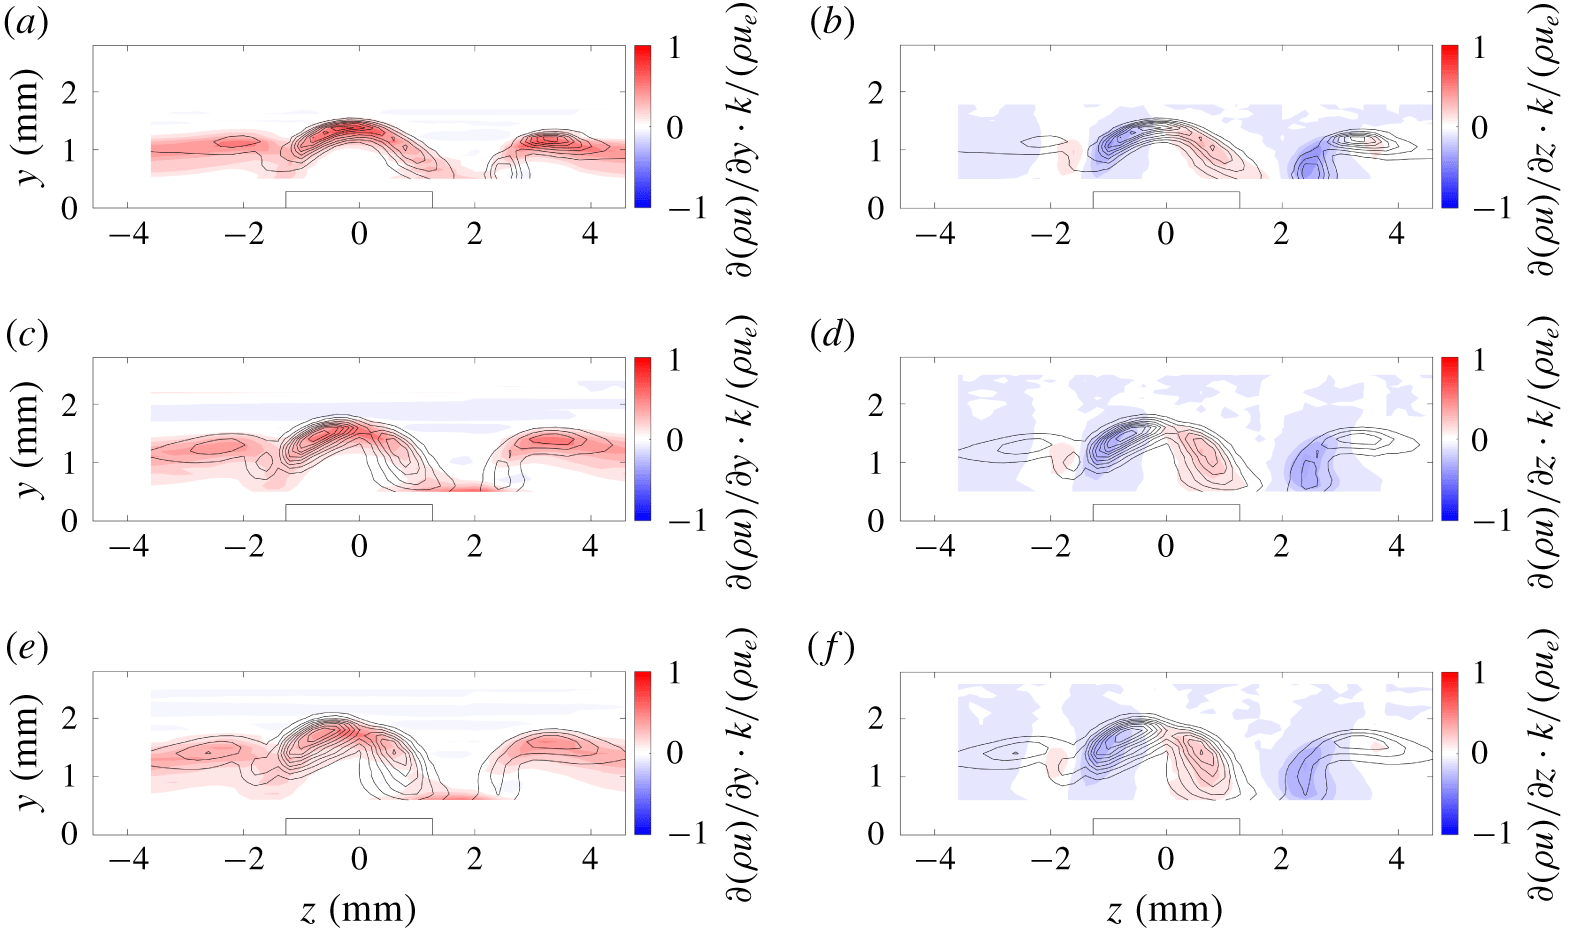
The single RRE rotated + 45° from the leading edge of the plate appears to have two distinct modes, two of which are centred at 55 kHz and 95 kHz. The contour plots of the r.m.s. mass-flux fluctuations centred at 55 kHz overlaid on the mass-flux shear are provided in figure 29. The first station shown at  $x-x_{0}=19.3L$ shows that the region of highest r.m.s. mass-flux fluctuations corresponds strongly to the wall-normal mass-flux shear. The second station at
 $x-x_{0}=30.4L$ and the third station shown at
 $x-x_{0}=38.6L$ in figure 29 contain regions of higher r.m.s. mass-flux fluctuations in regions that correspond more strongly to the spanwise mass-flux shear.
The r.m.s. mass-flux fluctuations centred at 55 kHz (lines) overlaid on the mass-flux shear (colour) in the wake of the single RRE oriented 45° from the leading edge of the flat plate: (a,b) at  $x=110.6~\text{mm}$, or
 $x-x_{0}=19.3L$; (c,d) at
 $x=153.8~\text{mm}$, or
 $x-x_{0}=31.4L$; and (e,f) at
 $x=179.7~\text{mm}$, or
 $x-x_{0}=38.6L$. Panels (a,c,e) are the wall-normal mass-flux shear, and panels (b,d,f) are the spanwise mass-flux shear.

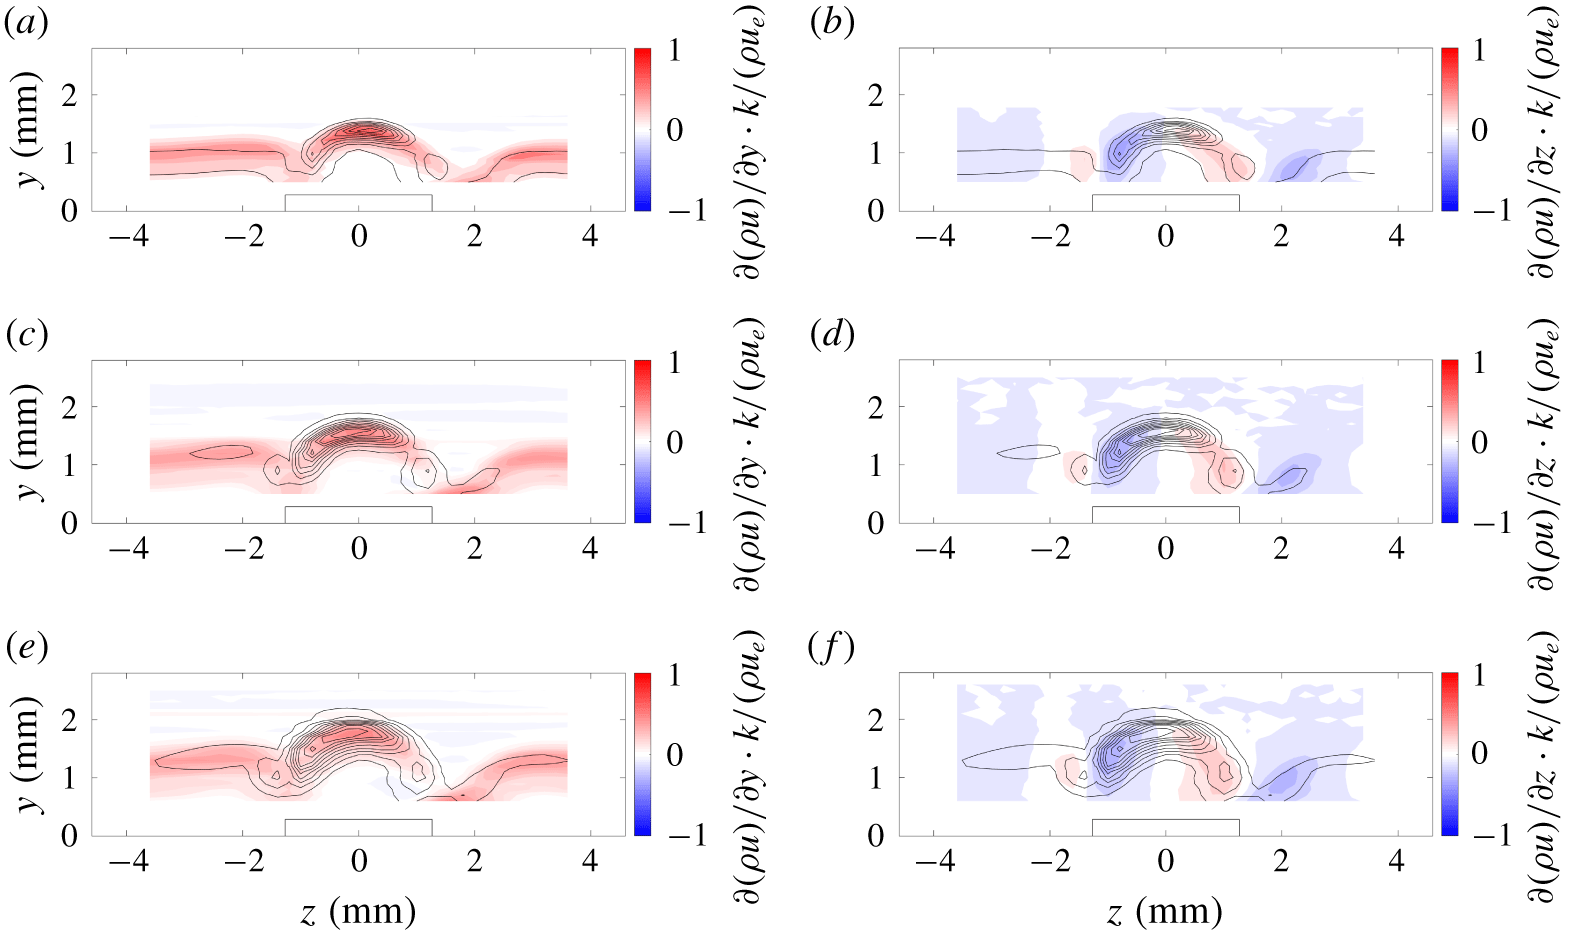
The contour plots of the r.m.s. mass-flux fluctuations for the single RRE centred at 95 kHz overlaid on the mass-flux shear are provided in figure 30. The regions of higher r.m.s. mass-flux fluctuations centred at 95 kHz all appear to agree spatially with the contours for regions of higher wall-normal shear. Thus, the 95 kHz instability in the wake of the single RRE appears to be an ‘even-like’ mode, behaving similarly to an even mode in the wake of a symmetric roughness element. This mode, however, does not appear to be the mode responsible for transition, since the amplitudes of the r.m.s. fluctuations centred at 55 kHz are much larger and the 95 kHz mode disappears at the farthest downstream measurement station. Thus, transition is probably caused by an ‘odd-like’ mode centred at approximately 55 kHz.
The r.m.s. mass-flux fluctuations centred at 95 kHz overlaid on the mass-flux shear in the wake of a single RRE oriented 45° from the leading edge of the flat plate: (a,b) at  $x=110.6~\text{mm}$, or
 $x-x_{0}=19.3L$; (c,d) at
 $x=153.8~\text{mm}$, or
 $x-x_{0}=31.4L$; and (e,f) at
 $x=179.7~\text{mm}$, or
 $x-x_{0}=38.6L$. Panels (a,c,e) are the wall-normal mass-flux shear, and panels (b,d,f) are the spanwise mass-flux shear.

The power spectra in figure 18 show that the wake of the RREs that are both rotated to + 45° from the leading edge of the flat plate contains fluctuations centred at approximately 55 kHz and 75 kHz. Again, the 55 kHz instability ultimately dominates the power spectra and appears to be responsible for transition in the wake. The mode shapes of both the 55 kHz and 75 kHz instabilities in figure 24 appear to be fairly similar. The only difference between the two appears to be that the 75 kHz instability is stronger in a region centred approximately at  $z=3.5~\text{mm}$, and only at the most upstream station shown (
 $x-x_{0}=17.3L$). Thus, only the 55 kHz instability is analysed further in this section.
A comparison of the r.m.s. mass-flux fluctuations centred at 55 kHz is overlaid on the mass-flux shear in figure 31. This shows that at the most upstream station shown ( $x-x_{0}=17.3L$), the region of higher r.m.s. fluctuations seems to correspond fairly well to the increase in wall-normal mass-flux shear. These regions of higher-amplitude r.m.s. fluctuations even correspond to the wall-normal mass-flux shear away from the centreline, near
 $z=3.5~\text{mm}$. At farther downstream stations (
 $x-x_{0}=29.4L$ and
 $36.6L$), the regions of higher-amplitude r.m.s. mass-flux fluctuations between
 $z=\pm 2~\text{mm}$ correspond well to the spanwise mass-flux shear. The region of higher r.m.s. mass-flux fluctuations near
 $z=3.5~\text{mm}$ appears to correspond to the wall-normal mass-flux shear. Because the amplitude of the r.m.s. mass-flux fluctuations between
 $z=\pm 2~\text{mm}$ are larger than those in the
 $z=3.5~\text{mm}$ region, the fluctuations near the centreline are expected to cause transition in a region well beyond the measurement region for the experiment. Thus, the dominant instability in the wake of these two RREs with the same rotation appears to be an ‘odd-like’ mode centred at 55 kHz. This result is consistent with transition behind the single RRE.
The r.m.s. mass-flux fluctuations centred at 55 kHz overlaid on the mass-flux shear in the wake of two RREs both rotated + 45° from the leading edge of the flat plate: (a,b) at  $x=110.6~\text{mm}$, or
 $x-x_{0}=17.3L$; (c,d) at
 $x=153.8~\text{mm}$, or
 $x-x_{0}=29.4L$; and (e,f) at
 $x=179.7~\text{mm}$, or
 $x-x_{0}=36.6L$. Panels (a,c,e) are the wall-normal mass-flux shear, and panels (b,d,f) are the spanwise mass-flux shear.

The configuration with two RREs with opposing orientations (± 45° from the leading edge) appeared to have only one dominant frequency of fluctuations in the wake centred at 65 kHz (figure 18). The mode shape of this particular instability showed higher r.m.s. fluctuations away from the centreline, near the  $z=3~\text{mm}$ region of the wake (figure 25). Figure 32 shows the r.m.s. fluctuation contours overlaid on the mass-flux shear. The regions of higher r.m.s. fluctuations near the centreline appear to correspond well to the spanwise mass-flux shear. However, the region outside of this at
 $z=3~\text{mm}$ has higher-amplitude fluctuations and this region corresponds well to the wall-normal mass-flux shear. Transition was not detected in the measurement region of the experiment, so from the amplitudes of the r.m.s. fluctuations, it is only possible to say that the largest-amplitude instability in the wake of this configuration of RREs is an ‘even-like’ mode centred at approximately 65 kHz away from the centreline of the roughness element.
The r.m.s. in the wake of the two RREs oriented in opposite directions at  $\pm 45^{\circ }$ from the leading edge of the flat plate: (a,b) at
 $x=179.7~\text{mm}$, or
 $x-x_{0}=36.6L$; and (c,d) at
 $x=218.4~\text{mm}$, or
 $x-x_{0}=47.4L$. Panels (a,c) are centred at
 $f=55~\text{kHz}$ (for reference), and panels (b,d) are centred at
 $f=65~\text{kHz}$.

9 Discussion and conclusion
A careful investigation on the interaction between roughness elements in a streamwise configuration is used to determine how these elements might interact for a larger distribution of roughness elements. The choice of streamwise arrays or tandem roughness could be representative of arrays of sensors or brackets on the surface of a supersonic vehicle. Linear stability theory can be used to predict the relative growth of the instabilities in the wake of these roughness elements. However, these types of computations cannot easily identify which modes induce transition in the wake of the arrays of roughness elements without some knowledge of initial amplitudes. Computational methods such as direct numerical simulations can also help identify the modes that cause transition, but may be too expensive to use as a design tool and still require some knowledge of the free-stream disturbance field or initial amplitudes. Detailed surveys in the wake of these roughness elements in a highly controlled environment can help to identify which modes are relevant for further investigation and thus are critical for developing models of roughness-induced transition. Through identification of the instability modes responsible for transition, better physical models can be formed of how the instabilities in the wake of roughness elements interact.
CREs and RREs were placed on the surface of a flat plate and arranged in a streamwise array on a highly polished flat-plate model in the Supersonic Low Disturbance Tunnel. The CREs were approximately 140 μm and 280 μm tall and arranged in configurations with up to three roughness elements spaced  $2D$ and two elements spaced
 $4D$ apart. The RREs were approximately 280 μm tall and spaced
 $2L$ apart, but angled at + 45° or - 45° relative to the leading edge to investigate the effects of an asymmetric roughness element. Multiple roughness elements spaced
 $2D$ or
 $2L$ apart appeared to move the transition location downstream by as much as the distance between the first and last element in the streamwise array. The two CREs spaced
 $4D$ apart shifted the transition location forward by approximately
 $10D$ relative to the most downstream roughness in the streamwise array. The implication of this result is that, for specific conditions, it may be possible to space unavoidable roughness sources in a manner that would help to delay transition rather than promote it.
The addition of roughness elements of the same height in the streamwise direction did not change the peak frequency of the dominant instability in the wake of each roughness configuration. Despite that the spacing between the taller CREs appeared to change the transition location, the peak frequency of the instability in the wake of the streamwise CRE arrays was always an even mode staying centred somewhere between 65 and 85 kHz. The wake behind the shorter CREs did not transition, but an odd-mode instability centred at 45 kHz was present, regardless of the number of roughness elements and spacing of the elements in the array. A similar result is seen for an asymmetric wake behind the RREs, where the addition of a second RRE downstream with the same orientation continues to have the same dominant odd mode at 55 kHz in the wake. The addition of a downstream RRE with opposite orientation appears to be the only time that the instability mode changes to a 65 kHz instability and the location of the region of highest r.m.s. fluctuations. The boundary layer did not transition in the wake of the RREs, but the instabilities in the wake of the RREs with the same orientation may have approached saturation amplitude. That the frequency, mode type and growth rate of these instabilities are insensitive to the number of elements in the streamwise array seems to indicate that the spacing of these elements changes the amplitude of the wake instability.
It may not be necessary to model all of the roughness elements in a streamwise array to know which instabilities will dominate the flow field. The identification of the dominant boundary layer instabilities behind a single roughness element may be sufficient to model the physics of the wake of streamwise arrays of same-shape and same-orientation roughness elements. While this may depend on other factors as well, there is at least a small family of roughness elements and conditions that have been identified in the work shown here that allow for this kind of simplification. Vehicle designers may also benefit from this study, knowing that the separation for discrete roughness elements could prove beneficial in delaying transition and that mean-flow analyses may be sufficient in determining what that separation needs to be. The parameter space to study the interaction of roughness elements is large, and this is a first step towards determining how these elements interact in a streamwise configuration. A careful measurement of these instabilities in the boundary layer helps to create a better understanding of the underlying physics of the problem and to identify what parameters affect these physics. Through the discovery of the physics behind the roughness-induced transition process, it becomes easier to determine what parameters are necessary to investigate in detail for vehicle design.
Acknowledgements
This work was performed under the Revolutionary Computational Aerosciences discipline under the Transformational Tools and Technologies Project of the NASA Transformative Aeronautics Concepts Program. The authors would also like to thank R. Difulvio and R. Clark for their support of the wind tunnel testing.
Declaration of interests
The authors report no conflict of interest.