I. INTRODUCTION
Palladium (Pd) nanostructures such as nanocubes and nanoparticles have been adapted in various applications including hydrogen storage, bio/chemical sensors, and biomedicine, and their properties and applicability are closely related to the shape, size, and density. Reference Wolfe, Singer, Yang and Buchwald1–Reference Gavia and Shon14 For example, due to the high surface to volume ratio, the Pd nanostructures possess a much enlarged reactive surface area when compared to the bulk counterpart and thus have been applied as catalysts in a wide range of chemical reactions such as carbon–carbon coupling, electrochemical oxidations, hydrogenation, and de-hydrogenation. Reference Wolfe, Singer, Yang and Buchwald1–Reference Vilé, Albani, Nachtegaal, Chen, Dontsova, Antonietti, Lopez and Perez-Ramirez7 Furthermore, owing to the localized surface plasmon resonance, the Pd nanoparticles (NPs) can induce size-dependent spectral absorption in the ultraviolet (UV) and visible regions Reference Le Ru and Etchegoin15,Reference Langhammer, Yuan, Zorić and Kasemo16 and hence can be utilized as the substrates for the surface enhanced Raman spectroscopy (SERS), especially the deep UV SERS. Reference Cui, Wang, Wu, Ren and Tian17,Reference Cui, Mahajan, Cole, Soares, Bartlett, Baumberg, Hayward, Ren, Russell and Tian18 The properties exhibited by Pd nanostructures are strictly dependent on their surface morphologies, and thus, a systematical and precise control of Pd nanostructure fabrication can be an essential step for further development of a number of related applications. On the other hand, GaN possesses a wide band gap and high thermal conductivity, serving as an indispensable material in optoelectronics and high-temperature/high-power electronics. However, the systematical evolution of Pd nanostructures on GaN is still deficient up to date. Therefore, in this paper, we demonstrate the systematical evolution of Pd nanostructures on the hexagonal c-plane GaN. With the control of deposition amounts at three distinctive annealing temperatures, the Pd nanostructures including round-isolated nanoparticles, wiggly nanostructures, and voids are fabricated through the solid-state dewetting (SSD). The configuration, size, density, and spacing are analyzed based on the atomic force microscope (AFM) top-, side-views, line-profiles, energy-dispersive X-ray spectroscope (EDS) spectra and root mean squared roughness (Rq), and surface area ratio (SAR). Furthermore, the evolution of reflectance,photoluminescence (PL), and Raman spectra is also studied and the spectral intensity, and peak positions are discussed in conjunction with the surface morphology.
II. EXPERIMENTAL
A. Preparation of substrate and materials
The c-plane GaN substrates utilized in this work were obtained by vapor phase epitaxy (VPE)-grown templates on sapphire with the epilayer thickness of ∼5 µm (PAM-XIAMEN Co. Ltd., Xiamen, China). Initially, the wafers were diced into 6 × 6 mm2 squares and processed with thermal degassing at 350 °C for 30 min under 1.0 × 10⁻⁴ torr to remove the surface contaminants such as various particles, trapped air, oxides, and water vapor. As shown in the Supplementary Material Fig. S1, the GaN Raman spectrum exhibited a E2 peak at 569 cm−1 and an A1(LO) peak at 736 cm−1, and the atomic steps of bare GaN can be clearly observed with the AFM side-view in the inset. A (Pd) target with a purity of 99.999% was prepared for the subsequent film depositions.
B. Fabrication of Pd nanostructures
The Pd films were prepared by plasma-assisted sputtering in an ion-coater chamber with an ionization current of 3 mA under 1.0 × 10⁻¹ torr. Various Pd thicknesses between 1 and 30 nm were systematically deposited on the degassed GaN samples for the investigation on the deposition amount (DA) variation. The film thickness was precisely controlled by the duration of deposition at the rate of 0.05 nm/s. The surface morphologies of as-deposited samples are shown in the Supplementary Material Fig. S2 along with the summary plots of the root mean squared roughness (Rq) and (SAR) that showed a gradual increase as a function of DA. Then, the deposited samples were mounted on an Inconel holder and transferred for the subsequent annealing. All samples were annealed at each target temperature with an identical ramp rate of 4 °C/s under the chamber vacuum below 1.0 × 10⁻⁴ torr, which was controlled by the preprogramed recipes. To study the temperature effects on the Pd nanostructure evolution with different initial film thickness, 3 sets of samples with identical DA variations between 1 and 30 nm were separately annealed at 650, 700, and 750 °C. An equal annealing duration for 450 s was given to all samples to guarantee the sufficient surface diffusion and growth of nanostructures. As soon as the growth conditions were fulfilled, the temperature was lowered down to ambience to prevent an undesired ripening effect.
C. Pd nanostructure characterization
The surface morphology of Pd nanostructures was obtained by an AFM using the noncontact mode (XE-70, Park Systems, Seoul, South Korea). The AFM probes of tip radius <10 nm and the typical resonance frequency ∼290 KHz were utilized (NSC16/AIBS, µmasch, Watsonville, California). The XEI software was used to obtain the top- and side-views, line-profiles, and Fourier filter transform power spectra from the original AFM data. The elemental analysis was performed by an EDS (Noran System 7, Thermo Fisher, Waltham, Massachusetts). The optical measurement including reflectance, PL, and Raman were done by the UNIRAM II system (UniNanoTech, Seoul, South Korea). Light sources utilized in the reflectance measurement were halogen (450 nm ≤ wave length ≤ 1100 nm) and deuterium (250 nm ≤ wave length ≤ 450 nm) lamps. The PL and Raman spectra were excited with 266 nm and 532 ± 1 nm lasers, respectively, at an ambient temperature and detected by a charge-coupled device.
III. RESULTS AND DISCUSSION
A. Pd nanostructures by the variation of deposition amount at 700 °C
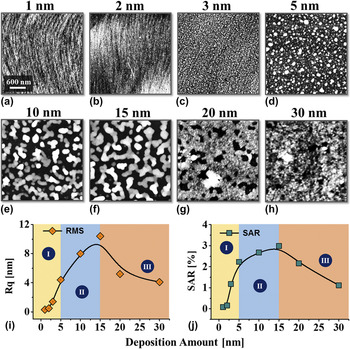
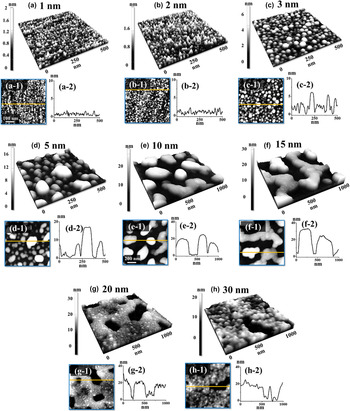
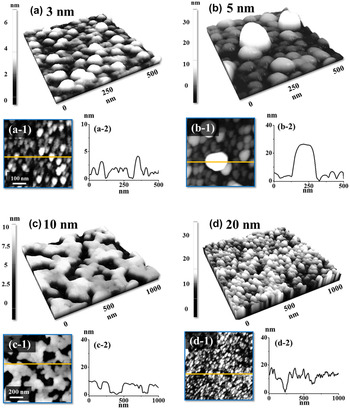
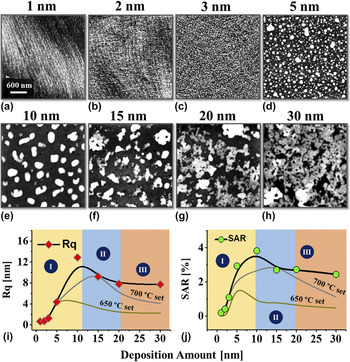
Figure 1 shows the overall evolution of Pd nanostructures on the c-plane GaN with the systematical variation of Pd DA between 1 and 30 nm at 700 °C. The Pd nanostructures with various configurations are presented by the AFM top-views, side-views and line-profiles in Fig. 2 and the large-scale AFM side-views are provided in the Supplementary Material Fig. S3. Generally, depending on the surface morphologies, three distinctive growth regimes were clearly observed: (i) the formation of densely packed(NPs) between 1 and 5 nm, (ii) the wiggly Pd nanostructures between 5 and 15 nm, and (iii) the voids and layer formation between 15 and 30 nm. The formation of Pd nanostructures from the deposited thin films can be initiated with the SSD process along with the surface/interface energy minimization mechanism. Naturally, at room temperatures sputtering-deposited Pd films are thermodynamically metastable or unstable containing a lot of atomic vacancies, defects, and crystalline imperfections. Reference Thompson19,Reference Zhao, Lee and Lee20 When sufficient thermal energy is supplied, the Pd adatoms can begin to diffuse and induce the nucleation of pinholes from the vacancies in the as-deposited film. Along with the SSD process, the pinholes will develop to be larger, and at the same time, the development of large pinholes throughout the film can occur and thus can result in the rupture of the continuous layer. Reference Zhao, Lee and Lee20–Reference Ruffino and Grimaldi22 The growth rate of pinholes v pinhole that determines the SSD strongly depends on the temperature T as well as the film thickness t f Reference Wang and Schaaf21,Reference Danielson, Sparacin, Michel and Kimerling23 :
 $${v_{{\rm{pinhole}}}} \propto {{{D_{\rm{s}}}} \over T}{1 \over {t_{\rm{f}}^3}}\;\quad ,$$
where the D s is the surface diffusion coefficient that can be further expressed as Reference Ruffino, Canino, Grimaldi, Giannazzo, Bongiorno, Roccaforte and Raineri24 :
 $${D_{\rm{s}}}\left( T \right) = {D_{{\rm{s}}0}}\exp \left( { - {{{E_{\rm{A}}}} \over {kT}}} \right)\quad ,$$
where the D
s0, E
A, and k are the preexponential factor, activation energy, and Boltzmann constant. Indicated by Eq. (1), the first term
 ${{{D_{\rm{s}}}} \over T}$
reveals the temperature dependent diffusion effect on the void development. However, the effect can be excluded as T was fixed in this set. Under this situation, ignoring other minor factors, the SSD can be closely determined by the film thickness t
f, in which the growth rate v
pinhole can be significantly decelerated with the increased t
f as the term is in a reciprocal cube. Meanwhile, guided by the greater binding energy between the Pd adatoms than that between Pd and substrate atoms, the 3-D Pd nanostructures can be fabricated according to the Volmer–Weber growth model.
Reference Volmer and Weber25,Reference Venables, Spiller and Hanbucken26
With sufficient thermal energy at 700 °C, the Pd adatoms would freely diffuse on the surface to form 3-D islands and therefore, the individual NPs were formed with the DA between 1 and 5 nm as seen in Figs. 1(a)–1(d). In specific, with the Pd thickness of 1 and 2 nm, the tiny NPs were formed densely with the typical height of 1–2 nm as evidenced by the line profiles in Figs. 2(a-2)–2(b-2). With the increased DA, the Pd nanostructure size expansion occurs to lower the overall surface energy as the larger NPs possess lower surface energy.
Reference Sui, Li, Kim and Lee27
Accordingly, with the 3 nm DA, the NPs were formed in larger dimensions and the density was correspondingly decreased as a compensation which can be seen in Figs. 2(c) and 2(c-1). Notably, with the 3 nm DA, the majority of Pd NPs adopted a round shape depicting the isotropic energy distribution.
Reference Li, Lu, Mei, Dong, Zheng, Gao, Tsukamoto and Cao28
In regime (ii), the NPs were preferably formed in irregular shapes at 5 nm, likely due to the breakage of energy isotropy with the increased volume as clearly shown in Figs. 2(d) and 2(d-1). In terms of nanostructure size, the typical height of NPs reached over 10 nm as evidenced by the line profile in Fig. 2(d-2). With the further increased DA of 10 nm, the lateral expansion of nanostructures occurred as seen in Figs. 1(e) and 2(e), and the nanostructures adopted a wiggly configuration based on the interrupted coalescence growth model.
Reference Ruffino and Grimaldi29,Reference Ruffino and Grimaldi30
The coalescence growth model indicates that the lateral growth and merging between nanostructures can occur along with the increased DA and correspondingly, the wiggly nanostructures with 15 nm showed the enlarged lateral dimension as seen in Fig. 2(f). Accompanied by the coalescence of nanostructures, the height of resulting nanostructures was also increased. As evidenced by the line profiles in Figs. 2(e-2)–2(f-2), the typical height of wiggly nanostructures reached over 20 nm with the DA of 10 and 15 nm. The agglomeration of wiggles can adopt various configurations depending on the materials as well as substrates.
Reference Sui, Li, Kim and Lee27,Reference Sui, Pandey, Li, Zhang, Kunwar and Lee31–Reference Lee, Li, Sui, Zhang, Pandey, Kim and Lee34
Here, the agglomeration of Pd nanostructures can take the approach through grain boundary grooving.
Reference Du, Xue, Zhang, Xia, Li and Han11
On the other hand, the isolated dome configuration may not be sustained due to the large volume of NPs, so that they can develop with the facets or elongate randomly in order and release the surface energy. With the further increased DA over 20 nm, the coalesced Pd layers with voids were observed instead of the isolated nanostructures in the last regime as seen in Figs. 1(g) and 1(h). As discussed above, the SSD can be significantly slowed down by the increased thickness. That means the agglomeration of isolated nanostructures can be significantly deaccelerated and thus can result in partially dewetted films with the void formation at identical annealing temperatures and duration.
Reference Wang and Schaaf21,Reference Danielson, Sparacin, Michel and Kimerling23
With the 20 nm DA, the voids of typical depth around 20 nm were formed as seen in Figs. 2(g) and 2(g-2). Finally, at 30 nm, the significant size reduction of voids was observed due to the further inhibition of dewetting as evidenced by Figs. 1(g) and 1(h). The root mean squared roughness (Rq) and SAR of corresponding samples also reflect the morphology evolution of Pd nanostructures as seen in Figs. 1(i) and 1(j). The Rq is the root mean squared average height for each pixel on the surface,
 $\sqrt {{1 \over n}\sum\limits_{i = 1}^n {y_i^2} }$
, sensitive to the height change. SAR is calculated by:
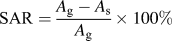 ${\rm{SAR}} = {{{A_{\rm{g}}} - {A_{\rm{s}}}} \over {{A_{\rm{g}}}}} \times 100\%$
, where the A
g and A
s are the geometric area and surface area respectively, sensitive to the size and density of nanostructures. Generally, the Rq and SAR were both increased in regimes (i) and (ii) while decreased in regime (iii). Specifically, in regime (i), owing to the dimensional increase of NPs, the Rq was increased from 0.3 to 4.5 nm by 15 times. At the same time, the SAR was increased from 0.08 to 2.68% by 33.5 times. In regime (ii), as the wiggly nanostructures were formed with the increased dimension, the Rq was continuously increased to 10.4 nm by 2.31 times whereas the corresponding SAR was slightly increased to 3.00% by 1.12 times. In regime (iii), owing to the coalescence of nanostructures and further layer formation, the Rq and SAR were both gradually decreased as seen in the plot in Figs. 1(i) and 1(j). The specific values of Rq and SAR are provided in the Supplementary Material Table SI. The EDS spectra for the Pd nanostructures of 700 °C is shown in the Supplementary Material Fig. S4. Each spectrum consisted of N (Kα at 0.39 keV), Ga (Lα1 at 1.10 keV, Lλ at 0.97 keV), and Pd (Lα1 at 2.85 keV, Lβ1 at 2.99 keV) peaks which were observed, and the intensity of Pd, Lα1, and Lβ1 peaks were consistently increased along with the DA. The intensities of the Pd Lα1 peak for each sample are summarized with respect to the DA. From the quantitative analysis, the intensity of the Pd Lα1 peak was ∼500 for 1 nm sample and then the intensity gradually increased to ∼1500 counts for the 30 nm sample, which confirmed the appropriate Pd deposition with the increased DA.
Evolution of self-assembled Pd nanostructures on c-plane GaN by the variation of Pd deposition amount between 1 and 30 nm at 700 °C for 450 s. (a)–(h) atomic force microscopy (AFM) top views of 3 × 3 µm2. Summary plots of (i) root mean squared roughness (Rq) and (j) SAR as a function of Pd DA.

Surface morphology transition of Pd nanostructures from nanoparticles to wiggly nanostructures and void-layer based on the deposition amount variation between 1 and 30 nm at 700 °C. (a)–(d) AFM side-views of 500 × 500 nm2. (e)–(h) AFM side-views of 1 × 1 µm2. (a-1)–(h-1) Corresponding AFM top views. (a-2)–(h-2) Cross-sectional line profiles exhibiting the height information denoted by the lines in (a-1)–(h-1).

B. Optical characterization of Pd nanostructures on c-plane GaN
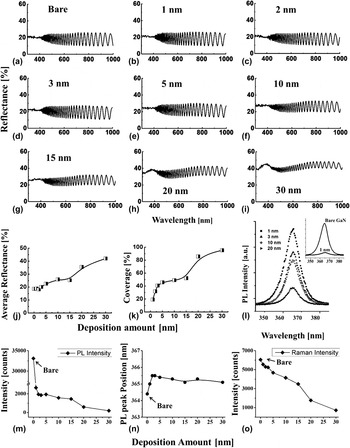
Figures 3(a)–3(i) show the reflectance spectra of Pd nanostructures on GaN fabricated with the variation of DA at 700 °C. As exhibited, the reflectance spectra were observed with the characteristic fringe pattern in the region beyond 400 nm due to the interference of multireflected photons from the VPE-grown structure of GaN on sapphire. Reference Lian, Li and Liu35 Generally, the variation of reflectance highly depends on the morphological evolution of Pd nanostructures. As seen in Figs. 3(b)–3(i), the reflectance was gradually enhanced with the fabrication of Pd nanostructures along with the increased DA and the average reflectance for the set is plotted as a function of the DA in Fig. 3(j). With the smaller DA of 1 and 2 nm, the average reflectance was observed comparable to the bare GaN and then with the increased DA between 3 and 30 nm, it gradually increased from ∼18 to ∼42% by 2.33 times. The evolution can be attributed to the increasing nanostructure coverage as seen in Fig. 3(k) which is induced by the formation of Pd wiggling nanostructures and voids via the coalescence of NPs as discussed before. As metallic layers usually possess high reflectivity, the increased coverage can correspondingly enhance the reflectance. Reference Fabian, Lewis, Newe and Lochmann36 In the meantime, the gradual increase in the Pd deposition amount also showed changes in the spectral shape. For example, the amplitude of interference fringes was clearly reduced at 20 and 30 nm as shown in Figs. 3(h) and 3(i). Also, the development of peak at ∼380 nm was observed in the UV region, which can be attributed to the absorption edge induced by the Pd nanostructures in the UV region. Reference Yannopapas37,Reference Leong, Chu, Ibrahim and Saravanan38 The specific values of average reflectance are provided in the Supplementary Material Table SII. Figures 3(l)–3(n) present the PL spectra of the Pd nanostructures on GaN fabricated with the variation of Pd DA at a fixed temperature. Figure 3(l) presents the PL spectra of the Pd nanostructures on GaN fabricated with the variation of Pd DA at a fixed temperature. The PL spectra within the wave length range between 340 and 400 nm are summarized for the 1, 3, 10, and 20 nm samples to exhibit the spectral evolution. The peak intensity and position of the spectra are correspondingly plotted as functions of the DA in Figs. 3(m) and 3(n) and the spectra for all the samples are provided in the Supplementary Material Fig. S4. The spectrum of bare GaN is combined with the spectrum of 1 nm sample as an inset, showing an intense emission band centered at 364.4 nm. Reference Mandal, Kundu, Ghosh and Pal39 Noticeably, the PL emission intensity was largely reduced with the fabrication of Pd nanostructures as shown in Fig. 3(l). The decrease was drastic, especially, between bare and 2 nm DA and then, the signal slowly weakened up to 30 nm. The reduced PL, on the one hand, can be derived from the inhibited recombination of electron–hole pairs induced by the increased nanostructure coverage as seen in Fig. 3(k), Reference Li and Wang40,Reference Liang, Guo, Li, Li, Ji and Gan41 and on the other hand, the tensile strains generated between the Pd nanostructures and GaN can also play an important role. Reference Zhang, Yu, Hao, Wu, Dai, Shao, Zhang and Tian42,Reference Aumer, LeBoeuf, Bedair, Aumer, Smith, Lin and Jiang43 As reported in the previous investigation of GaN, both compressive and tensile strains to the GaN substrates can lead to the spatial separation between electrons and holes, hindering the electron–hole coupling. Consequently, the electron–hole recombination rate can be deaccelerated and result in a weakened PL emission. Reference Aumer, LeBoeuf, Bedair, Aumer, Smith, Lin and Jiang43 Along with the decreased PL emission intensity, the emission band shift was also observed, which could be due to the tensile strain. As clearly observed in Fig. 3(n), the GaN peak was slightly right-shifted with the fabrication of Pd nanostructures of 1 nm DA and then, continuously right-shifted of ∼1.2 nm at 2 and 3 nm. Then, with the DA between 5 and 30 nm, the red-shift of peak was slightly recovered and ranged from 365.5 to 365 nm. The plot showed larger right shifts at relatively lower DA, which suggests that stronger tensile strains can be generated with well-developed nanoparticles in the regime (i). The specific values of peak intensity, position, and full width at half maximum (FWHM) are summarized in the Supplementary Material Table SIII. The Raman spectra of corresponding samples are shown in the Supplementary Material Fig. S4, and the E2 peak (569 cm−1) intensity of each sample is summarized in Fig. 3(o). Reference Ishioka, Kato, Ohashi, Haneda, Kitajima and Petek44 As seen in Fig. 3(o), the Raman signal intensity was decreased from ∼6000 to 715 counts by 8.46 times in a generally linear trend. As a probable assumption, unlike the PL measurement, the tensile strains have a minor effect on the Raman intensity, and instead, the decrement can be mainly induced by the increased surface coverage, with which more photons are scattered or absorbed by the nanostructures as discussed in the reflectance section. Evidenced by the peak position summary shown in the Supplementary Material Fig. S4, no obvious Raman peak shift trend was witnessed with the increased DA. The specific values of Raman peak intensity, position, and FWHM are listed in the Supplementary Material Table SIV.
(a)–(i) Reflectance spectra of the Pd nanostructures on GaN fabricated with the variation of Pd deposition amount between 1 and 30 nm at 700 °C. (j) Average reflectance, and (k) surface coverage of 700 °C set. (l) Corresponding PL spectra. PL peak (m) intensity, (n) position, and (o) Raman E2 peak intensity plotted as functions of the deposition amounts.

C. Pd nanostructures by the variation of deposition amount at 650 °C
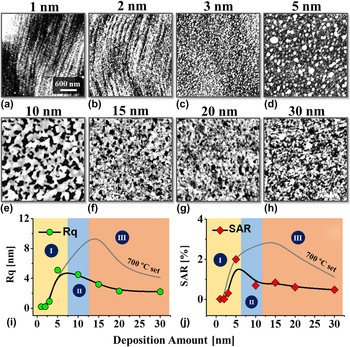
Figure 4 shows the Pd nanostructures fabricated on the c-plane GaN at 650 °C with the identical variation of DA between 1 and 30 nm. The small-scale AFM side-views, top-views, and corresponding line-profiles are shown in Fig. 5. The corresponding large-scale AFM side-views are provided in the Supplementary Material Fig. S5. Generally, similar to the previous set at 700 °C, three growth regimes were observed at 650 °C. For example, the formation of isolated Pd NPs was observed between 1 and 5 nm in regime (i) which is based on the sufficient surface diffusion and Volmer–Weber growth model as seen in Figs. 5(a) and 5(b). The height of NPs was gradually increased as evidenced by the line profiles in Figs. 5(a-2)–5(b-2). Then, with the increased DA, the formation of network-like nanostructures was observed instead of the wigglys at 10 nm in regime (ii). The Pd network can be formed due to limited surface diffusion causing less dewetting as the temperature was reduced and the height of typical networks reached ∼10 nm as shown in Fig. 5(c-2). Finally, in regime (iii), the formation of Pd layers and tiny voids was observed between 15 and 30 nm as seen in Fig. 5(d). While the three growth regimes were observed, the growth regimes were noticeably shifted for similar DA range in comparison with the results at 700 °C. The growth regime shift can be clearly seen in the plots of surface parameters, Rq and SAR, in Figs. 4(i), 4(j) and 1(i), 1(j). For instance, the formation of NPs [regime (i)] was observed between 1 and 5 nm in both sets. However, the formation of network-like nanostructures [regime (ii)] appeared with 10 nm at 650 °C, and regime (iii) with the formation of Pd layers along with voids were observed above 15 nm. As discussed in the previous section, the dewetting of the Pd layers depends on the annealing temperature. For example, the reduced temperature can diminish the surface diffusivity because of the short diffusion length of adatoms. Reference Wang and Schaaf21,Reference Danielson, Sparacin, Michel and Kimerling23,Reference Eason and Eason45 Thus, the growth regimes were sort of left shifted with the large reduction of regime (ii) and expansion of regime (iii). The morphological evolution was also observed by the corresponding Rq and SAR as shown in Figs. 4(i) and 4(j). Generally, the Rq and SAR were both increased in regime (i) while decreased in regimes (ii) and (iii), which is another distinction from the previous set. The gradual increase of both Rq and SAR in regime (ii) was observed in the previous 700 °C set whereas, they were gradually reduced in regime (ii) due to the formation of network- and layer-like nanostructures. The specific values of Rq and SAR are provided in the Supplementary Material Table SV. In the meantime, the EDS elemental analysis, PL, and Raman spectra showed similar behaviors with the previous set as clearly summarized in the Supplementary Material Figs. S6–S9. For example, the gradual increase in the intensity of Pd Lα1 peak was observed from the EDS spectra. Also, the reflectance was gradually enhanced while the PL and Raman intensities were gradually reduced along with evolution of Pd nanostructures of large surface coverage with increased DA.
Evolution of self-assembled Pd nanostructures on the c-plane GaN at 650 °C by the variation of DA between 1 and 30 nm. (a)–(h) AFM top views of 3 × 3 µm2. Summary plots of (i) Rq and (j) SAR.

Self-assembled Pd nanoparticles fabricated on the c-plane GaN at 650 °C with the variation of Pd deposition amount from 3 to 20 nm. (a)–(b) AFM side-views of 500 × 500 nm2. (c)–(d) AFM side-views of 1 × 1 µm2. (a-1)–(d-1) Corresponding AFM top views. (a-2)–(d-2) Cross-sectional line profiles.

D. Pd nanostructures by the variation of deposition amount at 750 °C
Figure 6 shows the Pd nanostructure evolution at increased temperatures, i.e., 750 °C with identical DA variations between 1 and 30 nm. The magnified AFM top views and line profiles are shown in Fig. 7, and the side views are shown in the Supplementary Material Fig. S10. In general, the three growth regimes were observed at 750 °C where regime (i) and (ii) extended toward higher DA in comparison with the sets fabricated at 700 and 650 °C. The shift of growth regimes can be clearly compared from the plots in Figs. 6(i), 6(j), 5(i), 5(j), and 1(i) 1(j). For example, the formation of isolated NPs was observed up to 10 nm based on the enhanced surface diffusion as evidenced by Figs. 6(a)–6(e) and 7(a)–7(e) in regime (i), which is expanded to higher DA as compared with the 650 and 700 °C sets. Similarly, regime (ii) with the wiggly nanostructures was extended between 15 and 20 nm as shown in Figs. 6(f), 6(g) and 7(f), 7(g). Then, the formation of voids was observed at 30 nm in regime (iii) as the SSD was further enhanced at 700 °C. Generally, both the Rq and SAR were increased in regime (i) due to the agglomeration of NPs along with the increased size and decreased density. Then the Rq and SAR showed a gradual decrease accompanied with the lateral expansion by the coalescence between nanostructures in regimes (ii) and (iii). Noticeably, the values of Rq and SAR at 750 °C were slightly higher in comparison with the other sets, which can be attributed to the enhanced surface diffusion and dewetting as discussed. The specific values of Rq and SAR are provided in the Supplementary Material Table SVI. The EDS elemental analysis, reflectance, PL, and Raman spectra for the 750 °C set also showed similar trends as summarized in the Figs. S11–S14.
Evolution of Pd nanostructures on the c-plane GaN by the variation of deposition amounting between 1 and 30 nm at 750 °C. (a)–(d) AFM top views of 3 × 3 µm2. Summary plots of (i) Rq and (j) SAR.

Self-assembled Pd nanoparticles fabricated on c-plane GaN at 750 °C with the variation of Pd deposition amounting from 1 to 30 nm. (a)–(d) AFM side-views of 500 × 500 nm2. (e)–(h) AFM side views of 1 × 1 µm2. (a-1)–(h-1) Cross-sectional line profiles.

IV. CONCLUSIONS
In summary, the fabrication of self-assembled Pd nanostructures was successfully demonstrated on the c-plane GaN with the systematically controlled Pd DA at various annealing temperatures. Various nanostructures were fabricated through the SSD of Pd thin films and discussed based on the Volmer–Weber and coalescence growth model in conjunction with the surface diffusion and energy minimization mechanism. Generally, with the fixed range of Pd thickness between 1 and 30 nm, three distinctive growth regimes were observed: (i) isolated nanoparticles, (ii) wiggly nanostructures, and (iii) layer and voids structures. Substantial shift of the growth regimes was depicted along with the variation of temperature (i.e., between 650 and 750 °C) and attributed to the altering dewetting rate of thin films. Elemental and optical characterizations of the Pd nanostructures were correspondingly studied by the EDS, reflectance, Raman, and PL spectra and discussed based on the evolution of Pd nanostructures. The average reflectance showed direct dependency with the surface coverage of the Pd nanostructures whereas the Raman and PL reflectance exhibited an inverse relationship.
Supplementary Material
To view supplementary material for this article, please visit https://doi.org/10.1557/jmr.2017.272.
ACKNOWLEDGMENTS
Financial support from the National Research Foundation of Korea (Nos. 2011-0030079 and 2016R1A1A1A05005009), and in part by the research grant of Kwangwoon University in 2017 is gratefully acknowledged.