Introduction
Silicon nitride (Si3N4)-based materials have been extensively investigated in the last decades owing to their interesting chemical, mechanical, and optical properties.[ Reference Belyi, Vasilyeva, Gennann, Ginovker, Gritsenko, Repinsky, Sinitsa, Smirnova and Edelman 1 ] The creation of Si-quantum dots (QDs) in a SiN x host offers the several key advantages over Si oxide.[ Reference Pavesi and Lockwood 2 ] Silicon nitride is a more promising matrix for Si-QDs due to its structural stability at electronic technology processing. Better electrical properties owing to the lower tunneling barrier allow the transport of electrons and holes into Si-QDs embedded in SiN x .[ Reference Sung, Park, Shin, Kim, Kim, Cho and Huh 3 ] Additionally, the Si-QDs coordinated with oxygen atoms are subject to charge trapping at the interface states, which limit the energy of emission quantas from Si-QDs to <2 eV.[ Reference Wolkin, Jorne, Fauchet, Allan and Delerue 4 ] Since Si-QDs coordinated with nitrogen (N) atoms do not exhibit this limitation, the photoluminescence (PL) is expected to occur at energies across the wide visible spectral range.[ Reference Sung, Park, Shin, Kim, Kim, Cho and Huh 3 , Reference Park, Choi, Seong and Park 5 , Reference Dal Negro, Yi, Nguyen, Yi, Michel and Kimerling 6 ]
Si-QD formation in SiN x is also more favorable owing to the lower annealing temperature required in comparison with Si oxide.[ Reference Comedi, Zalloum, Wojcik and Mascher 7 , Reference Pratibha Nalini, Khomenkova, Debieu, Cardin, Dufour, Carrada and Gourbilleau 8 ] The Si-QD formation in SiN x films has been found to occur as a complex process, with the appearance of amorphous and crystalline clusters and a strong dependence on deposition and processing conditions.[ Reference Sung, Park, Shin, Kim, Kim, Cho and Huh 3 , Reference Delachat, Carrada, Ferblantier and Slaoui 9 , Reference Keita, En Naciri, Delachat, Carrada, Ferblantier and Slaoui 10 ]
In majority reports,[ Reference Park, Choi, Seong and Park 5 , Reference Dal Negro, Yi, Nguyen, Yi, Michel and Kimerling 6 , Reference Delachat, Carrada, Ferblantier and Slaoui 9 ] PL was ascribed to the quantum confinement effects in Si-QDs. However, other authors[ Reference Torchynska, Casas Espinola, Vergara Hernandez, Khomenkova, Delachat and Slaoui 11 – Reference Delachat 13 ] considered the radiative transitions via defects in SiN x . The variation of PL peaks with QD sizes is a basis to attribute the PL bands to the exciton recombination in Si-QDs. However, in a set of cases the different PL peaks were assigned to the Si-QDs of the same sizes in SiN x . This fact indicates that PL bands connected with the recombination of excitons in Si-QDs or carriers via SiN x defects were not discriminated clearly yet.
In this work, the luminescent properties of Si-rich-SiN x films grown by plasma-enhanced chemical vapor deposition (PECVD) were investigated versus excess Si content in the temperature range 10–300 K. The detailed analysis of the results allows getting insight in the nature of emission and non-radiative processes in the SiN x films.
Experimental details
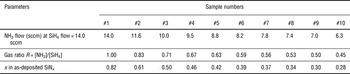
Si-rich SiN x films were grown by PECVD on p-type Si (001) substrates. To achieve different stoichiometry, the NH3/SiH4 gas flow ratio (R) was varied in the range of R = 0.45–1.0 keeping SiH4 flow constant at 14 sccm (Table I). The working pressure, plasma power, and growth temperature were 0.5 Torr, 20 W, and 350 °C, respectively. Thermal annealing at 1100 °C for 30 min in N flow was applied to produce the Si-QDs in the SiN x films.[ Reference Delachat 13 ]
Technological parameters of SiN x films.

Fourier transform infrared spectroscopy (FTIR) was recorded in the range of 460–4000 cm−1 using a Nicolet Nexus spectrometer under normal and Brewster angle (65°) configurations. PL spectra were excited by 325-nm line of a He–Cd laser with a beam power 76 mW. More details about PL experiments can be found elsewhere.[ Reference Torchynska, Goldstein, Many, Jedrzejewskii and Kolobov 14 , Reference Khomenkova, Gourbilleau, Cardin, Jambois, Garrido and Rizk 15 ] To investigate the evolution of PL with temperature in the range of 10–300 K, the films were mounted in a closed-cycle He cryostat.
To confirm the formation of Si-QDs the samples were prepared for transmission electron microscopy (TEM) observations by the standard procedure involving grinding, dimpling, and Ar+ ion beam thinning until electron transparency. Then the samples were studied by high resolution TEM (HR-TEM) on a JEOL 2100F operating at 200 keV and equipped with a corrector for spherical aberration and with the last generation of Gatan imaging filters.[ Reference Scardera, Puzzer, Perez-Wurfl and Conibeer 16 ]
Results and discussion
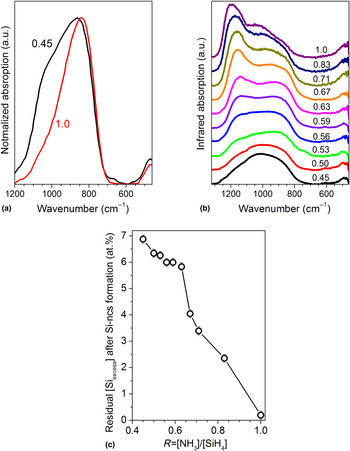
The microstructure of studied films was investigated by the FTIR method. The most efficient vibration bands in hydrogenated SiN x films are observed for Si–N (470–490, 830–870, and 1190–1200 cm−1), Si–H (650–660 and 2250–2300 cm−1) and N–H (1180–1200 and 3340–3380 cm−1) vibration modes.[ Reference Delachat, Carrada, Ferblantier and Slaoui 9 , Reference Tsu, Lucovsky and Mantini 17 ] FTIR spectra of SiN x films detected with a normal incidence show significant overlapping of Si–N vibration bands and only one broad band in the range of 600–1200 cm−1 can be seen [Fig. 1(a)]. At the same time, the spectra recorded with a Brewster incidence angle (~65°) as a rule shows well-separated Si–N bands at about 1140 and 930 cm−1, ascribed respectively to the longitudinal (LO) and transverse (TO) modes of the Si–N stretching vibration.[ Reference Delachat, Carrada, Ferblantier and Slaoui 9 , Reference Tsu, Lucovsky and Mantini 17 ]
(a) Normal-incidence FTIR spectra obtained for as-deposited SiN x films with R = 0.45 and 1.0. (b) Brewster-incidence FTIR spectra of films annealed at 1100 °C for 30 min. (c) Estimated residual Si excess in annealed films after the Si-QD formation.

FTIR spectra of all studied as-deposited films demonstrate the broad bands with the maxima at 830–880 and 460–480 cm−1 [Fig. 1(a)], which are attributed to the Si–N symmetric and asymmetric stretching vibrations, respectively.[ Reference Delachat, Carrada, Ferblantier and Slaoui 9 , Reference Tsu, Lucovsky and Mantini 17 ] The peak position of the Si–N stretching band depends on the R value demonstrating the shift to higher wavenumbers with R decreasing [Fig. 1(a)]. Such behavior can be explained by increasing the Si content in the plasma, when Si atoms have not enough N atoms to form the Si–N bonds. This will cause film disordering and broadening the FTIR bands.[ Reference Tsu, Lucovsky and Mantini 17 ] In contrary, the shift of peaks from 945.3 to 848.6 cm−1 is accompanied by band narrowing due to improving the SiN x film quality.[ Reference Tomar, Patil and Guatam 18 ] In our case, R decreasing results in the higher disorder of SiN x films due to increasing the Si excess content. Besides, N content lowering in plasma will stimulate more prominent incorporation of hydrogen in the films.[ Reference Delachat 13 ] This is evident as well by appearing a shoulder at about 650–660 cm−1 [Fig. 1(a)] that is related to the Si–H vibration modes.[ Reference Delachat, Carrada, Ferblantier and Slaoui 9 , Reference Tsu, Lucovsky and Mantini 17 ]
High-temperature annealing results in a transformation of FTIR spectra. Si–H related bands, as a rule, vanish due to hydrogen out-diffusion from the films. Simultaneously, the broken Si and N dangling bonds will try to saturate each other via the formation of Si–N and Si–Si bonds related to the Si phase [Fig. 1(b)]. Si–N peak increasing at 1180–1200 cm−1 demonstrates the formation of the Si/SiN x interface that is more prominent for films grown at higher R values [Fig. 1(b)]. However, the Si–N peak position at 900 cm−1 testifies on significant disordering in the films obtained at small R values that can be due to the presence of crystalline Si-QDs and amorphous Si phases (Fig. 1(b)).
The Si–N band position is well described by a model based on linear combination of weighted bonding density[ Reference Tsu, Lucovsky and Mantini 17 ] that allows determining the film stoichiometry x (Table I) using the formula:
 $$\nu _{{\rm LO}} = 323.4 \times \left( {x - 0.75} \right) + 1197.$$
This formula is based on the comparison of LO peak variation in studied films with its position in Si3N4 (~1197 cm−1). Additionally, the comparison of LO peak positions in as-deposited and annealed films allows estimating the residual Si excess in films after the Si-QD formation. In the films grown with R > 0.8, almost all excess Si atoms have been coagulated into Si-QDs. But the SiN x films fabricated with lower R still demonstrate the presence of excess Si [Fig. 1(c)].
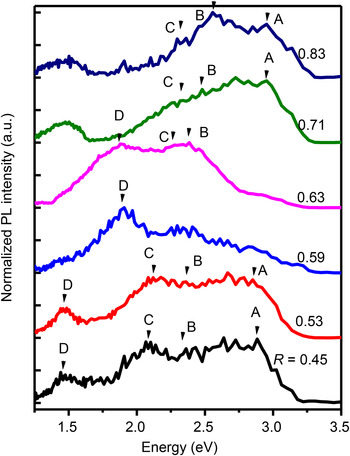
Room-temperature PL spectra of annealed samples demonstrate the variation of their shape versus film compositions (Fig. 2). With R decreasing the PL spectra demonstrate the appearance of asymmetry in the low-energy side (Fig. 2). The total PL peak position has shifted toward the lower energies, but it does not demonstrate a systematic shift with R (Fig. 2).
PL spectra of annealed films versus R measured at 3.82 eV excitation light energy. The spectra were normalized on the intensity of their maximum.

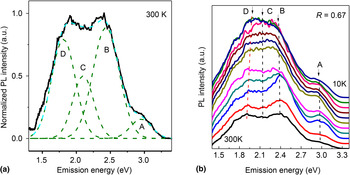
The analysis of PL spectra has revealed that all PL spectra can be decomposed (Fig. 3) on four PL bands with the maxima at: 2.87–2.99 eV (A), 2.42–2.54 eV (B), 2.10–2.25 eV (C), and 1.47–1.90 eV (D) in different samples. It is clear that PL peaks A, B, and C dominate in PL spectra of films grown at R = 0.71–1.0 (Fig. 2). The PL peaks A, B, and C shift at nearly 120 meV: from 2.99, 2.54, 2.25 eV down to 2.87, 2.42, 2.13 eV, respectively, with R decreasing (Fig. 2).
Deconvolution of PL spectrum (a) excited by the light with energy 3.82 eV and measured at 300 K for the film grown with R = 0.67. PL spectra (b) of the film obtained at R = 0.67 and measured in the range 10–300 K.

In SiN x films grown at R = 0.59–0.67, the PL band peaked at 1.90 eV (D) appears and dominates in PL spectra at 300 K (Fig. 2). Its peak shifts to 1.47 eV (Fig. 2) with increasing the Si content in the films when R decreases to 0.45. The spectral shift of D-band peak is more significant (430 meV) than the shifts of other PL bands A, B, and C related to changing the SiN x film compositions.
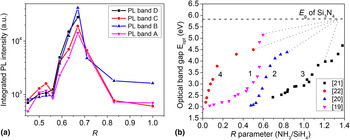
The evolution of integrated PL intensities for the PL bands A, B, C, and D versus R is presented in Fig. 4(a). PL intensities increase when R decreases from 1.0 to 0.71; approach the highest values for R = 0.59–0.67 and decrease for R ≤ 0.59 [Fig. 4(a)]. Figure 4(b) represents varying the optical band gap of SiN x films versus R obtained from published early papers (Refs Reference Nalwa19–Reference Kistner, Chen, Weng, Strunk, Schubert and Werner22). This figure shows that the quant energy of excitation light used (3.82 eV) becomes equal or exceeds the optical band gap in films grown at R ≤ 0.67 that explains the highest PL intensity observed for the films grown at R = 0.59–0.67 [Fig. 4(a)]. It is clear that our experimental results are in the agreement with those presented in Refs Reference Nalwa19, Reference Hsiao, Yang and Hwang20. Simultaneously, the possibility to detect the A- and B-PL bands in PL spectra of the films grown at R = 0.45–0.53 testifies on the large optical band gap (~3.0 eV) in these films being similar to the data of Ref. Reference Nalwa19.
The variations of integrated PL intensities (a) for different PL bands versus R. The variation of optical band gap (b) in SiN x films versus R were taken from Refs: 1- [Reference Nalwa19], 2- [Reference Hsiao, Yang and Hwang20], 3- [Reference Goncharova, Nguyen, Karner, D'Ortenzio, Chaudhary, Mokry and Simpson21], and 4- [Reference Kistner, Chen, Weng, Strunk, Schubert and Werner22].

Based on the models proposed early in Refs Reference Deshpande, Gulari, Brown and Rand23–Reference Warren, Lenahan and Curry25, the 2.87–2.99 eV (A) and 2.42–2.54 eV (B) PL bands can be ascribed to the native defects in SiN x , such as the N dangling bonds (N4 + and N2 0, ~3.0 eV) and the Si dangling bonds (called K0-centers, ~2.40–2.50 eV), respectively. The PL band at 590 nm (2.1 eV) was assigned early to oxygen related defects in SiN x .[ Reference Sain and Das 26 ] Another interpretation for the PL band 2.10–2.25 eV (C) was proposed in Ref. Reference Deshpande, Gulari, Brown and Rand23, where this band was attributed to the carrier recombination between N4 + and N2 0 energy levels in SiN x .
The PL band D demonstrates the shift of PL peaks from 1.90 to 1.47 eV with increasing the excess Si content and this shift (430 meV) is more significant than the shifts (120 meV) of other PL bands (Fig. 2). The last fact permits to assign the PL band D to exciton recombination inside of Si-QDs of different sizes. The size of Si-QDs can be estimated from the D peak positions using formula E = 1.13 + 13.9/d 2, proposed in Ref. Reference Cho, Kim, Park and Sung27. This estimation gives the Si-QD sizes from 3.5 nm up to 6.2 nm for varying the PL peak D from 1.90 to 1.47 eV, respectively. In case of a film grown with R = 0.63, the presence of Si-QDs with the size of 3.5–4.0 nm has been demonstrated by the bright-field HR-TEM.[ Reference Torchynska, Casas Espinola, Vergara Hernandez, Khomenkova, Delachat and Slaoui 11 ]
To gain insight on light-emitting mechanisms in SiN x films, PL measurements within the range of 10–300 K have been performed [Fig. 3(b)]. This investigation has revealed that the PL band D demonstrates the shift of PL peaks with heating (50 meV) similar to the shrinkage of the Si band gap. The D peak at 10 K was found to be 1.95 eV and it shifts to 1.90 eV at 300 K. Simultaneously, the other PL peaks A, B, and C do not change their peak positions with heating [Fig. 3(b)]. Taking into account the spectral position of the PL band D and its behavior at the variation of temperatures and Si excess contents, one can conclude that this PL band D is due to the exciton recombination inside of Si-QDs.[ Reference Torchynska, Torchynska and Vorobiev 28 ]
Integrated PL intensities of all PL bands decrease dramatically in films obtained at small R ≤ 0.56 [Fig. 4(a)] that can be owing to the enhanced non-radiative recombination, which is connected with the high residual amorphous Si content [Fig. 1(c)]. Additionally, it is clear that the PL intensity of D-band decreases faster versus R in comparison with intensities of others PL bands (Fig. 2). This fact can be related to the size enlargement of crystalline Si-QDs with increasing Si content that is accompanied by quenching the exciton emission efficiency inside of Si-QDs.[ Reference Torchynska 29 ]
Conclusions
Si-rich – SiN x films were fabricated by PECVD on the Si substrates. The PL spectrum investigation of SiN x films with different compositions gives the possibility to extract the information concerning different radiative channels in SiN x emission. The main contribution in PL spectra is given by the carrier recombination via native defects in SiN x films fabricated at R ≥ 0.63. In films obtained at R = 0.59–0.67, the exciton recombination inside of Si-QDs form the dominated radiative channel. The efficient non-radiative recombination was revealed in the films obtained at R ≤ 0.56 and attributed to the residual amorphous Si content in SiN x . The high PL intensity is determined in SiN x films obtained at R = 0.59–0.67.
Supplementary material
The supplementary material for this article can be found at https://doi.org/10.1557/mrc.2017.39.
Acknowledgments
The author T. T. thanks the SIP-IPN (project 20170821) and CONACYT, Mexico (project 258224), as well as L. K. thanks the National Academy of Sciences of Ukraine for the financial supports.