Does a criminal record inhibit access to social goods and services? Politics has long been understood as ‘who gets what, when, and how’ (Lasswell Reference Lasswell1936), but social scientists have only recently begun to explore how punitive policies influence this power structure (Manza and Uggen Reference Manza and Uggen2006; Weaver and Lerman Reference Weaver and Lerman2010). The state's power to punish is augmented by its ability to attach stigmatic labels to legal transgressors (Foucault Reference Foucault1977), labels that influence individuals' interactions with the state and society post-incarceration. Directly or indirectly, a criminal record can inhibit an individual's access to voting rights, employment, welfare and education (Manza and Uggen Reference Manza and Uggen2006; Owens and Smith Reference Owens and Smith2012; Pager Reference Pager2003). Even where access is not explicitly prohibited, formerly incarcerated persons often have to disclose their criminal record. These requirements complicate the bureaucratic process and present opportunities for discrimination.
To what extent, and in what context, do people with criminal records face discrimination? Experiments are frequently used in the social sciences to measure discrimination in access to social goods, including voting registration, public housing, employment and medical services (Bertrand and Mullainathan Reference Bertrand and Mullainathan2004; Pager, Bonikowski and Western Reference Pager, Bonikowski and Western2009; White, Nathan and Faller Reference White, Nathan and Faller2015). Most of these studies focus on racial discrimination, and generally find that minorities face discrimination in accessing goods and services (but see Einstein and Glick (Reference Einstein and Glick2017)). A small number of experiments has examined discrimination based on criminal record, primarily in hiring (Pager Reference Pager2003). Discrimination in higher education – an important determinant of political participation and recidivism – is understudied. Formerly incarcerated populations face deficits in educational attainment, and Blacks and other minority groups are under-represented in higher education (Hjalmarsson, Holmlund and Lindquist Reference Hjalmarsson, Holmlund and Lindquist2015). Punitive labeling by one state institution – the penal system – could negatively affect access to this social good that is also partially provided by the state.
We conducted a randomized field experiment to test for discrimination against formerly incarcerated college applicants. The experiment involved sending emails to 2,917 college admissions offices inquiring about the requirements for application and admission. We used a factorial design with three treatments, which we present in Table 1 and Figure B2. In each email, the applicant revealed that heFootnote 1 had a General Education Diploma (GED) and asked about eligibility for admission. The emails were randomly assigned, and with equal probability disclosed that the applicant got their GED either online or in a state penitentiary. To test for racial bias, the applicant is randomly assigned to have a putatively White or Black name. Our primary outcome of interest is the rate of response for different treatment conditions. The overall response rate is 74 per cent. Recognizing that bias can be multidimensional, we also consider two additional outcomes: the friendliness and thoroughness of the response.
Overview of treatment conditions

Note: This table describes the implementation of the three treatment conditions. The first column is the name of the treatment. The second column lists all possible values for each treatment. The third column summarize how the treatment was implemented.
Moving beyond measuring the degree of bias, we propose an intervention to help mitigate discrimination. We test whether the support of an advocate, in the form of a former teacher, can help marginalized populations extract information from potentially biased bureaucracies. Assuming that former teachers are unlikely to vouch for unqualified candidates, their endorsement can serve as a signal of applicant quality. If bias against formerly incarcerated individuals occurs when admission bureaucrats use a criminal record to proxy for unobserved characteristics of the applicant, an advocate can serve as an added credential (Gaddis Reference Gaddis2014). To implement the advocate intervention, we randomized whether the email was sent by the applicant or by a former GED instructor of the applicant. This is a low-cost intervention: using a short and simple email, the teacher reaches out on behalf of the applicant to inquire about college eligibility. To increase comparability between the applicant and advocate emails, we also randomized the race of the advocate. A Black applicant can have either a Black or a White advocate, and vice versa. In Table 1 and Figure B2, we document the three treatment conditions.
Admissions officers have significant discretion over whether and how they reply to prospective applicants. While colleges have admissions policies governing how criminal records can or cannot be considered, these policies do not explicitly extend to information provision. Furthermore, admissions policies themselves are often ambiguous, and create the opportunity for admissions officials to use their own discretion when interacting with potential applicants. Few colleges specifically bar the admission of applicants with felony criminal records, but almost all colleges retain the right to refuse admission based on past criminal activity, and often require additional forms or essays from formerly incarcerated applicants.Footnote 2 Thus admissions eligibility is often unclear, and formerly incarcerated applicants must overcome this first hurdle before applying.
We stress that our design measures bias in bureaucratic responsiveness, rather than bias in admissions. Admissions officials could feasibly have different incentives when responding to general inquiries vs. when deciding whether to admit or reject an applicant.Footnote 3 Still, bias in bureaucratic responsiveness at this entry point into the admissions process is likely to depress enrollment for formerly incarcerated applicants. Non-responsiveness inhibits an applicant's ability to obtain important information about enrollment requirements. Given the additional bureaucratic procedures required for applicants with criminal records, ascertaining eligibility is an important first step toward enrollment.
The relevance of information in college admissions is further underlined by a growing number of studies that examine interventions designed to increase access to admissions information (Bettinger et al. Reference Bettinger2012; Deming and Dynarski Reference Deming and Dynarski2010; Dynarski et al. Reference Dynarski2018; Hoxby and Turner Reference Hoxby and Turner2015). This literature finds that a lack of information strongly decreases the probability of application, enrollment and eventual success in college, particularly for applicants from lower socio-economic backgrounds. What is more, if formerly incarcerated applicants struggle to access crucial information, this can cause them to self-select out of the process (Rosenthal et al. Reference Rosenthal2015). Access to information is increasingly seen as a key determinant of success in higher education, highlighting the need to study bias in bureaucratic responsiveness to requests for admissions information.
Drawing on the results from our field experiment, we offer several contributions. First, to the best of our knowledge, this study is the first to establish the causal effect of a criminal record on bureaucratic responsiveness in the context of higher education. On average, formerly incarcerated individuals are about 5 percentage points less likely to receive a response from admissions offices. However, further results paint a more positive picture in two ways. First, even though we sent queries from putatively low-SES (socio-economic status) applicants, the response rates were relatively high, about 75 per cent. Secondly, contrary to a large body of empirical work, we demonstrate that bias does not extend to applicants' racial backgrounds: we found no difference in response rates for Black and White applicants.
In a second contribution, we explore treatment effect heterogeneity and demonstrate that institutional context is a key mediator of bias. Public institutions do not discriminate against prospective applicants with criminal records. Bias in response rates is driven by private colleges, which are about 10 percentage points less likely to respond than their public counterparts. In an additional analysis that was not pre-registered, we explored four explanations for why bias is more prevalent in private institutions: (1) Differences in admissions selectivity, (2) the socio-economic makeup of the student bodies, (3) differences in school finances and (4) institutional priorities. We tested the first three explanations using additional school characteristics from Chetty et al. (Reference Chetty2017), and found no evidence to support them. We did, however, find suggestive evidence that differences in treatment effects between public and private schools can be explained by private schools being far more likely to require disclosure of an applicant's criminal record. Admissions bureaucrats may internalize institutional priorities signaled by these policy differences, potentially explaining the differential treatment of formerly incarcerated applicants.
Our empirical results extend the literature in three important ways. First, we demonstrate the mark of a criminal record for a good that is provided both publicly and privately: higher education. Secondly, we document that context matters: admissions bureaucrats at private institutions are much less responsive to applicants who have spent time in prison than those at public universities. Thirdly, we move beyond measuring bias to test a strategy to reduce bias, but find no evidence that an advocate reaching out on an incarcerated applicant's behalf is effective in this context.
Empirical Strategy
As laid out in the pre-analysis plan, we contacted 2,917 public and private non-profit colleges across the United States. We constructed this sample from an exhaustive list of colleges operating in 2018 obtained from the National Center for Education Statistics (NCES). Each college admissions office received one email inquiring about information concerning the admissions process. The emails expressed interest in applying to the college, then reported that the applicant has a GED and asked if that would affect his eligibility. Finally, the emails inquired what else was required to apply and whether the college was currently accepting applications.
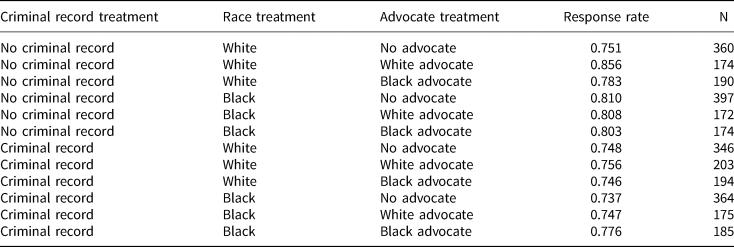
Each email was randomly assigned to treatment or control groups across three conditions: criminal record, race and presence of an advocate. The first two treatment conditions are binary: the applicant either has a criminal record or not, and the applicant is either Black or White. About 50 per cent of all colleges received emails sent directly from the applicant. The remaining emails were sent by a former teacher of the applicant (the advocate), who was either Black (25 per cent of all emails) or White (25 per cent of all emails). The former teacher inquired on behalf of the applicant without explicitly endorsing him. The advocate treatment can take on three values: no advocate, Black advocate or White advocate. Both the presence of the advocate and the advocate's race are independent of the applicant's race and criminal record. Our design results in 2 × 2 × 3 = 12 different treatment arms. Table 1 presents an overview of the treatment conditions, while Appendix Figure B2 shows the email language across treatment combinations. Table 2 reports average response rates and the number of emails sent for each of the twelve possible treatment arms.
Treatment arms, response rates and number of emails

Note: this table reports mean response rates and number of observations for all twelve possible treatment combinations.
We use the location at which the GED was obtained to signal that the applicant has spent time in prison. The applicant reports that he received his GED either at a state penitentiary (treatment) or online (control).Footnote 4 Signaling that the applicant has a GED allows us to keep SES constant across treatment conditions, thus lowering the probability that admissions officers conflate the treatments with social class. At the same time, it is feasible that having completed a GED in prison signals a serious commitment to education. Admissions officers may ascribe greater motivation or commitment to applicants who completed their GED in prison; therefore, our treatment could result in higher response rates for these applicants.
Moving to the race treatment, we use either a putatively Black (Tyrone Booker, Darnell Banks) or White (Kevin Schmidt, Bob Krueger) name to reveal race. We chose names that were not used in previous audit studies, and pre-tested those names for consistent racial connotations (we present the pre-test results in Appendix Table B1).
The advocate treatment changes the email language slightly. Instead of the applicant, a named advocate identifies himself as a former teacher of the applicant and then proceeds to inquire about the exact same information as in the standard direct email. The advocate is either White or Black with equal probability. As shown in Table 2, the advocate treatment is assigned equally across applicant race or criminal record. To rule out spurious effects that result from differences in email language, we have tried to make the applicant and advocate emails as similar as possible. Consequently, the advocate does not explicitly endorse the applicant beyond the fact that he or she is inquiring on their behalf.
Using an automated script, we sent 2,934 emails over the course of eight weekdays between 23 February and 6 March 2018 (roughly 360 per day). We randomized the order in which emails were sent; seventy-two emails could not be delivered, since the email addresses that we obtained were not up to date, or, in a few cases, the college did not exist anymore. For this subset of emails, we collected new contact information, and tried resending all emails on 12 March 2018. For all except seventeen colleges, this was successful, bringing our final sample size to 2,917.
Our main measure of bias is the responsiveness of the admissions offices, a binary variable coded as 1 if we received a response within 21 days and 0 otherwise. Recognizing that discrimination can be multidimensional (Hemker and Rink Reference Hemker and Rink2017), we include two additional outcomes, thoroughness and friendliness. As in Einstein and Glick (Reference Einstein and Glick2017), we conceptualize friendliness as a binary variable that we code as 1 if a response addresses the sender by name. Thoroughness is coded on a numeric scale from 0 to 3, based on whether the response answered the three questions posed in the email.Footnote 5 To avoid conditioning on a post-treatment variable (Coppock Reference Coppock2018), non-responses for the friendliness and thoroughness outcomes are coded as 0.
To construct the sample, we collected contextual data from the Integrated Postsecondary Education Data System, administered by the NCES. This database contains information on whether each school is public or private, whether it is primarily a four-year or two-year institution, and the size of the student body. These definitions and classifications are established by the NCES. A breakdown of the covariate distributions is shown in Appendix Figure B1. Four-year colleges constitute about two-thirds of the full sample, there are slightly more public than private institutions, and most schools have fewer than 5,000 students.
Each of these contextual variables could be associated with bureaucratic capacity, school policies or student recruitment strategies, which in turn may influence response rates. We used coarsened exact matching (CEM, see Iacus, King and Porro (Reference Iacus, King and Porro2012) and Appendix Section A.2) to ensure balanced treatment assignment across the three pre-treatment variables. Since the advocate race treatment depends on the presence of an advocate, we used simple randomization instead of pair matching to assign that treatment status. In Appendix Figure A3, we show that balance across the covariates is almost perfect.
For each of the three outcomes, we ran two baseline models: with and without covariates. We included controls for the three pre-treatment covariates used to define the CEM strata. Subsequently, we interacted the treatments to test whether bias varies by race or by the presence of an advocate. We also included non-parametric estimations of our main treatment effects to demonstrate that the results are not model dependent (Appendix Table B3). We then tested whether the treatment effects vary between public and private colleges. Below, we report the results of a number of unregistered additional analyses to explore why the effect of criminal records varies between public and private institutions.
Ethical Considerations
In designing the experiment, we took several steps to address important ethical concerns about the burden that audit studies impose on bureaucratic institutions, as well as the potential impact on the populations that rely on these bureaucracies. To minimize the administrative burden, we made the email language brief and asked questions that do not require lengthy answers. The ‘does getting a GED while incarcerated affect eligibility’ query and the ‘are you currently accepting applications’ portion commonly elicited very brief affirmative responses, while the ‘what else is needed to apply’ query was often answered by pointing to a website. In addition, we never corresponded with the admissions offices beyond the initial email.
Contacting a smaller number of colleges would have reduced the burden imposed by the study. While the resulting sample size might have been sufficient to detect the main effects, our pre-registered interaction effects require more observations. Since (1) these interactions are substantively relevant (for example, the interaction between applicant race and criminal record) and (2) the individual burden for each school is low, we decided to utilize a relatively large sample.Footnote 6
Our design utilizes deception, which risks alienating the study sample and potentially influencing future bureaucratic behavior, because it is the only way to test for real-world bias in responsiveness. We maintain that our research questions are of significant social importance to warrant such design choices (see also Einstein and Glick Reference Einstein and Glick2017, for a related discussion in a similar setting). Finally, to ensure anonymity, all of our analysis reports results in the aggregate; we do not report or share any identifiable information about schools or individuals.
Results
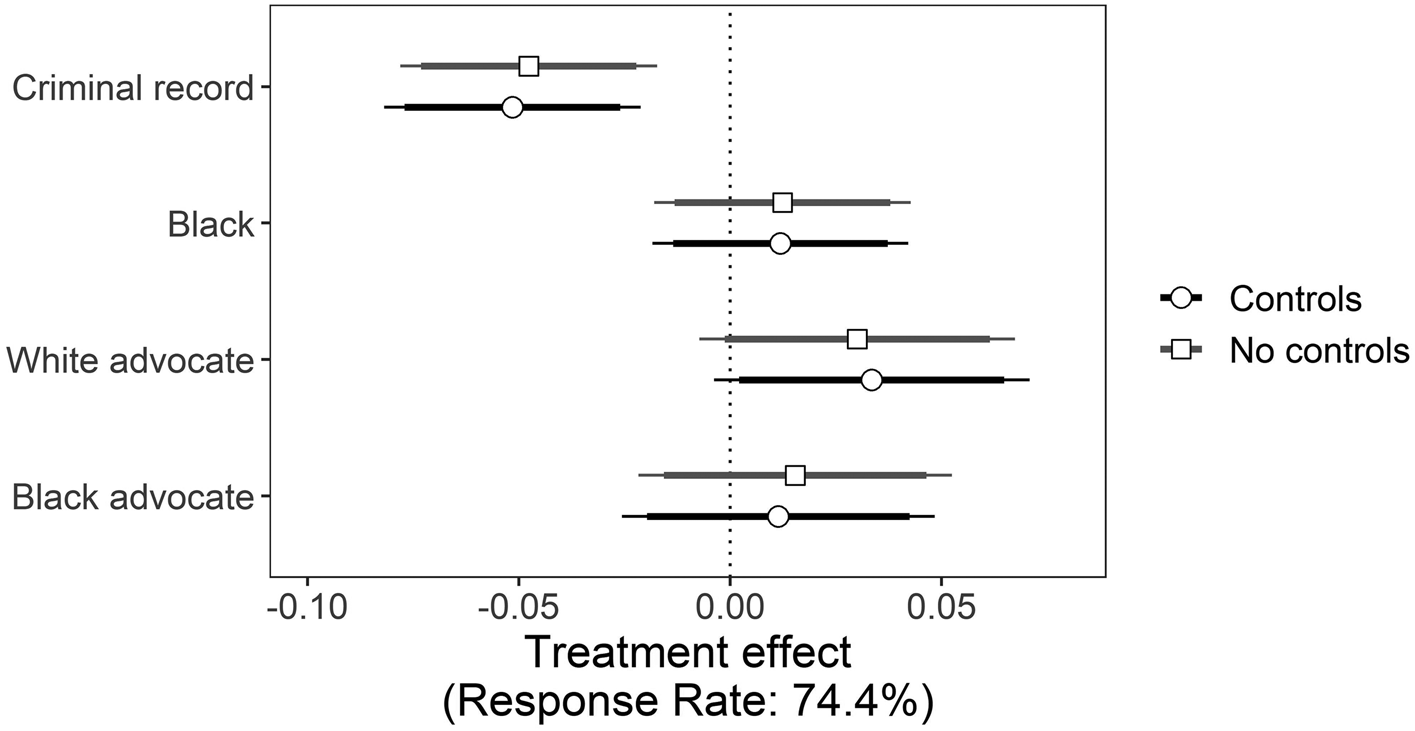
In Figure 1, we present the main results. All else equal, admissions bureaucrats are 5.2 percentage points less likely to respond to a formerly incarcerated applicant. For applicants with putatively Black names, we do not find any evidence of bias in response rates. In fact, average response rates are somewhat higher for Black applicants than for White applicants, although these estimates are statistically indistinguishable from zero. In Appendix Table B7, we present specifications that include interactions between the treatments. We do not have sufficient power to reject the null hypothesis for any of the interactions. However, we note that bias in responsiveness for formerly incarcerated applicants is stronger when the applicants are Black.
Main results
Note: the figure show coefficient estimates from the main specifications. Each pair of coefficients refers to a treatment, which is shown on the y-axis. The outcome is a binary response indicator. Positive effect sizes indicate that the treatment condition increases response rates. The average response rate is 74.4 per cent. The covariates are public/private, two-year/four-year, institution size and state fixed effects. The solid horizontal lines indicate 95 per cent confidence intervals.

Regarding the advocate treatment, there is little evidence that the intervention increases response rates. While we observe increased response rates for White (but not Black) advocates in one specification, the interaction models (see Appendix Table B7) show that the advocate effect decreases for applicants with criminal records.
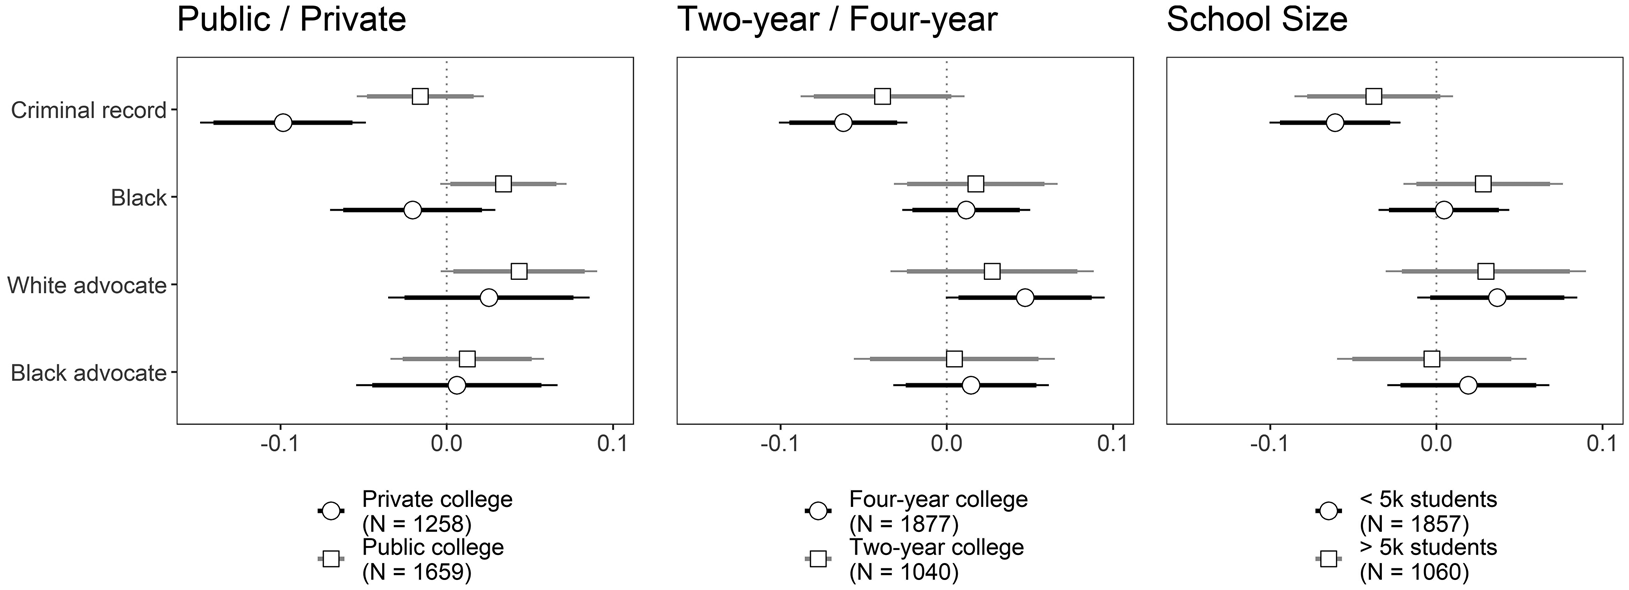
Having established that formerly incarcerated applicants are subject to bias, we examine whether the treatment effect varies with institutional characteristics in Figure 2. We observe the most pronounced heterogeneity when comparing bias at private vs. public colleges. Private college admissions bureaucrats are about 10 percentage points less likely to reply to formerly incarcerated applicants. Public schools demonstrate no detectable difference in response rates. These estimates are statistically distinct from one another, as we show in Appendix Table B6. The aggregate effects reported in Figure 1 are therefore driven by bias in private college admissions offices. We also find that private colleges do not appear to discriminate based on race, while public colleges tend to be more responsive to Black applicants. However, these effects are not precisely estimated (significant only at α = 0.1).
Results conditional on institutional characteristics
Note: the figures show coefficient estimates, subset by school characteristics. The treatments are shown on the y-axis. The outcome is a binary response indicator. The average response rate is 74.4 per cent. All specifications include covariates and state fixed effects. The covariates are two-year/four-year and institution size. The solid horizontal lines indicate 95 per cent confidence intervals.

Since bias can be multidimensional, we also examine two alternative measures of bias – thoroughness and friendliness. In Appendix Sections B.1 and B.2, we re-estimate all specifications discussed previously using these two outcomes. By and large, we observe the same patterns for the two alternative outcomes.
Given the large number of tests that we conduct, we adjust p-values using the Benjamini and Hochberg (Reference Benjamini and Hochberg1995) method to control for the expected proportion of incorrectly rejected null hypotheses. We present adjusted p-values in Appendix Tables B19 and B20. After adjusting for multiple comparisons, the observed negative effect of criminal records on response rates (see Figure 1) remains significant at α = 0.05. The adjusted p-value for the interaction between criminal records and public schools increases to 0.063.
Differences between Private and Public Institutions
What explains the disparity between public and private universities? While this statistical comparison was pre-registered, it was not one of the pre-stated primary focuses of the study. In response to the observed difference between response rates at public and private universities, we evaluate potential explanations for this difference, and test each explanation through additional unregistered analyses.
There are often tradeoffs in efficiency and equity between the public and private provision of goods and services (Niskanen Reference Niskanen1968). For example, Jilke, Van Dooren and Rys (Reference Jilke, Van Dooren and Rys2018) conducted an audit study to examine ethnic bias in responsiveness among public and private Flemish nursing homes. They found that discrimination against applicants with Maghrebian names was markedly more pronounced among private nursing homes. Additionally, an audit study of academic correspondence found bias against minority and women students, particularly at private universities (Milkman, Akinola and Chugh Reference Milkman, Akinola and Chugh2015). Regarding our findings, we propose four reasons why the effect of a criminal record varies across public and private colleges:
Selectivity: Since prior incarceration is often associated with lower academic achievement (Blomberg et al. Reference Blomberg2011), admissions bureaucrats at more selective private collegesFootnote 7 may not respond to inquiries if they believe the probability of admitting the prospective applicant is low.
Socio-economic composition: Contact theory (Pettigrew Reference Pettigrew1998) and familiarity bias (Tversky and Kahneman Reference Tversky and Kahneman1974) suggest that bureaucrats may be more willing to assist applicants with whom they are familiar. Public colleges may therefore be more responsive, as their student bodies consist of more students from racially and economically diverse backgrounds.
Financial considerations: Admissions bureaucrats may anticipate that formerly incarcerated or Black applicants are unable to pay for college without significant financial aid, so private schools, which are often more expensive and tuition dependent, may exhibit lower levels of responsiveness.
Institutional priorities: There may be differences in the overarching priorities of public vs. private colleges to pursue diversity or support underprivileged groups. Public higher education policy in the United States is founded on the principle of ‘[e]quality of opportunity for all students to attend public higher education in their state, without regard to their background or preparation’ (Bastedo and Gumport Reference Bastedo and Gumport2003, 341). Yet such a prerogative does not explicitly apply to private colleges, which might have different priorities when selecting prospective students. These differences in institutional priorities may be reflected in explicit policies, such as requiring applicant disclosure of a criminal record, that inform admissions bureaucrat behavior.
To test the first three explanations, we merged our data with college data from Chetty et al. (Reference Chetty2017). We tested whether treatment effects are driven by admissions rejection rate or average SAT score (selectivity), racial demographics, parental median income, percentage of parents in the top 1 per cent of the nationwide income distribution (socio-economic composition), and tuition sticker price and net costs after financial aid (financial considerations). We found little evidence that selectivity, socio-economic differences or financial considerations underlie the public–private differences we identified. Appendix Tables B10 and B11 present the effect of time in prison on responsiveness subset by public and private, with interactions between the treatment the aforementioned variables from the Chetty et al. (Reference Chetty2017) data. The magnitude of the treatment effect remains relatively unchanged despite the inclusion of interactions, and the coefficients on the interactions are all effectively zero. Thus none of these characteristics appears to be responsible for the public–private differences in responsiveness.
To test whether differences in admissions policies reflect differences in admissions officer behavior, we merged our data with data from Stewart and Uggen (Reference Stewart and Uggen2020) on whether colleges require in their application disclosure of a criminal record. These data consist of 1,330 4-year universities and the policies were current as of 2015, while our experiment was run in early 2018. In this sample, private schools are far more likely than public schools to require disclosure of an applicant's criminal record (Figure B3), and the treatment effect of a criminal record on response rate is greatest (most negative) for schools that require disclosure (Table B12), although this discrepancy is imprecisely estimated. While not conclusive, this raises the possibility that private schools may be exhibiting bias against applicants with criminal records because of bureaucratic policies that prioritize requiring this bias-inducing information.
Discussion
Using a nationwide randomized field experiment, we established the causal effect of a criminal record on bureaucratic discrimination in college responsiveness. Punitive labeling by the state has demonstrable effects on access to higher education, a vital social good with downstream effects on political participation, labor market outcomes and recidivism. While not a direct test of bias in college admissions, our results speak to a growing literature that highlights the lack of information as a barrier to successful college admissions (see, for example, Hoxby Reference Hoxby2009), especially for low-SES applicants (Dynarski et al. Reference Dynarski2018).
While we document bias against formerly incarcerated applicants, we also highlight two positive results – a high overall response rate and no evidence of racial bias in responsiveness. Although we sent queries from fictional applicants with putatively low SES, about three-quarters of all enquires received a reply within three weeks. Unlike audit studies in other contexts (Costa Reference Costa2017), we do not find evidence of racial discrimination. We offer two possible explanations for this. First, all applicants have GEDs, which holds social class constant. If bias against putative Black applicants occurs when admissions bureaucrats conflate race with social class or education, holding education constant should eliminate some of this bias. This finding is consistent with Einstein and Glick (Reference Einstein and Glick2017), who find no racial bias when applying to public housing – a setting in which applicants have similar SES and where minorities are disproportionately represented.Footnote 8 The second possible explanation is that colleges may have successfully implemented policies to curb racial bias in admissions offices, for example because they strive for a diverse student body. Yet, while colleges may have been successful at curbing one dimension of bias in responsiveness (racial bias), more effort needs to be directed at decreasing bias against formerly incarcerated applicants.Footnote 9
Akin to prior research on bureaucratic bias (Jilke, Van Dooren and Rys Reference Jilke, Van Dooren and Rys2018), our work highlights stark differences in the behavior of public vs. private institutions. We find that discrimination by public colleges is close to zero, while private colleges discriminate at significantly higher rates. We propose four explanations for the observed public–private divide: (1) admissions selectivity, (2) the economic and racial makeup of the student body, (3) financial aid and dependence on tuition, and (4) differences in institutional priorities. To examine those explanations, we conducted several exploratory analyses that were not pre-registered. Using college characteristics compiled by Chetty et al. (Reference Chetty2017), we found little evidence to support the first three mechanisms. Using data from Stewart and Uggen (Reference Stewart and Uggen2020), we did find some evidence that colleges that require disclosure of applicant criminal records were more likely to exhibit bias against applicants with criminal records, and private schools are far more likely to require this disclosure than public schools. This suggests that admissions bureaucrats have different bureaucratic priorities, and the fact that private schools are more likely to require disclosure of a criminal record signals to the admissions officers that this information may warrant differential treatment. Future research could further connect admissions policies to admissions bureaucrats' behavior, and better investigate why these differences in admissions policies emerge.
Moving beyond measurement, we propose a strategy for marginalized populations to navigate biased bureaucracies (see Butler and Crabtree Reference Butler and Crabtree2017). Instead of a direct inquiry from an applicant, some emails were sent by advocates. However, we found little evidence that emails from former teachers can ameliorate the effects of a criminal record. While we found some evidence of increased response rates for White (but not Black) advocates, the interaction models (see Appendix Table B7) show that the advocate effect is greatly reduced for applicants with criminal records. We offer two explanations for why the advocates were unable to reduce bias. First, the advocate email did not directly endorse the applicant. Since our aim was to make emails comparable across advocates and applicants, we did not include an explicit endorsement. The advocate email might therefore be a weak signal of applicant quality – too weak to convince admissions bureaucrats. Secondly, applicants will likely have to submit teacher recommendations when they apply to college. Bureaucrats may expect that any potential applicant will be able to obtain endorsements from their teachers anyway, so the advocate email might not reveal additional information. Although we found little evidence that advocate endorsements help reduce bias, future research should examine more nuanced implementations of the advocate intervention.
Our findings show that the absence of racial differences in responsiveness does not imply a lack of bias along other dimensions, such as applicants' criminal histories. Echoing the results in Einstein and Glick (Reference Einstein and Glick2017), we find that bias may vary substantially, even when we hold constant the social good that is provided. Future researchers could examine why the same bureaucracy is biased along one dimension, but not the other.Footnote 10 In addition, we argue that future work on bureaucratic bias needs to emphasize institutional differences in service provision, as many goods and services are routinely provided by both private and public actors, such as housing, health care, transportation and education.
Supplementary material
Online appendices are available at https://doi.org/10.1017/S0007123420000848. This experiment was pre-registered with Evidence in Governance and Politics. The pre-registration materials can be found at https://osf.io/dpzv6/.
Acknowledgements
We are particularly indebted to Devah Pager for detailed feedback in the early stages of the project. This study has benefited from conversations with Jennifer Hochschild, Vesla Weaver, Ryan Enos, Maya Sen, David Deming, Alex Keyssar, Anselm Hager, Riley Carney, Michael Zoorob, David Jud, Alex Mierke-Zatwarnicki, Shom Mazumder, Abraham Aldama, Mitchell Kilborn and audiences at the Harvard American Politics Research Workshop, the MPSA 2018, and Harvard's Proseminar on Inequality and Social Policy. We also thank Robert Stewart and Christopher Uggen for sharing their data with us.
Data availability statement
Data replication files can be found in Harvard Dataverse at: https://doi.org/10.7910/DVN/WAYA0D
Financial support
This work was supported by the Experiments Working Group and the Center for American Political Studies at Harvard.
Ethical standards
This research has been approved by Harvard Institutional Review Board (IRB17-0603). We also discuss the ethics of this project in the main text.