I. INTRODUCTION
As one of the most promising superconductor materials,Reference Nagamatsu, Nakagawa, Muranaka, Zenitani and Akimitsu1 MgB2 has been studied extensively.Reference Bugoslavsky, Cohen, Perkins, Polichetti, Tate, Gwilliam and Caplin2–Reference Souma, Machida, Sato, Takahashi, Matsui, Wang, Ding, Kaminski, Campuzano, Sasaki and Kadowaki6 On the one hand, its high critical temperature (T c), low material cost, freedom from weak links,Reference Larbalestier, Cooley, Rikel, Polyanskii, Jiang, Patnaik, Cai, Feldmann, Gurevich, Squitieri, Nans, Eom, Hellstrom, Cava, Regan, Rogado, Hayward, He, Slusky, Khalifah, Inumaru and Haas5, Reference Kambara, Babu, Sadki, Cooper, Minami, Cardwell, Campbell and Inoue7 and multiple energy gapsReference Souma, Machida, Sato, Takahashi, Matsui, Wang, Ding, Kaminski, Campuzano, Sasaki and Kadowaki6, Reference Kotegawa, Ishida, Kitaoka, Muranaka and Akimitsu8, Reference Takasaki, Ekino, Muranaka, Fujii and Akimitsu9 have attracted considerable attention for practical applications. On the other hand, several problems exist that urgently need to be solved, such as its low upper critical field (H c2) and its rapidly decreasing critical current density (J c) under increasing magnetic field, as compared to Nb-based superconductors. Currently, from a more practical and scalable point of view, addition and substitution of nanoparticles, which cause chemical and nanostructural changes in MgB2, seem to be an effective way to induce flux pinning centers in MgB2, thereby improving J c and H c2.Reference Dou, Soltanian, Yeoh and Zhang10 However, from the point of view of substitution into the lattice, only substitution of Al on Mg sites and substitution of C on B sites have proven to be possible for higher doping levels. Other substitutions, such as those involving transition metal elements (Fe, Y, Ti, Zr) in the Mg sublattice are limited to very low concentrations. In addition, compound doping with SiC,Reference Dou, Soltanian, Horvat, Wang, Zhou, Ionescu, Liu, Munroe and Tomsic3, Reference Kumakura, Kitaguchi, Matsumoto and Hatakeyama11, Reference Sumption, Bhatia, Dou, Rindfleisch, Tomsic, Arda, Ozdemir, Hascicek and Collings12 the most popular choice, and B4CReference Yamamoto, Shimoyama, Ueda, Katsura, Horii and Kishio13 is effective for enhancement of the irreversibility field (H irr) and J c under higher magnetic fields. Several types of oxide doping, such as with Y2O3,Reference Wang, Bugoslavsky, Berenov, Cowey, Caplin, Cohen, Cooley, Song and Larbalestier14 SiO2,Reference Matsumoto, Kumakura, Kitaguchi and Hatakeyama15 TiO2,Reference Xu, Grivel, Abrahamsen and Andersen16 CeO2,Reference Gharaibeh, Albiss, Jumah and Obaidat17 and Nd2O3Reference Yao, Zhang, Wang, Cao, Wang, Qi, Wang, Ma, Awaji and Watanabe18 have also shown positive effects on J c and H irr.
The authors’ group has noted that antimony trioxide (Sb2O3) has a relatively low melting point, 655 °C, which is quite close to the melting point of Mg, 650 °C. The Mg and B reaction with added Sb2O3 dopant could involve not only Mg + B → MgB2 but also Mg + Sb2O3 → Mg3Sb2 + O2 above 655 °C. In our recent study of the effects of atmosphere on J c of MgB2, the particular amount of O2 might play a very important role. (Results will be published elsewhere.) This is another reason why metal oxides have been attracting more attention than other possible dopants. These results have particularly attracted our interest towards codoping with Sb2O3. So, in this article, we report on a systematic study of the effects at different doping levels of the addition of nanoparticle Sb2O3 to MgB2.
II. EXPERIMENT DETAILS
MgB2 bulks were prepared by the in-situ method. Powders of Mg (99%) and amorphous B (99%) were used in a stoichiometric ratio as starting materials. To investigate the effects of doping on MgB2 bulks, we added Sb2O3 nanoparticles (90–210 nm) with a purity of 99.9%. The ratios of Sb2O3 to MgB2 (hereafter termed the doping ratios) in the samples were 0, 2.5, 10, and 15 wt%. The powders were well ground and pressed with a 9 ton press into stainless steel tubes 13 mm in outer diameter and 10 mm in inner diameter. This packing process was carried out in air. All samples were heated from room temperature to the sintering temperature of 800 °C and held at that temperature for 30 min in a tube furnace under Ar atmosphere at ambient pressure. The samples were then furnace cooled to room temperature. The resultant samples with 2.5, 10, and 15 wt% Sb2O3 were designated Samples A, B, and C, respectively. A pure MgB2 sample, made without dopant and by applying the same process, was also fabricated for comparison. It is defined as the reference sample. The obtained MgB2 samples were examined by a Philips PW1730 X-ray power diffractometer (Philips, Eindhoven, Netherlands) with CuKα radiation (λ = 1.541838 Å). The X-ray diffraction (XRD) patterns were collected over a 2θ range from 20° to 80° with a step size of 0.02°. Lattice parameter calculations and quantitative phase analysis were carried out based on the XRD patterns. Magnetic measurements of the samples were conducted in a commercial Quantum Design Physical Properties Measurement System (Quantum Design, Inc., San Diego, CA). The samples were cut into rectangular blocks for measurements. Their dimensions were accurately measured with a digital micrometer. The typical dimensions of the samples used for magnetization measurements were 0.7 × 1.5 × 4.5 mm3. The DC magnetic response was obtained in an applied low field of 1 Oe using the conventional zero-field-cooled (ZFC) and field-cooled (FC) procedures. Magnetic hysteresis loops were collected at temperatures of 5 and 20 K. The critical current density, Jc, was derived from the half-width of the magnetization difference between the descending branches (M +) and ascending branches (M −) of the magnetization loop, using the following critical state model formula: J c = k∆M/d, where k = 12w/(3w−d) is a geometrical factor and ∆M = (|M +| + |M −|)/2/Vl × w × d, with l, d, and w being the sample length, thickness, and width, respectively. Resistivity measurements as a function of temperature and magnetic field were collected using a four-probe resistance technique.
III. RESULTS AND DISCUSSION
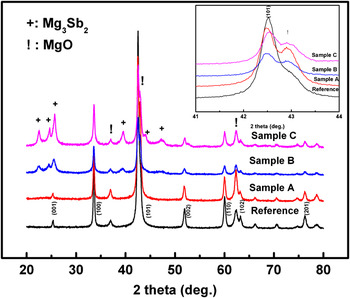
The XRD patterns for the pure reference sample and Samples A, B, and C are presented in Fig. 1. All the samples seem to be well-developed MgB2 with MgO impurity. The relative XRD peak intensity ratio of MgO (200) to MgB2 (101) significantly increases from the reference sample to Sample A, as shown in the inset of Fig. 1. This indicates that a large amount of MgO has been formed after doping with Sb2O3. As the doping ratio increases from Sample A to Sample B and Sample C, the relative XRD peak intensity ratio of MgO (200) to MgB2 (101) remains nearly constant. Another impurity, Mg3Sb2, appears in Samples B and C, although it is not observable in Sample A due to the low doping level. From Sample B to Sample C, the Mg3Sb2 peak intensities increase compared to the MgB2 intensities. The decomposition temperature of the dopant Sb2O3 is about 655 °C, which is below the sintering temperature of 800 °C in this work. For the low doping ratio samples, Mg in the doped samples reacts with the decomposed oxygen to form MgO, while the decomposed Sb is solubilized into the MgB2. As the doping ratio increases to a certain level, the Sb solution becomes saturated. For further increased doping ratios, it seems that Mg prefers to react with Sb rather than oxygen. Therefore, the amount of Mg3Sb2 increases from Sample A to Sample B and Sample C, while the amount of MgO remains nearly unchanged.
X-ray diffraction patterns for the different samples. The inset shows an enlargement of the region of the main peak.

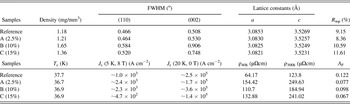
The full-width at half maximum (FWHM) of the indexed peaks of the XRD patterns for all samples are shown in Table I. The most heavily doped samples exhibit larger FWHMs than the reference sample. In general, a larger FWHM indicates a small particle size, amorphization, and large lattice parameters due to strain arising from the doping. The Rietveld refinement method was used to analyze quantitively the XRD measurements. A measure of similarity (R wp) between the measured diffraction pattern and the simulated diffraction pattern is shown in Table I. A low R wp indicates good agreement between the measured and simulated data. All the R wp values are below 12%. This indicates that the calculated results are acceptable. The refined lattice constants along the two lattice axes (a and c) are also listed in Table I. It can be seen that compared to the reference sample, both lattice constants are decreased in the doped samples. This indicates that oxygen atoms have diffused into the lattice in the doped MgB2. They may replace boron atoms to form MgB2−xOx precipitates, leading to the reduced lattice parameters. Since the diffusion concentration of the oxygen atoms increases with the Sb2O3 content, the lattice parameters slightly decrease from Sample A to Sample B and Sample C.
Parameters and properties for all samples.

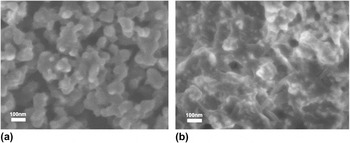
The connectivity can be estimated by the effective cross-sectional area (A F), defined as A F = Δρideal/(ρ300K−ρ40K).Reference Rowell4 Δρideal is the ideal change in resistivity from 300 to 40 K for a fully connected sample. It is set to be 7.3 μΩcm according to Ref. Reference Jiang, Senkowicz, Larbalestier and Hellstrom19 ρ40K and ρ300K were obtained from the resistivity measurements. The A Fs for all samples are listed in Table I. It can be found that the reference sample has the best connectivity, while Sample B has better connectivity than the other doped samples. Field emission scanning electron microscope (FE-SEM) images for the reference sample and Sample B are presented in Figs. 2(a) and 2(b), respectively. As can be seen from the FE-SEM images (Fig. 2), the average particle size of the 10% Sb2O3-doped sample is about 40 nm, which is smaller than that of the reference sample. This clearly indicates that the particle size has been refined by Sb2O3 doping. Double-doping with oxygen and Sb takes place in MgB2 with addition of Sb2O3. Oxygen can be incorporated within grains as precipitated nanoinclusionsReference Liao, Serquis, Zhu, Huang, Peterson, Mueller and Xu20, Reference Klie, Idrobo, Browning, Serquis, Zhu, Liao and Muelle21 or can alloy into the lattice.Reference Eom, Lee, Choi, Belenky, Song, Cooley, Naus, Patnaik, Jiang, Rikel, Polyanskii, Gurevich, Cai, Bu, Babcock, Hellstrom, Larbalestier, Rogado, Regan, Hayward, He, Slusky, Inumaru, Haas and Cava22 These alloyed phases and nanoinclusions may act as nucleation centers during the formation of MgB2 to reduce the MgB2 grain size. The results indicate that the solubility limit of Sb in MgB2 is between 2.5 and 10%. When the doping ratio exceeds 10 wt%, Mg3Sb2 impurity phase can be detected. The small amount of Mg3Sb2 in Sample B could enhance the grain connectivity and core density. Enhanced grain connectivity has been observed in an MgB2 tape with a small amount of MgO impurity phase (<2.5 wt%).Reference Jiang, Hatakeyama and Kumakura23 The presence of excess Mg3Sb phase at the grain boundaries in Sample C could result in degradation of grain connectivity.
Field emission scanning electron microscope images of (a) undoped and (b) 10% Sb2O3-doped MgB2 samples.

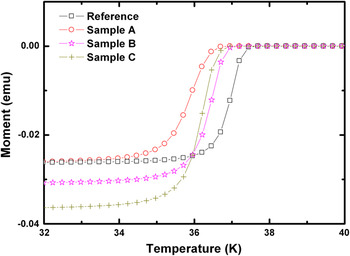
Figure 3 shows the magnetic susceptibility (χ) against the temperature in an applied field of H = 1 Oe for the ZFC samples. The magnetic susceptibility for the FC condition is not displayed in the figure, since the values are very close to zero. This demonstrates that the flux pinning force in all the samples is quite large. T c is defined as the temperature corresponding to the onset of diamagnetism. The T c onset for the reference sample is around 37.7 K. Sample A has a T c of 36.7 K. Samples B and C have the same T c of 36.9 K. Compared to the reference sample, the T c of all doped samples has decreased. The T c decrease might be a result of increased impurity phases introduced by Sb2O3 doping. The transition width (ΔT c) is defined as the temperature variation between 10 and 90% of the full drop in the magnetic susceptibility. For the reference sample, Sample A, Sample B, and Sample C, ΔT c is 0.98, 1.38, 1.2, and 1.23 K, respectively. The small ΔT c in the reference sample demonstrates that the defects are homogeneously distributed on the scale of the coherence length. All doped samples exhibit a higher ΔT c than the reference sample, suggesting that the distribution of defects is more inhomogeneous.
Magnetic susceptibility plotted against temperature for various doping ratios.

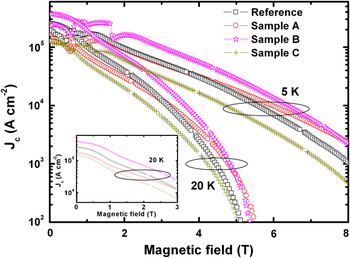
J c as a function of magnetic field are shown in Fig. 4. It can be seen that the J c performance in Samples A and B shows a significant improvement over that of the reference sample under high fields at both 5 and 20 K. However, the J c performance in Sample C has been degraded. At 5 K and 8 T, the J c values for Samples A and B are ∼2.4 × 10³ and ∼2.3 × 10³ A·cm−2, respectively, which are two times higher than for the reference sample. It is well known that grain boundary pinning is the major pinning mechanism at high fields in MgB2.Reference Eisterer24 The J c caused by the surface pinning can be estimated by  ,Reference Dew-Hughes25 where S v is the grain boundary surface area per unit volume, κ the Ginzburg–Landau parameter, H c2 the upper critical field, and H the applied field. It can be seen from this equation that J c at high fields is predominantly determined by S v and H c2.Reference Eisterer24 In addition, J c is also proportional to the connectivity (A F).Reference Eisterer24 Therefore, higher H c2, smaller grain size, and better connectivity lead to higher J c at high fields.
Magnetic field dependence of the critical current density J c at the temperatures of 5 and 20 K for various doping ratios. Inset: 20 K low field J c.

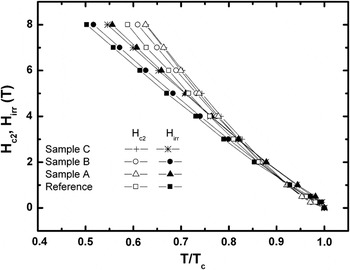
The H irr values at 20 K, determined by the 100 A/cm2 criterion from Fig. 4, are 5.13, 5.51, 5.37, and 4.97 T for the reference sample and Samples A, B, and C, respectively. Since the difference between H c2 and H irr in MgB2 is not significant, it is expected that H c2 at 20 K follows the same trend. Figure 5 displays the normalized temperature dependence of the resistive H c2 and H irr, which are obtained from the respective fields at 90 and 10% of the normal state resistivity. It can be seen that H c2 of the reference sample is higher than that of Sample A for T/T c > 0.7. However, H c2 for Sample A increases faster than for the reference sample as the temperature decreases for T/T c < 0.7. It is reasonable to predict that Sample A has higher H c2 than the reference sample at 20 K (T/T c ≈ 0.5). This is consistent with the H c2 trend observed from the magnetic field measurements, namely H c2 at 20 K increases from the reference sample to Sample A, and decreases from Sample A to Samples B and C. According to H c2 = Φ0/(2πμ0ξ2), where ξ is the coherence length, Φ0 the superconducting flux quantum, and μ0 the magnetic permeability, H c2 is determined by ξ. H c2 increases as ξ decreases. Since ξ increases with the mean free path, all the factors influencing the mean free path will change ξ and, in turn, change H c2. There are two major influences that reduce the mean free path. One is lattice distortion; the other is the scattering from substituting atoms and/or diffused atoms. Oxygen atoms have been diffused into the MgB2 lattice of Sample A due to addition of Sb2O3. This results in both lattice distortion and scattering. Therefore, Sample A exhibits a higher H c2 than the reference sample. As the content of Sb2O3 dopant further increases, the Mg3Sb2 phase appears from Sample B to Sample C, and its fraction increases from Sample B to Sample C. Since the powders of Mg and amorphous B were stoichiometrically mixed to form MgB2, the existence of Mg3Sb2 indicates that there must be Mg deficiency, leading to vacancies or voids in the MgB2. The vacancies and voids can increase the coherence length and thus reduce H c2 in Samples B and C.
Temperature dependence of H c2 and H irr.

Even though the connectivity is degraded in the doped samples (Table I), H c2 increases significantly from the reference sample to Sample A. The higher H c2 enhances the J c performance of Sample A at high fields. In addition, the decreased grain size in Sample A, as indicated by the FWHM values in Table I, is also helpful to enhance J c. Comparison of Sample A and Sample B shows that Sample B has a higher connectivity and a smaller grain size, but it has a lower H c2. Higher connectivity and smaller grain size increase J c, while lower H c2 decreases J c. The opposite effects result in the slight change of J c from Sample A to Sample B. Sample C has the lowest connectivity and H c2, which leads to the lowest J c at high fields.
At zero field and 20 K, J c values of the reference sample and of Samples A, B, and C are ∼2.5 × 10⁵, ∼1.7 × 10⁵, ∼3.6 × 10⁵, and ∼1.4 × 10⁵ Acm−2, respectively. The zero-field J c of Sample B is higher than those of the other samples, while Samples A and C have lower zero-field J c than the reference sample. The self-field J c is proportional to the connectivity and H c2. The good connectivity and higher H c2 in Sample B, as mentioned above, are the main reasons why the highest J c exists in this sample.
IV. CONCLUSION
MgB2 bulks have been fabricated with/without Sb2O3 doping. The effects of Sb2O3 doping on T c, J c, H irr, and H c2 have been investigated. It has been found that Sb2O3 doping results in a small depression in T c, while H c2 performance is improved. The best performance is shown in the 2.5% Sb2O3-doped sample. The reason for the enhancement of J c is attributed to the enhancement of H c2, which is caused by the increased disorder.
ACKNOWLEDGMENTS
The authors thank Dr. T. Silver, Dr. D. Attard, and Dr. X. Xu for their helpful discussions. This work was supported by the Australian Research Council, Hyper Tech Research Inc., and the University of Wollongong.